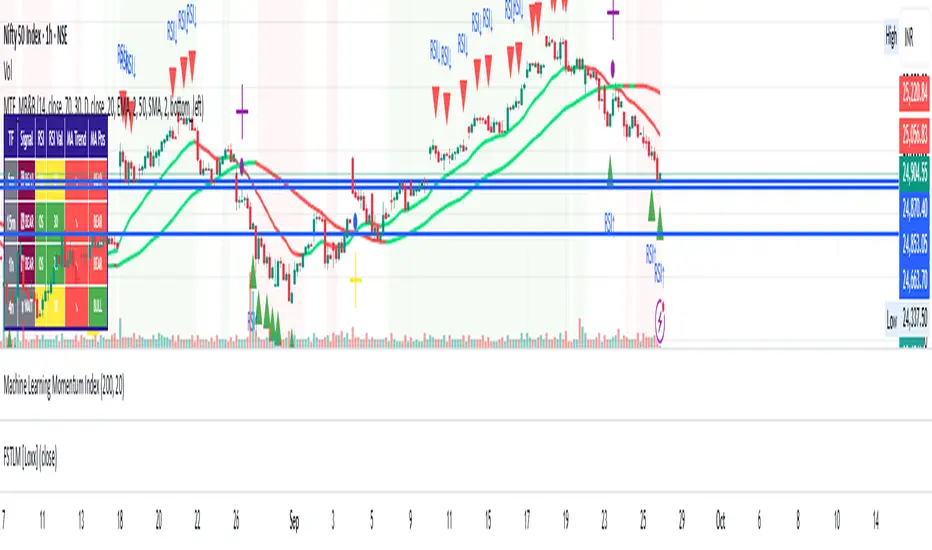
Multi-Timeframe mybullandbearThis Multi-Timeframe RSI + Ultimate MA System combines RSI and customizable moving averages (SMA, EMA, WMA, HullMA, VWMA, RMA, TEMA) to generate powerful buy/sell signals across 5m, 15m, 1h, and 4h timeframes. Visualize signals with clear chart labels (BUY/SELL) and a multi-timeframe table showing RSI status, MA trends, and signal strength. Ideal for traders seeking trend confirmation and reversal signals.
Enable/disable RSI, MA cross, or combined signals, and adjust MA types/lengths. Use aligned signals across timeframes for stronger entries. Best with backtesting for your asset.
在腳本中搜尋"ma cross"
Merged Strategy with $1 TP (Avg Price)Merged Strategy with $1 TP (Avg Price)" is a custom Pine Script that combines moving average signals with an averaging technique. It opens trades based on MA crossovers, manages multiple entries, and automatically sets a fixed $1 take-profit target calculated on the average entry price. The strategy is designed for scalpers who want small, consistent gains without using stop-loss.

All-In-One MA Stack ScalperWhat is this Indicator?
This tool is an advanced, multi-layered breakout and trend-following indicator designed for lower timeframes. It identifies high-conviction buy and sell signals by combining moving average stacking with a suite of professional-grade filters.
How Does It Work?
A signal is generated only when ALL of the following conditions are met:
Moving Average Stack (5M Chart):
Buy: The close price is above all five moving averages (MAs: 100, 48, 36, 24, 12).
Sell: The close price is below all five MAs.
Volatility Filter (ATR):
Signals only print when the current ATR (14) is at least 80% of its 100-period average, ensuring you only trade in actively moving markets.
Candle Structure Filter:
The current candle must have a real body that is at least 35% of the candle’s total range, filtering out dojis and indecision bars.
Big Candle Filter:
The candle’s total range must be at least 40% of the current ATR, avoiding signals on minor, insignificant moves.
Volume Filter:
The current volume must be at least 80% of its 50-period average, filtering out signals during illiquid or quiet market conditions.
Minimum Distance from All MAs:
Price must be a minimum distance (20% ATR) away from each MA, confirming a clean breakout and avoiding signals in tight MA clusters or ranging markets.
RSI Momentum Filter:
Buy: RSI(14) must be greater than 55.
Sell: RSI(14) must be less than 45.
This ensures trades are only taken in the direction of momentum.
ADX Trend Filter:
ADX(14,14) must be above 20, ensuring signals only print in trending conditions (not in chop/range).
Minimum Bars Between Signals:
Only one signal per direction is allowed every 10 bars to avoid overtrading and signal clustering.
What Does This Achieve?
Reduces noise and false signals common in basic MA cross or stack systems.
Captures only strong, high-momentum, and high-conviction moves.
Helps you avoid chop, range, and news whipsaws by combining multiple market filters.
Perfect for advanced scalpers, intraday trend followers, or as a trade filter for algos/EAs.
How to Use It:
Apply to your 5-minute chart.
Green BUY signals: Only when all bullish conditions align.
Red SELL signals: Only when all bearish conditions align.
Use as a stand-alone system or as a filter for your own entries.
Recommended For:
Scalpers & intraday traders who want only the best opportunities.
EA and bot builders seeking reliable signal logic.
Manual traders seeking confirmation of high-probability breakouts.
Tip:
Adjust any of the filters (e.g., RSI/ADX thresholds, minBars, minDist) to make it more/less selective for your style or market.


Wyckoff Schematic - Accumulation [TrendX_]Wyckoff Schematic 1 - Accumulation is an advanced Wyckoff method tool on TradingView, designed to automate the identification of critical phases and price structures within the Wyckoff Accumulation Schematic. By detecting key events such as SC (Selling Climax), AR (Automatic Rally), Spring, and SOS (Sign of Strength), this tool helps traders visualize institutional accumulation patterns, anticipate trend reversals, and identify potential entry points aligned with the Wyckoff model—all without requiring hours of manual monitoring. The indicator dynamically labels key points, draws accumulation zones, and triggers alerts upon phase confirmations, reducing manual analysis and emotional bias.
💎 FEATURES
▶ Phase A: Bottom Identification
Auto-detects Selling Climax (SC), Automatic Rally (AR), and Secondary Test (ST).
Customizable initial trend detection: FTD (Follow-Through Day), Market Structure Shift, Triple MA Crossover, or Ichimoku Cloud.
▶ Phase B: Accumulation Range Formation
Identifies SOS(b) and ST(b) in Phase B
Customizable sweep levels for ST detection: previous SC / ST(a) / Fibonacci retracement levels of AR & SC.
▶ Phase C: Accumulation Confirmation
Flags Spring (false breakdown) and Test (confirmation of false breakdown).
▶ Phase D: Breakout Preparation
Detects SOS and BU/LPS for breakout confirmation.
▶ Visual Tools
Auto-draws accumulation range SC, AR, SOS(b) with real-time extensions.
Labels all critical events (SC, AR, ST, SOS, Spring, LPS) with text and markers.
Draws colored boxes for confirmed phases A, B and C, and triggers alerts for start of Markup with SOS and BU/LPS.
🔎 BREAKOUT
Phase A: Halting the Downtrend
▶ Key Events: SC, AR, ST(a).
▶ Functions:
SC: Marks panic selling, often with high volume.
AR: Sharp rebound after SC, reflecting short-term demand.
ST(a): Retest of SC lows to confirm weakening supply.
▶ Importance:
Phase A signals the end of a downtrend. The SC shows exhaustion, while the AR and ST confirm that sellers are losing control. Customizable trend detection (e.g., Ichimoku Cloud or FTD) ensures alignment with broader market context or your preference.
Phase B: Building the Accumulation Range
▶ Key events: SOS (Pha B), ST (Pha B).
▶ Functions:
SOS(b): A rally breaking above the AR, indicating strong demand.
ST(b): Retests of SC / ST(a) / Fib level to sweep liquidity (trap late sellers).
▶ Importance:
Phase B confirms the sideways range. SOS reflects institutional buying, while ST(b) traps sellers. Sweeping SC / ST(a) / Fib level would help identify false breakdowns.
Phase C: Spring & Test
▶ Key events: Spring (false breakdown), Test (confirmation).
▶ Functions:
Spring: A deliberate drop below Phase B support to eliminate weak traders.
Test: Retest of the Spring low to confirm sustained demand.
▶ Importance:
Phase C is the final "shakeout" to confirm accumulation. The Spring traps weak hands, while the Test validates support, confirming the institution has bought enough, signaling readiness for Markup.
Phase D: Breakout / Start of Markup
▶ Key events: SOS, BU/LPS.
▶ Functions:
SOS: A strong rally breaking above the accumulation range.
BU/LPS: Pullback after SOS to retest the breakout level.
▶ Importance:
Phase D confirms the start of a Markup. SOS shows demand overpowering supply, while BU/LPS offers low-risk entry points.
Accumulation Range & Visual Tools
▶ Accumulation Range: Drawn between SC (low) and AR (high), reflecting institutional buying activity.
▶ Labels/Boxes: Clear labels (SC, AR, ST, SOS, Spring, …) track each phase.
▶ Alerts: Notifies users when SOS or BU/LPS appears.
🛠️ USAGE
▶ Configuration
Phase A: Select trend detection method based on your preference and trading style (FTD, Market Structure, Triple MA, Mây Ichimoku).
Phase B: Adjust sweep levels (SC, ST(a), Fibonacci 61.8% của AR & SC).
▶ Interpretation
Bullish Trend: Confirmed Phase C (Spring + Test) followed by SOS in Phase D.
▶ Trading Strategy
Enter long positions at BU/LPS (Phase D) with volume or momentum confirmation.
Uses other Break-out strategy after SOS appear for Long Entry.
DISCLAIMER
This indicator is not financial advice, it can only help traders make better decisions. There are many factors and uncertainties that can affect the outcome of any endeavor, and no one can guarantee or predict with certainty what will occur. Therefore, one should always exercise caution and judgment when making decisions based on past performance.

Daily Moving Averages on Intraday ChartsThis moving average script displays the chosen 5 daily moving averages on intraday (minute) charts. It automatically adjusts the intervals to show the proper moving averages.
In a day there are 375 trading minutes from 9:15 AM to 3:30PM in Indian market. In 5 days there are 1875 minutes. For other markets adjust this data accordingly.
If 5DMA is chosen on a five minute chart the moving average will use 375 interval values (1875/5 = 375) of 5minute chart to calculate moving average. Same 5DMA on 25minute chart will use 75 interval values (1875/25 = 75).
On a 1minute chart the 5DMA plot will use 1875 interval values to arrive at the moving average.
Since tradingview only allows 5000 intervals to lookback, if a particular daily moving average on intraday chart needs more than 5000 candle data it won't be shown. E.g 200DMA on 5minute chart needs 15000 candles data to plot a correct 200DMA line. Anything less than that would give incorrect moving average and hence it won't be shown on the chart.
MA crossover for the first two MAs is provided. If you want to use that option, make sure you give the moving averages in the correct order.
You can enhance this script and use it in any way you please as long as you make it opensource on TradingView. Feedback and improvement suggestions are welcome.
Special thanks to @JohnMuchow for his moving averages script for all timeframes.

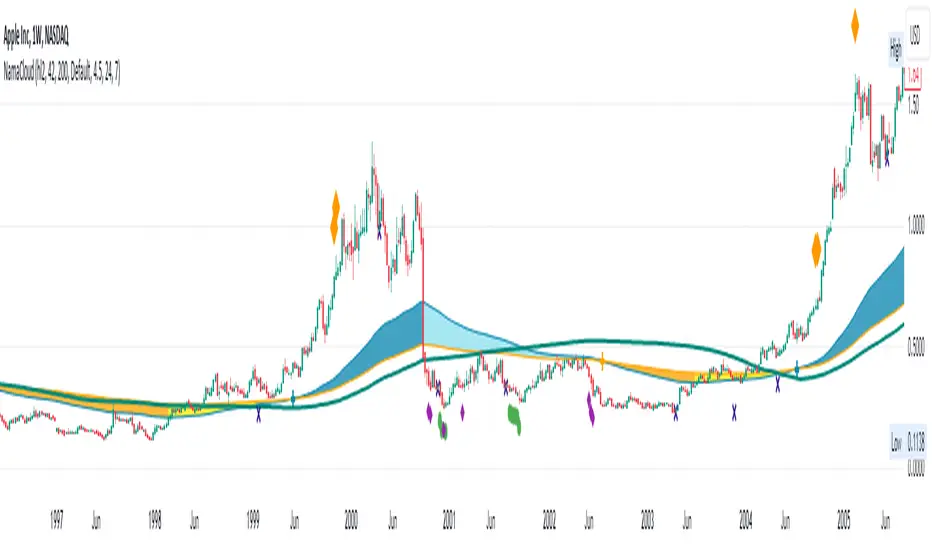
NAMA Cloud - Quan DaoApplication of Non-Adaptive Moving Average (NAMA) by using a fast and slow MAs to draw a trending cloud.
Using this indicator, one might have an overview look on the trend of the security now.
- These 2 MAs are NOT dependant on the starting length (thus user does not have to choose the length of the MAs anymore).
- When the fast MA is above the slow MA, most likely the trend is up (blue color).
- When the fast MA is below the slow MA, most likely it's an down trend (orange color).
- When the two MAs cross, most likely there will be a trend change (small or big) soon.
You can also show/hide a bands (ATR, Bollingers, ...) in this indicator as well.
Plot background depending on Index EMA 10 and EMA 20This indicator gives the user an easy way to check the conditions of the market.
Up market should be good for breakout traders.
Down market should be good for breakdown shortsellers
The others should be good for pullback buyers.
This script automaticlly check which index should be used for the depending on which ticker is view. If no match is found indicator will use IXIC as reference.
The script works for Nordic and US stocks.
"OMXSPI"
"OBX"
"OMXSPI"
"OMXHPI"
"OMXCPI"
"IXIC"
It then alculated the EMA10 and EMA20 for the index and plots the background depending on 6 differnet conditions.
EMA10 below EMA20 and EMA10 and EMA20 is sloping down. //Down market
EMA10 above EMA20 and EMA10 and EMA20 is sloping up. //Up market
EMA10 below EMA20 and EMA10 sloping up and EMA20 is sloping down. //First indication by market to move up
EMA10 above EMA20 and EMA10 sloping down and EMA20 is sloping up. //First indication by market to move down
EMA10 below EMA20 and EMA10 sloping up and EMA20 is sloping up. //Possible MA cross over
EMA10 below EMA20 and EMA10 sloping down and EMA20 is sloping down. //Possible MA cross over

RedK DIY ZLMA: Customizable Zero-Lag MA (Educational / Utility)This script is more of an educational / utility piece rather than a fully-fledged indicator - It provides an easy way to customize and produce a zero-lag Moving average that can then be used in various scenarios
What is DIY_ZLMA?
------------------------
The DIY ZLMA is for fans and enthusiasts of researching Moving Averages (like me) - the script enables the user to play around with one of the common approaches used to reduce lag in moving averages - which was explained in this old post below
Suggested uses of the DIY_ZLMA
---------------------------------------
* The Zero-lag approach here applies 3 moving average passes to a source data series - I'll refer to these 3 passes as Base MA Pass , De-lagging Pass, and Smoothing Pass - these "passes" can be customized from the indicator settings in terms of MA Length and type. The first pass allows the choice of a "source", and the second pass allows additional fine tuning by playing around with the magnification factor. The 3rd pass (smoothing) is optional and can be skipped altogether when needed. (as noted in the script, HMA and TEMA, which are very common low-lag MA's use slightly different approach in the calculation than the one used here .. so we can't get an equivalent of either of these MA's with the customization of DIY_ZLMA parameters)
* After the user experiments with the various settings for the 3 passes, and finds a "preferred combination", the script not only plots the resulting My_ZLMA - it also produces the "1-line Pine script formula" that the user can then use in any other script, maybe to smoothen some data series, or to combine with other types of moving averages to create multi-MA cross-over trading signals... and so on.
* The DIY_ZLMA can also be added to another indicator as a signal line using the Indicator-on-Indicator feature of TradingView (review this post for step-by-step -->
)
* the script also showcases couple of recent (and very neat) Pine features: the use of User-defined Types (UDT) and User-defined Methods - which are awesome and a lot of fun to work with :)
Since this is more of a utility piece, I added as many comments as possible to the script to explain the way it works - so it's more valuable if someone finds it by searching the "Add Indicator" feature in TradingView charts
Please feel free to play around with this new toy :) and share comments and feedback below if you find this useful. I truly hope you do.

Brute Force [TTF]The Brute Force indicator
This indicator is based on spotting and highlighting a particular activity pattern involving 3 moving averages:
A fast moving average that will track closely with price while still smoothing out some price chop
A middle moving average to help gauge short-term momentum
A slow moving average to help identify longer-term trends and potentially serve to also guide directional bias
A Time-Segmented Volume (TSV) indicator has also been incorporated to assist in finding more exact potential entry points based on volume change relative to a baseline. Since it may take a couple of candles for the TSV to "catch up" with our specific moving average pattern, we have also implemented a "delay" mechanism to all ow the moving average signal element trigger to remain valid for a configurable number of additional candles to see if the TSV aligns to confirm. If it does and all conditions are met, a rocket symbol (🚀) will be printed on the chart.
In addition to alerts aligning with the 🚀 symbol printing, additional alerts have been implemented to include:
Fast MA Cross Over/Under Mid MA
Price Close Above/Below Slow MA
Updates made after initial publication based on user feedback:
Added traditional alert conditions
Added the ability to configure the new style of dynamic alerts
Added a user-configurable option to allow the indicator signals to repaint on real-time data*
Added the ability to change the signal symbol style, size, shape, and color
Added tooltips to all indicator settings to help users better understand how the affect the indicator operation and how to update them if desired
Updated the dynamic/script-native alerts to be able to fire before candle close if "Allow Repainting" is selected and the alert configuration is set as "once per bar"*
Added default settings notes to indicator tool-tips
* Note: While allowing repainting may allow for some slightly earlier alerts/signals, there will be no way to guarantee that any signal will remain valid, so users must wait for the candle close to confirm the signal is still present.
We have decided to make this indicator freely available to the public in the hopes that people will find it useful as part of a trading strategy. Please feel free to provide constructive suggestions or feedback you may have!

Hodrick-Prescott Channel [Loxx]Hodrick-Prescott Channel is a fast and slow moving average that moves inside a channel. Breakouts are when the fast ma crosses up over the slow ma and breakdowns are the opposite. The white moving average is the fast ma, the slow moving average is the red/green ma.
What is Hodrick–Prescott filter?
The Hodrick–Prescott filter (also known as Hodrick–Prescott decomposition) is a mathematical tool used in macroeconomics, especially in real business cycle theory, to remove the cyclical component of a time series from raw data. It is used to obtain a smoothed-curve representation of a time series, one that is more sensitive to long-term than to short-term fluctuations. The adjustment of the sensitivity of the trend to short-term fluctuations is achieved by modifying a multiplier Lambda.
The filter was popularized in the field of economics in the 1990s by economists Robert J. Hodrick and Nobel Memorial Prize winner Edward C. Prescott, though it was first proposed much earlier by E. T. Whittaker in 1923.
There are some drawbacks to use the HP filter than you can read here: en.wikipedia.org
Included
Bar coloring
Signals
Alerts


BTC Pi MultipleThe Pi Multiple is a function of 350 and 111-day moving average. When both intersect and the 111-day MA crosses above, it has historically coincided with a cycle top with a 3-day margin.
With the Pi Multiple, this intersection is visible when the line crosses zero upwards.
The indicator is called the Pi Multiple because 350/111 is close to Pi. It is based on the Pi Cycle Top Indicator developed by Philip Swift and has been modified for better readability by David Bertho.

Two MA Signal IndicatorThis Signal Indicator that emits a signal based on two MAs crossover/crossunder. It is designed to be used as an External Input for "Template Trailing Strategy" to verify the correctness of the External Deal Condition Mode of the aforementioned script and the Internal Strategy logic. Also, this script is a simple example on how to create custom signal indicators that can be "pugged" to the "Template Trailing Strategy" and get all the features this strategy script can provide!
TWAP + MA crossover Study [Dynamic Signal Lab]Dear TV'ers,
Hereby the study for the TWAP/moving average crossover, with taking profit options.
moving averages include: EMA , WMA , DEMA , TEMA , VAR, WWMA, ZLEMA , TSF , HULL, TILL
It is also possible to gradually take profit, using:
* minimum consecutive green/red candles
* minimum amount of green/red candles in the last 2-8 candles
* both of the above criteria
The slightly transparent green fill shows how much you are in profit from your entry point
The current default properties should be modified to make this strategy cost-effective, but typically 15 minutes and higher timeframes (up to 6hr) seem to work well for larger (top10 cap) crypto projects. Don't use this script for small-caps as it will get you rekt, due to wild volatility.
Additionally, you'll also be able to continuously take profit, making sure you lock in all those sweet profits. For backtesting: use the strategy version of this script

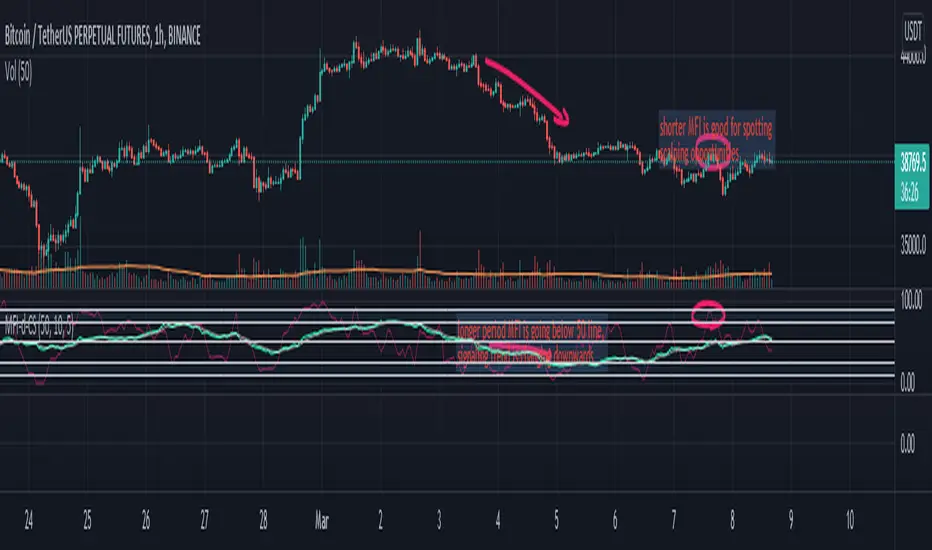
Money Flow Index (double) by CoinStaghey Piners community,
this is an iteration of inbuilt MFI script, with two MFIs of different lengths and one Moving Average which is dependent on MFI 1.
I find it useful to see the trend of longer MFI period, which tells me what direction to trade. On shorter period MFI I'm looking at Oversold or Overbought zones - while quicker MFI index is there, I'm looking to Buy/Sell, depending on trend.
Alternatively, you can use also MFI1 and MA crossovers to spot potential entries.
It seems like a good tool for crypto markets on any timeframes - from 5min, to 4h.
RedK Compound Ratio Moving Average (CoRa_Wave)
Compound Ratio Weighted Average (CoRa_Wave) is a moving average where the weights increase in a "logarithmically linear" way - from the furthest point in the data to the current point - the formula to calculate these weights work in a similar way to how "compound ratio" works - you start with an initial amount, then add a consistent "ratio of the cumulative prior sum" each period until you reach the end amount. The result is, the "step ratio" between the weights is consistent - This is not the case with linear-weights moving average (WMA), or EMA
- for example, if you consider a Weighted Moving Average (WMA) of length 5, the weights will be (from the furthest point towards the most current) 1, 2, 3, 4, 5 -- we can see that the ratio between these weights are inconsistent. in fact, the ratio between the 2 furthest points is 2:1, but the ratio between the most recent points is 5:4 -- the ratio is inconsistent, and in fact, more recent points are not getting the best weights they should/can get to counter-act the lag effect. Using the Compound ratio approach addresses that point.
a key advantage here is that we can significantly reduce the "tail weight" - which is "relatively" large in other MAs and would be main cause for lag - giving more weights to the most recent data points - and in a way that is consistent, reliable and easy to "code"
- the outcome is, a moving average line that suffers very little lag regardless of the length, and that can be relied on to track the price movements and swings closely.
other features:
===============
- An accelerator, or multiplier, has been added to further increase the "aggressiveness" of the moving average line, giving even more weights to the more recent points - the multiplier will have more effect between 1 and 5, then will have a diminishing effect after that - note that a multiplier of 0 (which effectively causes a comp. ratio of 0 to be applied) will produce a Simple Moving Average line :)
- We also added the ability to use an "automatic smoothing" mechanism, that user can over-ride by manually choosing how much smoothing is used. This gives more flexibility to how we can leverage this Moving Average in our charting.
- User can also select the Resolution and Source price for the CoRa_Wave. by default, they will be set to "same as chart" and hlc3
here are the formulas for our Compound Ratio moving average:
Compound Weight ratio r = (A/P)^1/t - 1
Weight at time t A = P(1 + r)^t
= Start_val * (1 + r) ^ index
index in the above formula is 0 for the furthest point out
Here's how CoRa_Wave compares to other common moving averages all set to the same length (20)
Proposed Usage
- CoRa_Wave can be used for any scenarios where we need a moving average that closely tracks the price, trend, swings with high responsiveness and little lag
- MA Cross-over scenarios - against another CoRa_Wave or any other MA
- below is a quick example scenario for how to utilize 2 CoRa_Wave lines of same length (one for open and one for closing price) to track swings and trends
- get as creative as you need :)
Code is commented - please feel free to leverage or customize further as you need.
👉 if you are interested in other moving averages i posted before, please check out the FiMA and the v_Wave ...

+ True RSIThis is a better, cleaner version (in my opinion) of an part of an indicator I was using that was coded up by cI8DH. I reached out to him about cleaning up the code (things weren't working) for Pinescript v4, but he no longer seems to be active, so I thought I might take it upon myself to at least work out this portion of the indicator.
Much credit goes to him. Below is the indicator that he coded, of which only one part have I made additions to.
So, he calls this the True RSI. I was using it as part of the USI, which I posted above (it's the MA Percent indicator type). To my eyes it's not far different from the standard RSI, so I probably could have just made a version of that, but I like this one, and I was excited to add a few things (like candle coloring, which no longer works with his version!).
So, what's different?
I added two different background fills.
I made the lines types for the extremities and midline more appropriate for the indicator.
I added bullish, bearish, overbought, and oversold candle coloring.
I added a multitude of moving averages as well.
If this looks like my '+ %B' indicator, that is because I basically just moved the MA's and candle coloring code over. One could probably do this with many different indicators.
In the future I will probably add alerts, and maybe MA cross candles as well. Or not. Well, almost certainly alerts. Please enjoy!
QuantBot 3:Ultimate MA CrossoverThis is the 3rd indicator of quantbot indicator series.
This the names as ultimate moving average crossover as it considers 9 types of moving averages while generating signals.
The finctionality is pretty basic.
It comes with automated signal processing from tradingview to Indian brokers account via webhook, using our automation setup.
To get the access please text me in the chatbox, ACCESS is given for FREE.
This is purely for charting purpose, if you find it useful please let me know in the comment box below.
If you want me to code any particular strategy please mention this in the comment box.

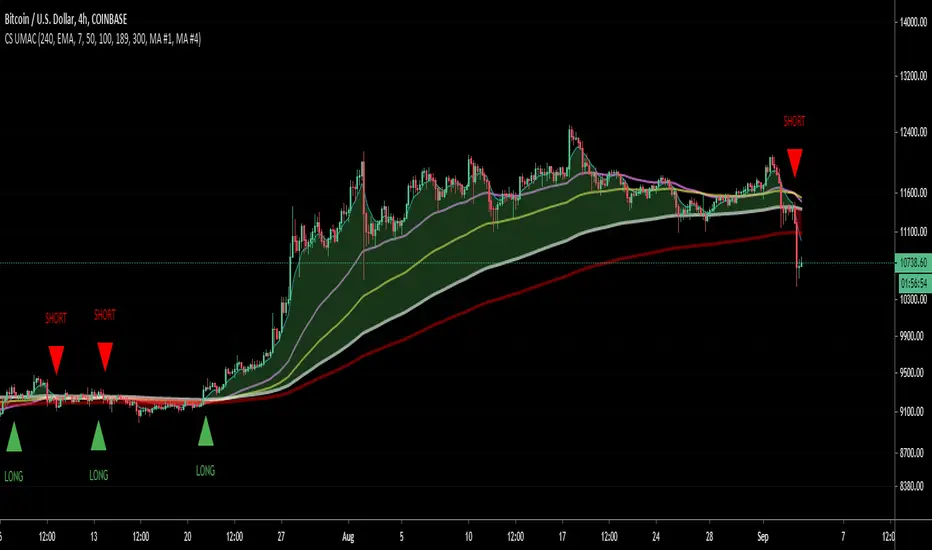
CS Ultimate MA CrossThis indicator adds 5 Moving Averages on your chart. You can select the MA Type: SMA, EMA, RMA or VWMA.
By selecting a Fast MA and a Slow MA you can also draw a cloud to make the Bull or Bear bias more visual. Possibility to add on the chart Long/Short signal.
MTF possible by changing the range which is particularly useful for HTF analysis while looking a LTF price action.
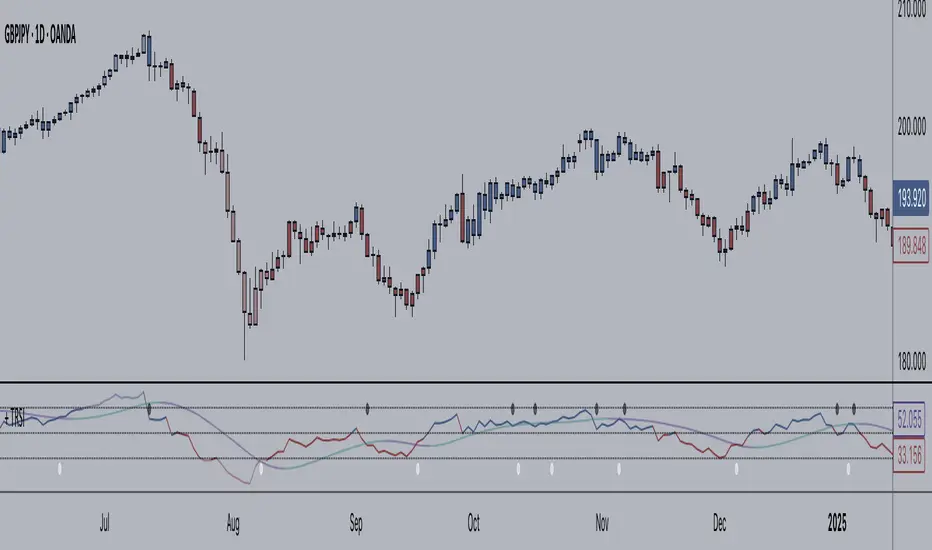
Gastitan MA-cross/RSI/PSARThis script gives
moving average cross alert
RSI alert when change from bull to bear, and viceverse
Parabolic sar indicator
Also you have a panel with the current price and RSI values.

Alpha BandsAlpha Bands, this is a new idea I've been playing with recently in all my indicators.
In layman terms we are here using mult to multiply length of the plot to replicate effect of multi time frame plot. Under the hood it is basically fast ma crossing over slow one but with this simple multiplier introduction is able to give it properties of higher TF ma's but without the usual problem of the TV where multitimeframe MA plots rather crudely if you use security function.
Introducing it as core trend indicator, and around it I've utilized ATR to create simple but complete indicator to give good view of the market state and trend. Due to this setup it can be used for both trending and mean reversion trades, you can also utilize existing ranges for entry, exit and SL.
This indicator is example of how simple little tweaks can turn a age old tools into more advanced solutions.
This is purely for educational purposes, any past or claimed results may not replicate themselves while you trade them so use your own discretion. Author takes no responsibility of individual traders success or loss on this.
Source code will be protected since there is trend on TV where ideas are stolen and sold to unsuspecting retailers.

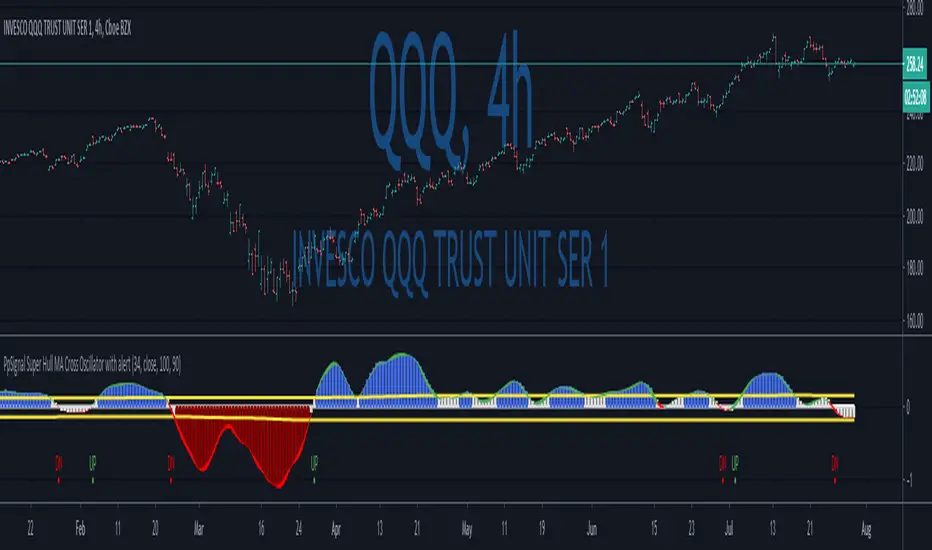
PpSignal Super Hull MA Cross Oscillator with alertWe have a Super Hull Move average oscillator style.
Super Hull, it is a hull move average open-close, smooth with elder method.
So, when you have a green color (hull cross up 0 Line), you have a buy signal.
When you have q red color (hull cross down 0 Line) sell signal.
Enjoy it...