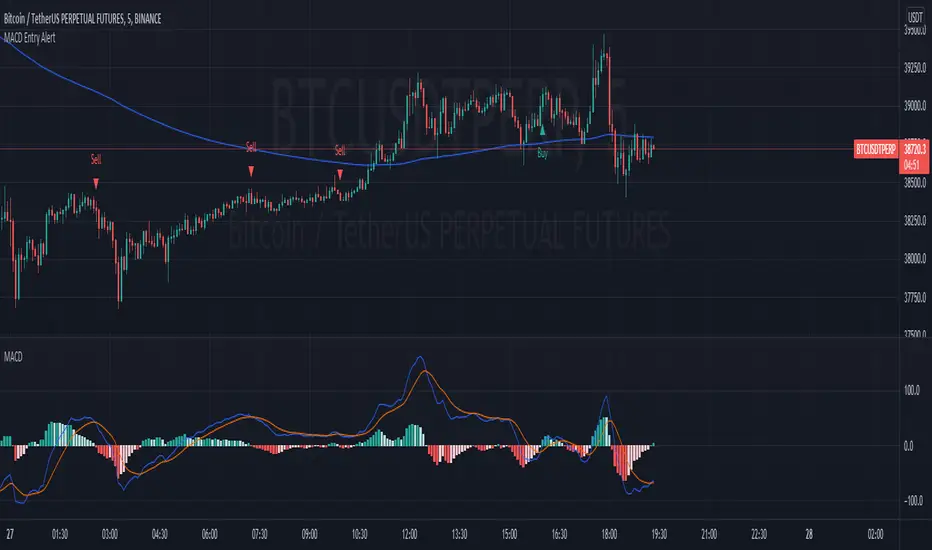
MACD 50x Leveraged Short Strategy with Real Equity
Hello there ,
Short version of the Macd Long strategy.
MACD Long strategy:
Adding margin: Forbidden or not specified. (Add Margin : No)
Position size: (for each trade) 1%
Stop-Loss: (2% Above Entry Level)
Long: macd crossunder
Exit: macd crossover
Or ofc touching the stop-Loss value as predicted.
These strategies are just examples.
The goal is to observe true equity and equity change.
Warning: This strategy simulation is for Short direction only.
Regards.
在腳本中搜尋"macd"

MACD Trend Following Strategy How it work ?
Work like normal MACD because this is MACD without any modify but i add color of candlestick and strategy.
The color meaning :
Green= macd > signal and macd>0 (Buy)
Red= macd < signal and macd<0 (Sell)
Yellow= macd > signal and macd<0 (Maybe reversal point)
Blue= macd < signal and macd>0 (Maybe reversal point)
Feature
- Back test range
- Long/Short option
- Modifiable MACD Setting

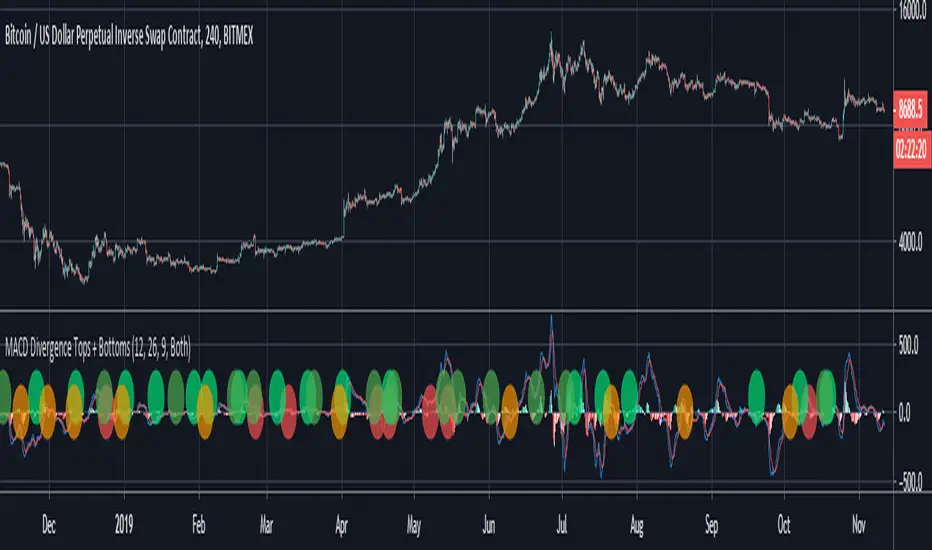
MACD Divergence Tops + BottomsMACD Indicator which plots local peaks and troughs in divergence.
"Classic" Divergence is specified as:
- A higher price, with reduced MACD high --> Potential Sell Point
- A lower price, with higher MACD low --> Potential Buy Point
"Alternative" Divergence is specified as:
- A higher MACD high, with reduced price --> Potential Sell Point
- A lower MACD low, with higher price --> Potential Buy Point
MACD Divergence should be used in combination with other indicators. This indicator identifies local tops and bottoms, with potential for macro trend shifts.
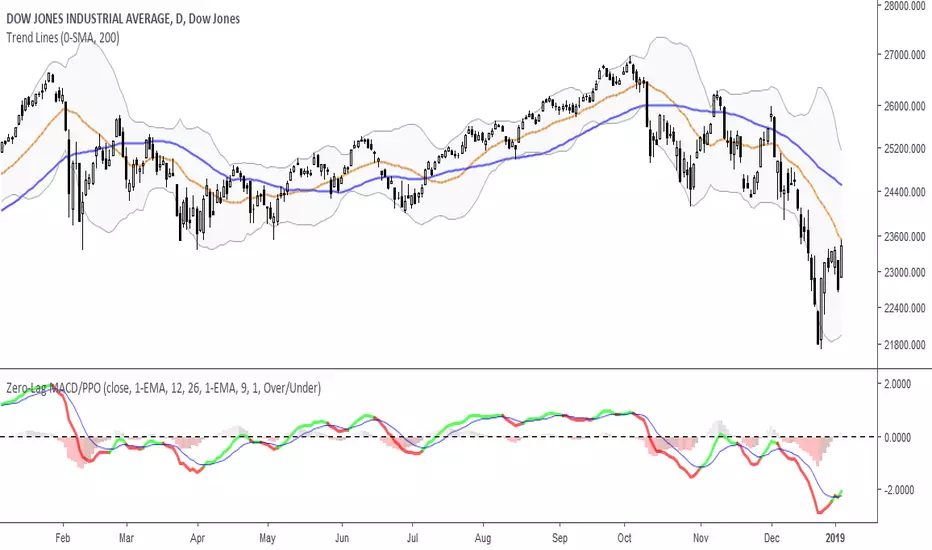
Zero-Lag MACD/PPOMACD/PPO Indicator, with optional faster EMA's to reduce lag.
-Use "MA TYPE" to select SMA, EMA, Double-EMA, Triple-EMA, or Hull as the MACD Source. Default is 'EMA'.
-Use "FAST MA" and "SLOW MA" to set the fast and slow period lengths.
-Use "SIGNAL TYPE" to select SMA, EMA, Double-EMA, Triple-EMA, or Hull as the Signal formula. Default is 'EMA'.
-Use "SIGNAL LENGTH" to set the Signal period length.
-Use "HIST. SIZE" to change the scaling of the histogram and make it stand out more.
-Use "COLOR SIGNALS" to select when to signal green/red on the MACD line.
--- "None" is always black.
--- "Over/Under" will signal based on MACD being over or under the Signal line.
--- "Rising/Falling" will signal based on MACD being over/under the Signal line and both are rising/falling.
-Use "PPO INSTEAD" to use Price Percent Oscillator scaling (works better for long-term and large price fluctuation).
MACD with Directional ColorsThis MACD indicator colors the MACD and signal lines according to the direction they are moving.
- Eliminates the histogram from the traditional MACD indicator.
- Uses a histogram for the MACD line.
- Includes Bollinger Bands for the MACD line to help detect squeezes

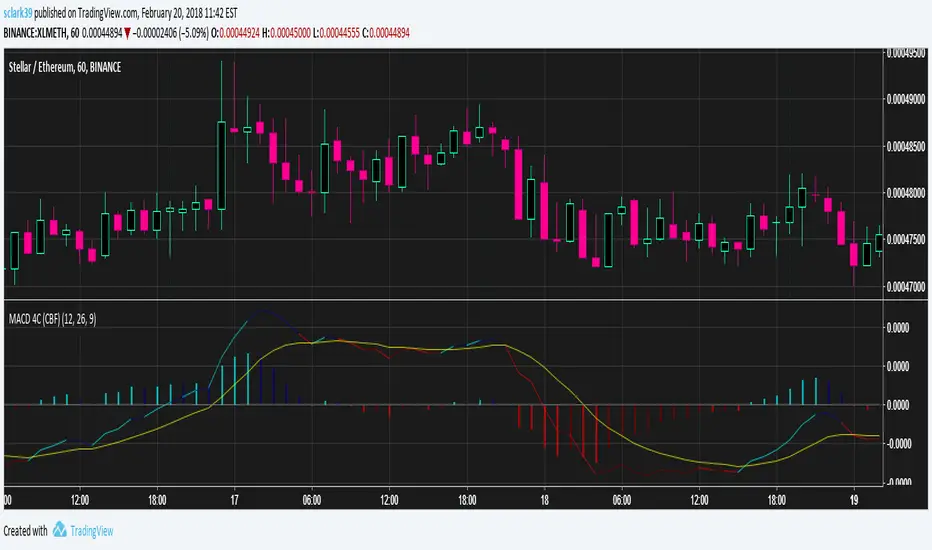
MACD (4 Color, Color-Blind Friendly)Working MACD Histogram which colors bars based on the slope from the previous. The default colors will work for both Deuteranopia and Protonopia color-blind people but can be modified.
There is a bug with 'MACD 4C' by vkno422 + signal line - squattter and 'MACD for colour blind people' by cfhrtd in that it draws the MACD line itself as a histogram, rather than drawing an MACD histogram (which is the MACD line - signal line).
Bad indicators that this should replace:
MACD + SMA 200 Strategy (by ChartArt)Here is a combination of the classic MACD (moving average convergence divergence indicator) with the classic slow moving average SMA with period 200 together as a strategy.
This strategy goes long if the MACD histogram and the MACD momentum are both above zero and the fast MACD moving average is above the slow MACD moving average. As additional long filter the recent price has to be above the SMA 200. If the inverse logic is true, the strategy goes short. For the worst case there is a max intraday equity loss of 50% filter.
Save another $999 bucks with my free strategy.
This strategy works in the backtest on the daily chart of Bitcoin, as well as on the S&P 500 and the Dow Jones Industrial Average daily charts. Current performance as of November 30, 2015 on the SPX500 CFD daily is percent profitable: 68% since the year 1970 with a profit factor of 6.4. Current performance as of November 30, 2015 on the DOWI index daily is percent profitable: 51% since the year 1915 with a profit factor of 10.8.
All trading involves high risk; past performance is not necessarily indicative of future results. Hypothetical or simulated performance results have certain inherent limitations. Unlike an actual performance record, simulated results do not represent actual trading. Also, since the trades have not actually been executed, the results may have under- or over-compensated for the impact, if any, of certain market factors, such as lack of liquidity. Simulated trading programs in general are also subject to the fact that they are designed with the benefit of hindsight. No representation is being made that any account will or is likely to achieve profits or losses similar to those shown.

MACD Color Trawler (by ChartArt)This version of the MACD indicator is 'trawling' (checking) if the MACD histogram and the zero line crossing with the MACD line are both positive or negative. The idea behind this is to show areas with higher or lower risk.
Features:
1. Enable the bar color
2. Enable the background color
3. Change zero line value
FYI:
"The MACD-Histogram is an indicator of an indicator. In fact, MACD is also an indicator of an indicator. This means that the MACD-Histogram is the fourth derivative of price."
First derivative: 12-day EMA and 26-day EMA
Second derivative: MACD (12-day EMA less the 26-day EMA)
Third derivative: MACD signal line (9-day EMA of MACD)
Fourth derivative: MACD-Histogram (MACD less MACD signal line)
Source: stockcharts.com

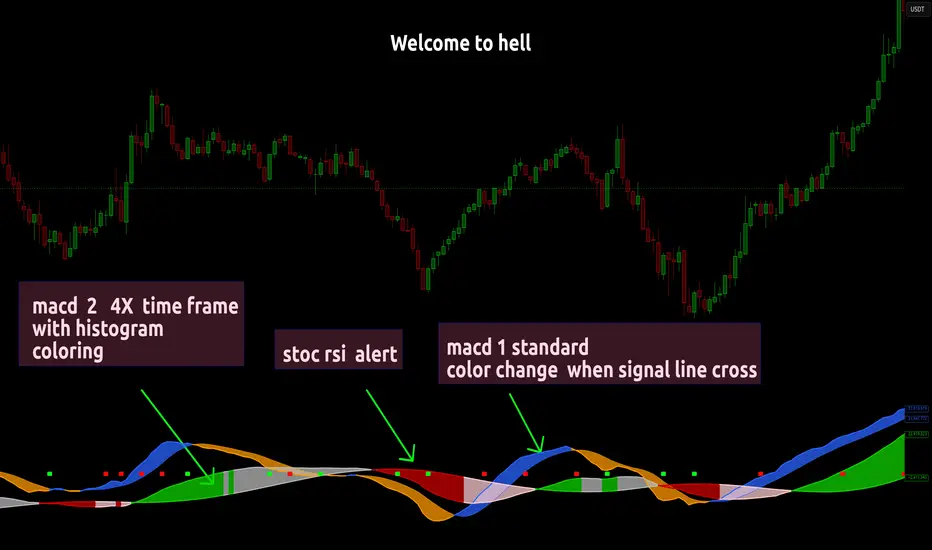
Dual MACD With Pilot Background + + Stoch RSI Alert HELL 2macd 1 chart time macd 2 4x chart time with over bought and over sold stoc rsi alerts
MACD FROM HELLthis is a double macd with 2 time frames macd 1 is chart macd 4 is 4X meaning the 1hr becomes the 4hr and it uses the histogram coloring for added detail ,, on top of that it has stochastic rsi Alerts set to trigger when k line goes above 99.9 or below 0.01 and exits ,, alert triggers on exit
MACD - Ostinato TradingMACD oscillator from Ostinato Trading, the classic momentum indicator. With this particular code you can superpose two different MACD and add a background to display cross of second indicator if you don't want to display it completely.

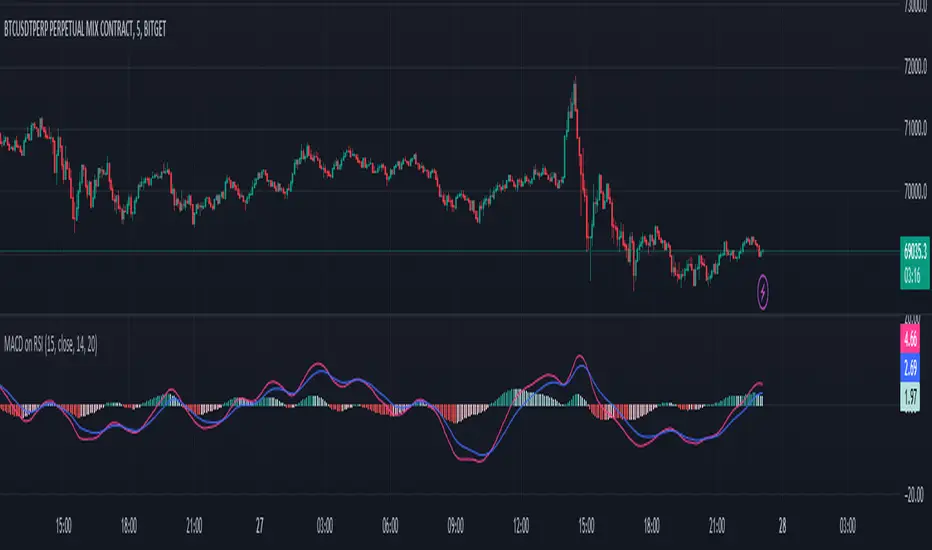
MACD on RSIThe MACD on RSI indicator combines elements of the Moving Average Convergence Divergence (MACD) and the Relative Strength Index (RSI). It calculates the RSI on a specified source with a customizable length, then applies two exponential moving averages (EMAs) to the RSI values. The difference between these EMAs forms the MACD line, visually representing the momentum of the RSI.
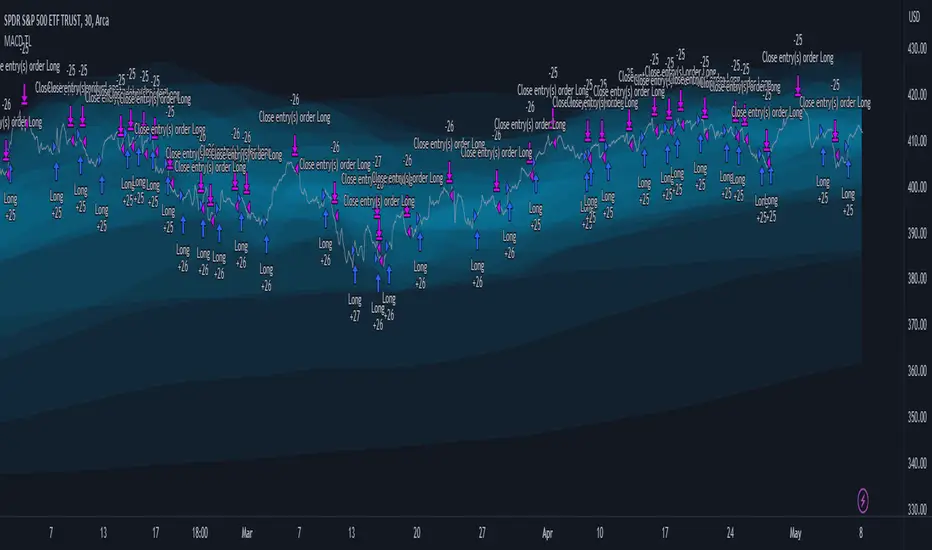
MACD TrueLevel StrategyThis strategy uses the MACD indicator to determine buy and sell signals. In addition, the strategy employs the use of "TrueLevel Bands," which are essentially envelope bands that are calculated based on the linear regression and standard deviation of the price data over various lengths.
The TrueLevel Bands are calculated for 14 different lengths and are plotted on the chart as lines. The bands are filled with a specified color to make them more visible. The highest upper band and lowest lower band values are stored in variables for easy access.
The user can input the lengths for the TrueLevel Bands and adjust the multiplier for the standard deviation. They can also select the bands they want to use for entry and exit, and enable long and short positions.
The entry conditions for a long position are either a crossover of the MACD line over the signal line or a crossover of the price over the selected entry lower band. The entry conditions for a short position are either a crossunder of the MACD line under the signal line or a crossunder of the price under the selected exit upper band.
The exit conditions for both long and short positions are not specified in the code and are left to the user to define.
Overall, the strategy aims to capture trends by entering long or short positions based on the MACD and TrueLevel Bands, and exiting those positions when the trend reverses.
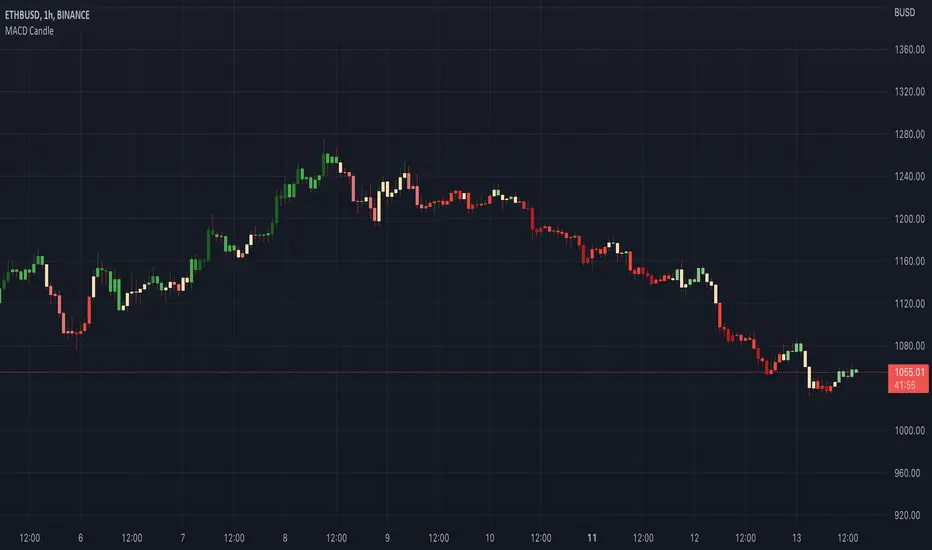
MACD CandleInstead of viewing MACD from a separate chart (histogram), this indicator will plot a candle based on the MACD value. It is easy to summarize trends and make your technical analysis charting less complex.
MACD Indicator for 5 Min ScalpThis Indicator merges the 1 min MACD with BollingerBands to dedect a bigger than avarage tick on the Macd for the 5 min Scalping Strategy
You can change the length of the bollinger bands for the upper and lower channel individually so that you can get better signals
if a tick is bigger than avarage it will be colored, else it would be gray
this is the same indicator i used to get entrys in my 5 min scalping statagy, but i wouldnt just go in a trade when there is a bigger than usual tick. You have to look at other things to

MACD Scalper AnalysisThis is a scalper analysis movement designed around MACD and 200 EMA
The rules are simple:
For long we check if the close of the candle is above the ema200 and we have a crossover between macd and signal
Once this happens we analyse the next candle, if its close higher than open , we can consider it a win and if its close lower than open we consider a lose.
For short we check if the close of the candle is below the ema200 and we have a crossunder between macd and signal
Once this happens we analyse the next candle, if its close higher than open , we can consider it a loss and if its close lower than open we consider a win.
Once we have all of this we analyse the average percentage movement and establish if the specific asset or timeframe is worthy for us.
At the same time it can give a good idea if we can go with a divergence strategy, like for example we have a short entry, but we will actually go long and viceversa.
If you have any questions let me know !

MACD Strategy AlertThis Indicator will only give you potential entry base on MACD strategy combine with a 200 EMA
-Sell when price under 200 ema and MACD is crossing the signal line above 0
-Buy when price above 200 ema and MACD is crossing the signal line under 0
-Sending Alert for each Potential Entry
MACD + Divergence + Line █ OVERVIEW
Here's the classic MACD with some simples features in plus.
█ CONCEPTS
4 features
1 — Classic MACD histogram, with 4 different colors such as above or below 0, and above or below the previous bar
2 — Display option to disable EMA
3 — A signal line that show the exact point, because the histogram view might be hard to be precise
4 — Looking for previous Divergences, Bullish, Bearish and Hidden Bullish and Bearish but I don't like Hidden divergences
█ OTHER SECTIONS
An oscillator is good to know where we are in the trends, but it's not enough to run a small business of trading, you need to learn how to use it.
What is a divergence ?
Thanks to The rational investor for teaching me how to use this indicator.
MACD + BB + RSI Strategy [Alorse]A very simple and highly effective strategy that combines 3 famous indicators:
MACD
Bollinger Bands
RSI
Entry conditions are:
The MACD line crosses over the signal line.
RSI less than 50
Price below the BB baseline
Exit conditions are:
RSI greater than 70
Closing price higher than the upper BB
Or when the price hits the Stop Loss defined by you (Feature).

MACD Linear Regression by zdmreBoth the Moving Average Convergence Divergence (MACD) and the Linear Regression (LR) rank among the most popular momentum indicators used in trading. When used in combination with other technical indicators, both MACD and LR can offer value in validating trade opportunities to optimize your risk management practices.
While they represent a similar approach to evaluating trades, the functions of both MACD and LR are distinct, which makes them useful indicators to combine in trade evaluation. Here’s a look at how to use MACD and LR as part of your trade analysis.
***Use it at your own risk
If you have new ideas to improve this indicator then let me know please.
Keep Learning, Keep Earning
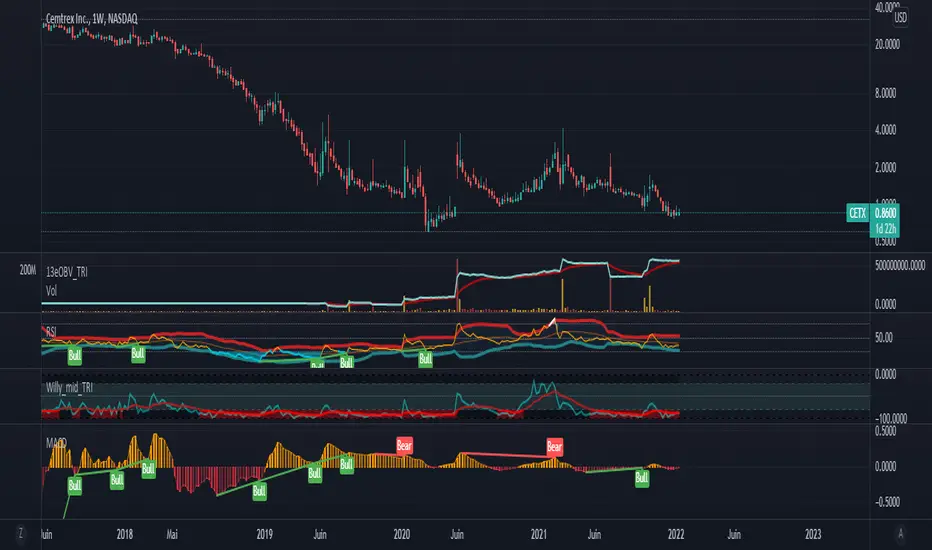
MACD, EMA, Know sure thing, Chopy Market - high adaptabilityHey there :)
This is the free version of the script. The following indicators / settings are missing:
- Support and resistance zones
- dynamic textboxes for alarms when using bots (3 Commas, Alertatron, etc.)
- a table showing the current position, indicators and other important information
With this script there is the possibility to completely customize the MACD . Starting with the MACD and signal line, the histogram and the color of the histogram.
Since the Pinecoders team has previously deleted the script, I will mention the fee settings in a bit more detail:
In this script a fee of 0.01% and a slipage of 15 was used. With each trade the total capital (100%) is used with a risk reward of 1 to 1.5.
The total capital, i.e. the risk, can be changed at any time under the "Settings" tab at "Equity".
I also added an EMA , the Know sure thing indicator and the Chopy Market indicator (by TradingRush) to the script to filter out bad trades.
The EMA:
Since the EMA is very reliable and shows whether there is an upward or downward trend, it should be used with the indicators in any case. It prevents long trades in downward movements and vice versa.
The KST Indicator:
The KST indicator has a similar movement as the MACD, but is by and large a bit more time delayed. It filters out false swings of the MACD and thus prevents bad trades.
The Chopy Market Indicator by Tradingrush:
The Chopy Market indicator, which was introduced by TradingRush in one of its videos, has the ability to detect sideways markets and block zones below this line for trades by means of a fixed value (the line).
To exit the trades, I added the following options:
ATR Exits. Exits based on past candles (lowest low, highest high).
Static exits based on set percentages.
In the next days I will create a tutorial for the script, just have a look on my profile.
If you have any questions about the script, let me know.
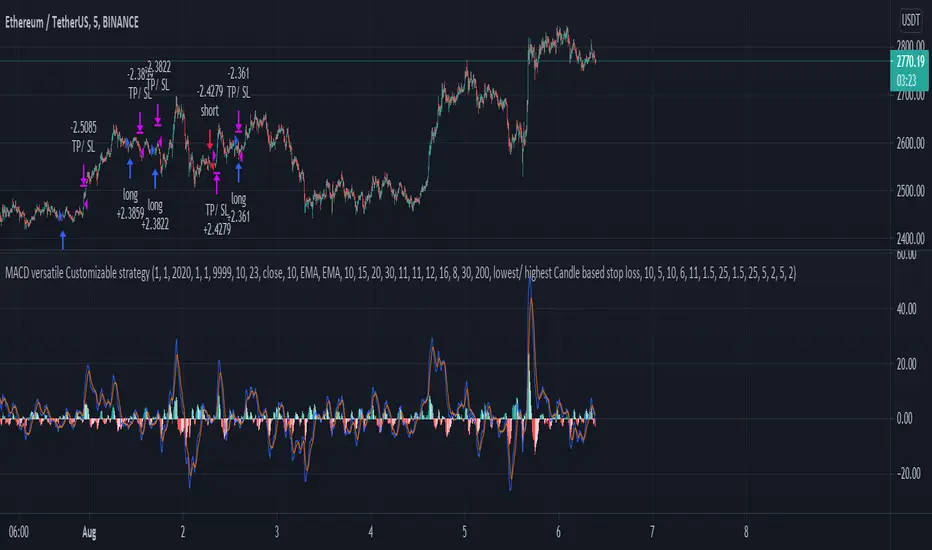
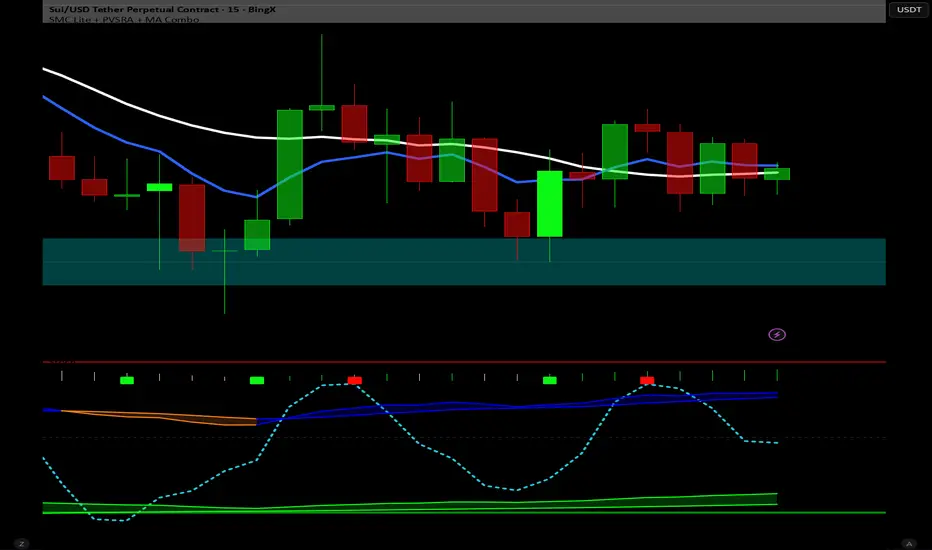
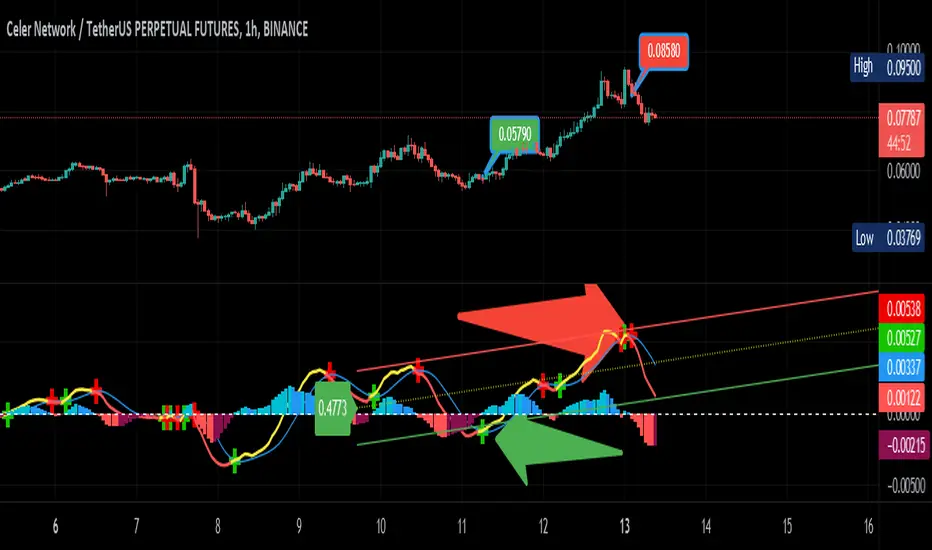
MACD EMA - TradingRush StrategyHey there!
Today I present you a rather simple, but very profitable MACD strategy. Since I trade it with cryptocurrencies, the settings have been adjusted.
I discovered the strategy on a YouTube channel and tried to transfer it as a strategy into a script.
Tested with the crypto pair ETH/USDT in the 15 minute chart.
There is the possibility to switch between short and long positions.
-----------------------------------------------------------------------------------
How does the strategy work?
ENTRY
The MACD indicator must cross below the histogram. If it crosses when the price is below the EMA, only short positions are traded. Above the EMA - long.
EXIT
The Lowest Low (long) / highest high (short) serves as the stop loss. The TP is formed on the basis of a factor. (SL multiplied by factor 2.1 = TP).
The red lines are used to illustrate the SL. Above for short positions below for long positions.
The results of the strategy are without commissions and levers.
If you have any questions or feedback, please let me know in the comments.
If you need more information about the strategy and want to know exactly how to apply it, check out my profile.
I wish you good luck with the strategy!

MACD oscillator with EMA alert version 4HThis is the study/indicator alert version of the macd + ema strategy.
The strategy details are the following :
Is a simple, yet efficient strategy, which is made from a combination of an oscillator and a moving average.
Its setup for 4h candles with the current settings, however it can be adapted to other different timeframes.
It works nicely ,beating the buy and hold for both BTC and ETH over the last 3 years.
As well with some optimizations and modifications it can be adapted to futures market, indexes(NASDAQ, NIFTY etc), forex( GBPUSD ), stocks and so on.
Components:
MACD
EMA
Time condition
Long/short option
For long/exit short we enter when we are above the ema , histogram is positive and current candle is higher than previous.
For short /exit long , when close below ema , histo negative and current candles smaller than previous
If you have any questions please let me know !
