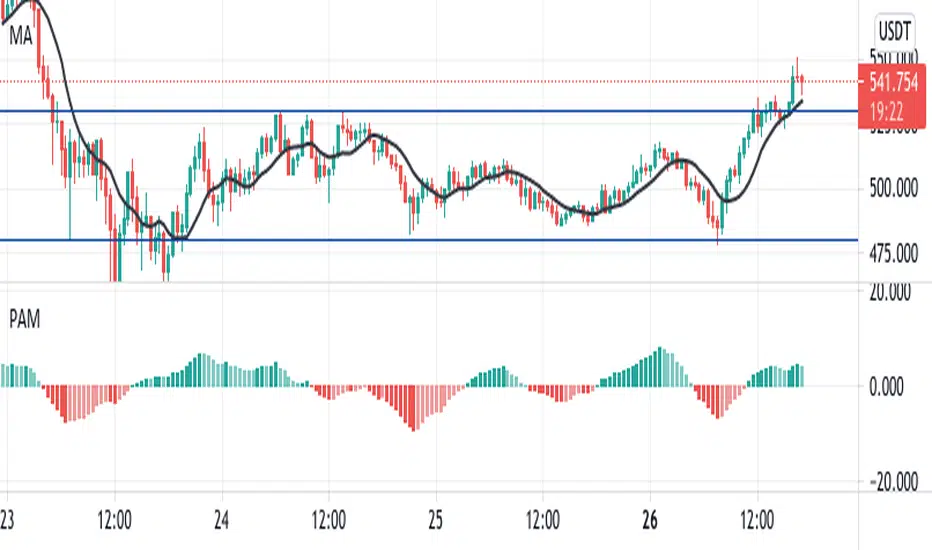
Price Acceleration Momentum [PAM]this indicator plots the acceleration of the price using the derivatives of RSI.
you can use it just like a momentum oscillator to catch divergences, trend direction, breakout direction, etc
在腳本中搜尋"momentum"
IT Volume Momentum OscillatorAuthor/Creator: Carl Swenlin
Data components required: Up Volume (UV), Down Volume ( DV ), Total
Volume (V).
Description: The Intermediate Term Volume Momentum Oscillator is a
barometer of breadth. To calculate the ITVM add the daily McClellan Oscillator
- Volume (ratio adjusted using the difference of up and down volume divided by
the total volume ) to the daily 39-day exponential average, then calculate a 20-
day exponential average of the result.

IT Breadth Momentum OscillatorCreator: Carl Swenlin
Data components required: Advances (A), Declines (D).
Description: The Intermediate Term Breadth Momentum Oscillator is a barometer of breadth. To calculate the ITBM, add the daily McClellan Oscillator
(ratio adjusted) to the daily 39-day exponential average, then calculate a 20-day exponential average of the result

Structure AnalyzerA momentum indicator that uses the highest and lowest values for price in three different lookback lengths to find the performance relative to three timeframes.
- The yellow line is the product of the price performance in three different timeframes.
- The red line is 200 EMA of the performance.
- The blue columns represent the same calculation or the volume(OBV based).
- The aqua line is the 200 EMA of the volume performance.
How to use: Whenever the performance crosses above the 200 EMA, the price is in an uptrend.
Important: When in a downtrend, the performance will stay below the 200 EMA for a long time; hence it is important o wait until the crossover.

Electrified Momentum OverlayVisualizes a moving average and changes in momentum in one overlay.
8 phase alert options.

Combined Momentum MA (Equal-Length EMA/SMA Crossover)Overview:
This momentum and trend-following strategy captures the majority of any trending move, and works well on high timeframes.
It uses an equal-period EMA and SMA crossover to detect trend acceleration/deceleration, since an EMA places a greater weight and significance on the most recent data.
To reduce noise and optimize entries, we combined this with an overall trend bias for further confluence.
How it works:
Signals are determined by the crossover of an EMA and SMA of the same length, e.g. EMA-50 and SMA-50.
The overall trend bias is determined using a slower SMA golden/death cross, e.g. SMA-50 and SMA-100.
The signal is stronger when it occurs in confluence with the overall trend bias, e.g. when EMA-50 crosses over SMA-50, while above the SMA-100. This is analogous to only opening long positions in a bull market.
Indicator description:
GREEN: Up Trend (EMA is above SMA, while EMA is above BIAS_MA. This shows a bullish confluence.)
YELLOW: No Trend (EMA/SMA crossover and BIAS_MA are not in confluence.)
RED = Down Trend (EMA is below SMA, while EMA is below BIAS_MA. This shows a bearish confluence.)

Equal-Length EMA/SMA Crossover Momentum StrategyOverview:
This momentum and trend-following strategy captures the majority of any trending move, and works well on high timeframes.
It uses an equal-period EMA and SMA crossover to detect trend acceleration/deceleration, since an EMA places a greater weight and significance on the most recent data.
This version is optimized for longs, and designed to cut your losses quickly and let your winners run.
To reduce noise and optimize entries, we combined this with an overall trend bias for further confluence.
How it works:
Signals are determined by the crossover of an EMA and SMA of the same length, e.g. EMA-50 and SMA-50.
The overall trend bias is determined using a slower SMA golden/death cross, e.g. SMA-50 and SMA-100.
The signal is stronger when it occurs in confluence with the overall trend bias, e.g. when EMA-50 crosses over SMA-50, while above the SMA-100. This is analogous to only opening long positions in a bull market.
Signal description:
Trend Buy: EMA crosses above SMA, and overall trend bias is bullish. Buying is in confluence with the overall trend bias.
Risky Buy: EMA crosses above SMA, and overall trend bias is bearish. Buying is early, more risky, and not in confluence with the overall trend bias.
Late Buy: SMA crosses above BIAS_SLOW. This gives further confirmation of bullish trend, but signal comes later.
Sell: EMA crosses under SMA.
Strategy entry and exit conditions:
This version enters a Long when "TREND BUY" is signalled.
This version has Sell/Shorts disabled because UP ONLY.
Long entry: Strategy enters Long when EMA is above SMA, while overall trend bias is bullish.
Long exit: Close long when EMA crosses under SMA.

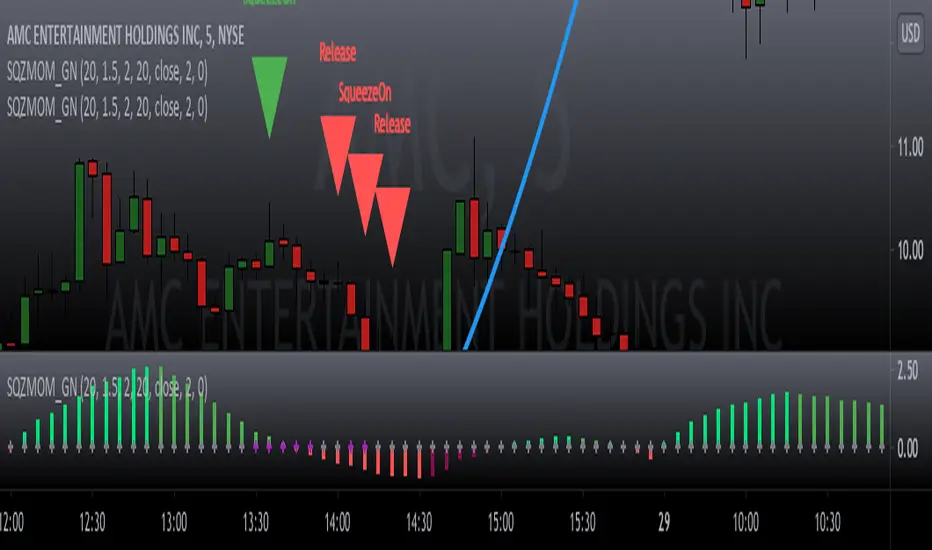
Squeeze Momentum Indicator v4_pine [By Lazy Bear]This is the famous Squeeze Momentum Indicator made by @LazyBear in v4 version if someone wants to test some strategies, as the original code was in v2 version the code converter couldn't convert to v4.

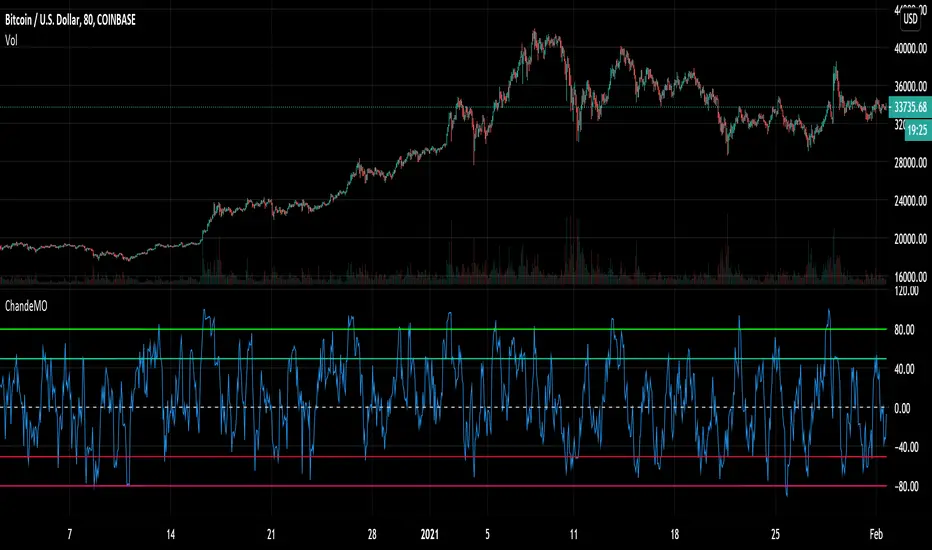
Chande Momentum Oscillator - Alerts and RegionsIt seemed weird to me that the default Chande didn't have overbought and oversold regions, despite them being described for Chande Momentum and working very well. So I added the lines and alert conditions. I've used this to very good results in my day trading.
My strategy involved 4 timeframes of candlestick, each with 4 timeframes of Chande overlaid. Candlesticks are 5 min, 20 min, 80 min, 320 min and Chandes are x1, x2, x4 and x8 of the relevant time zone. Give it a shot. Use the 5 min Chande as Buy and Sell signal with the other timeframes for trend confirmation. You may get a lot of extra alerts with this setup, but it's almost impossible to really miss an opportunity if you use it right. It will take up all your free time though, as a warning. Using this strat made me go crazy.
Use the chande crossing over the lines as the signal, not just being in the region, as that will make you buy early.
Squeeze Momentum Signal Overlay [GN]Companion script for Squeeze Momentum Indicator that plots the signal on chart.
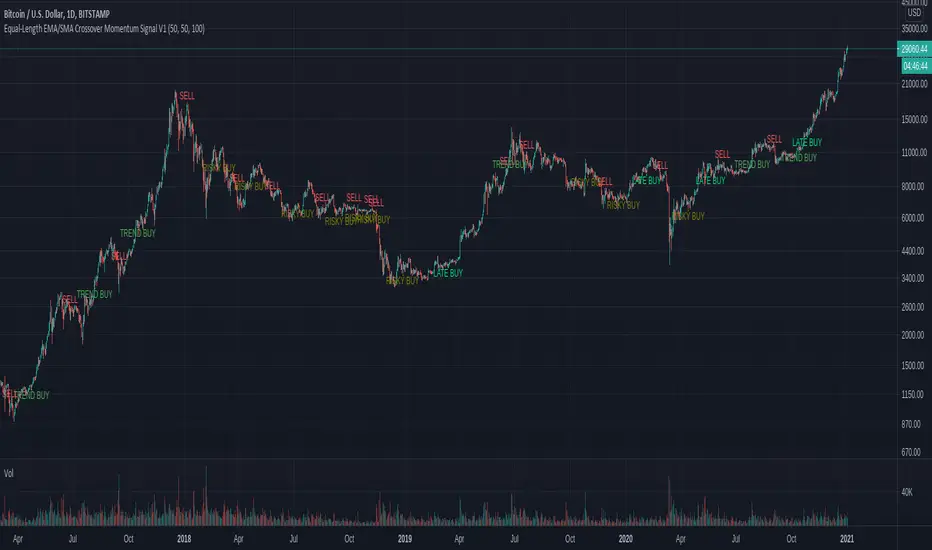
Equal-Length EMA/SMA Crossover Momentum Signal V1Overview:
This momentum and trend-following strategy captures the majority of any trending move, and works well on high timeframes.
It uses an equal-period EMA and SMA crossover to detect trend acceleration/deceleration, since an EMA places a greater weight and significance on the most recent data.
This version is optimized for longs, and designed to cut your losses quickly and let your winners run.
To reduce noise and optimize entries, we combined this with an overall trend bias for further confluence.
How it works:
Signals are determined by the crossover of an EMA and SMA of the same length, e.g. EMA-50 and SMA-50.
The overall trend bias is determined using a slower SMA golden/death cross, e.g. SMA-50 and SMA-100.
The signal is stronger when it occurs in confluence with the overall trend bias, e.g. when EMA-50 crosses over SMA-50, while above the SMA-100. This is analogous to only opening long positions in a bull market.
Signal description:
Trend Buy: EMA crosses above SMA, and overall trend bias is bullish. Buying is in confluence with the overall trend bias.
Risky Buy: EMA crosses above SMA, and overall trend bias is bearish. Buying is early, more risky, and not in confluence with the overall trend bias.
Late Buy: SMA crosses above BIAS_SLOW. This gives further confirmation of bullish trend, but signal comes later.
Sell: EMA crosses under SMA.
Squeeze Momentum StrategyJust turned LazyBears' Squeeze Momentum Indicator into a strategy. You can understand how it works and pay credit to LazyBear here: uk (dot) tradingview (dot) com/v/nqQ1DT5a/
Best results seem to be on the 4h chart. Added LazyBear's Volume Weighted Moving Average indicator, which can be used (select in strategy properties) to more selectively long or short if desired. Defaults to using 100% of your initial strategy equity (just my preference), and this cannot be changed without recoding the strategy, but should be easy to do if desired. Added leverage, trade risk, backdate time window and trade type selector inputs.
Happy trading!
Not financial advice.

NIMBLR F2F Momentum & Indecisive Candle FinderIndicator based on strategy shared by Nimblr in Elearnmarket Face to face interview
Red Circle means "Indecision" (I)
Green Plus means "Momentum" (M)

Bjorgum RSIRSI output signals are displayed with color change to reflect the plotted value. This makes evaluating RSI conditions require but a glance.
RSI momentum buy signals are given on the cross of the 50 level, whereas sell signals are given on a fall below.
Default values a 5 period RSI which gives more timely entrances and exits for swing traders. This can be adjusted to the typical 14 period if the viewer desires slower signals.
Bullish and bearish area is shaded to accentuate the signal to the eye.
Excellent results can be found when coupling BJ RSI, with BJ TSI, and the reversal system using all 3 as a complete together simultaneously
Default color changes are plotted as a recorded value falls within the following levels:
RSI < 30 = green
RSI 30-50 = red
RSI 50-70 = blue
RSI 70-80 = yellow
RSI 80-90 = orange
RSI 90-100 = white hot

Bjorgum TSI Arrows
This script is intended to help the viewer identify potential turning points with momentum "headwinds" or "tailwinds" with a visual que at the bar level. The presence of arrows indicates that the TSI indicator is either "curling" up under the signal line, or "curling" down over the signal line. This can help to anticipate reversals, or moves in favor of trend direction.
Multiple script overlays can be used for "Multi-timeframe analysis" by altering the "resolution" feature.
eg: Viewer could enable 2 "Arrow" scripts while watching the daily timeframe, and setting one of them to indicate weekly conditions. This can help identify prevailing trend strength when using smaller timeframes.

CyclesThis is a modified Stochastic indicator. Modifications include:
1. The output is now centered on "0" and the scale is from -50 to +50, so that histograms and columns can be used to plot the output.
2. Added visual trade setup triggers. A trigger to the up side is a cycle high and indicates a "sell signal". A trigger to the down side is a cycle low and indicates a "buy" signal.
3. Added an alert trigger to be used to setup alerts. Selecting "Alert" to be Greater Than (>) Value = 0.00 will trigger an alert if either the buy or sell triggers occur.
4. Added a force indicator output. This indicates the rate of change in "D", or mathematically "dD/dt", as was done in the Power Analyzer indicator. When Force and D are in-phase, the maximum power is achieved.
5. Added "Slow Average Momentum" and "Slow Average Force" as was done in the Power Analyzer indicator.
6. Added an internal MACD and EMA as part of the trade setup trigger equation. There is a new input variable for the EMA length.
7. Added an input variable for the "Trigger Threshold", which ranges from -50 to 50, to be used as a screening filter.

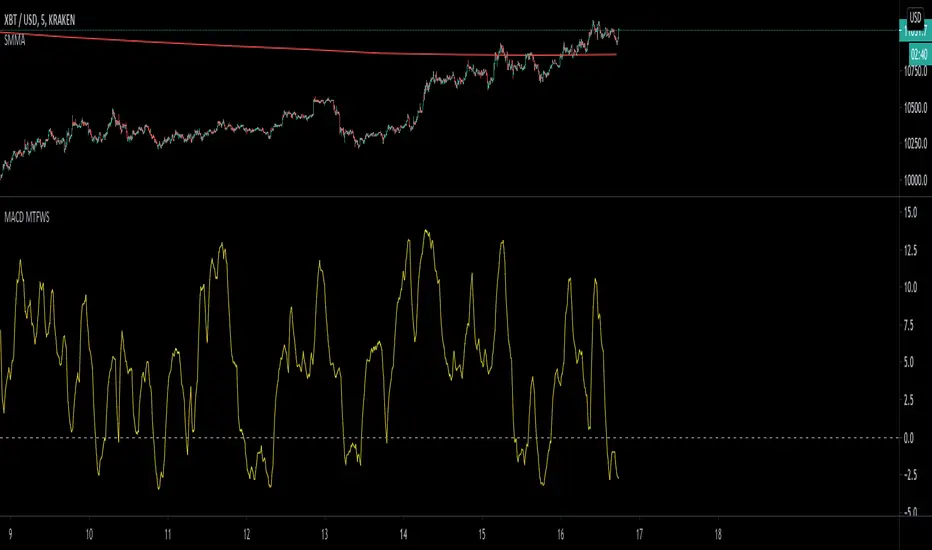
MACD Multiple Time Frames Weighted Momentum Score OscillatorThis script looks at the current momentum direction (up or down) for the 5 minute, 30 minute, 1 hour, 4 hour and daily and allows you to set scores of importance to these.
These scores are then added up to create an oscillator matching your preferences. Tune the indicator to match what you believe is the most important time frames that people use and score it accordingly. The values I put by default are just for demonstration.
For example, (and if you want to test to verify it's working), set the scores to 0 for everything except for the daily). Look at the daily macD by adding it as an indicator and set a score. Whenever the macD is trending up it will add the appropriate value to the score and likewise remove it when it's not.
Enjoy!
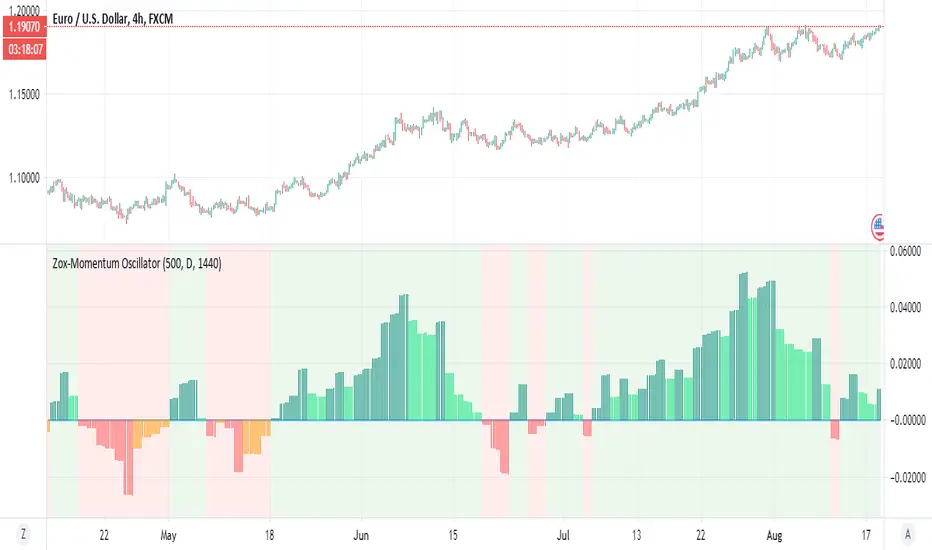
Zox-Momentum OscillatorThis is a new member of the Zox indicator which is based on momentum
look pretty accurate
green is stron buy
lime =weak buy
red=strong sell
orange=weak sell
its no repainting MTF as it has no security attach to it
try to play with length and MTF and candle time for better results
examples crypto
stocks
index
gold
silver
dow
forex
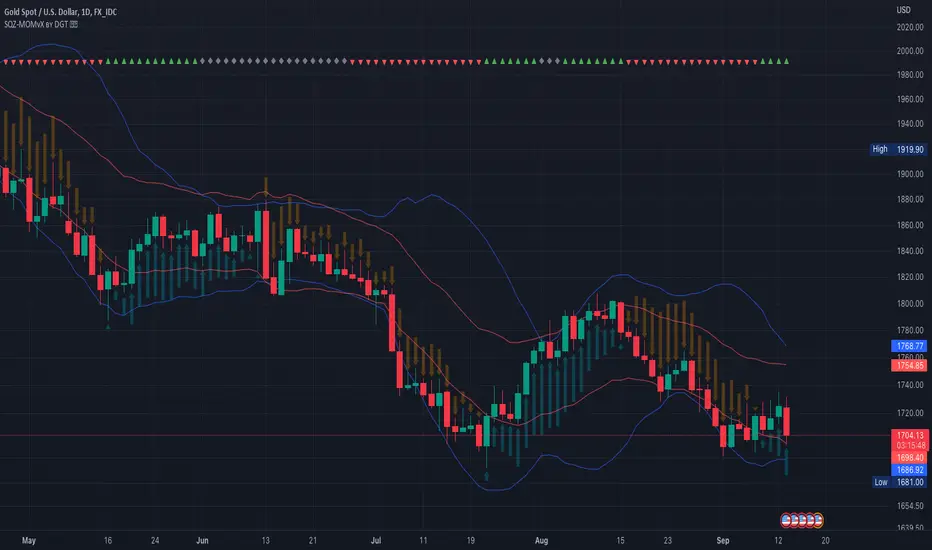
Squeeze Momentum Indicator [LazyBear] vX by DGTModified version of Squeeze Momentum Indicator visualizing on Price Chart
author: LazyBear, modified by KıvançÖZBİLGİÇ
Great Stochastic RSIThis is the Great stochastic rsi that color the candles on green when the K% is above the the D% and red when the K% is below the D%.
Stochastic rsi is a momentum indicator and it should be used to indicate the direction of the market.
It can be used as confirmation of a buy signal when the market is showing higher high and higher lows and after a red colored candle there is a green candle.
As well it can be used as confirmation of a sell signal when the market is showing lower high and lower lows and after a green colored candle there is a red candle.
or it can be used as exit indicator when on uptrend after the green candles there is a red candle or on the downtrend after red candles there is a green candle.

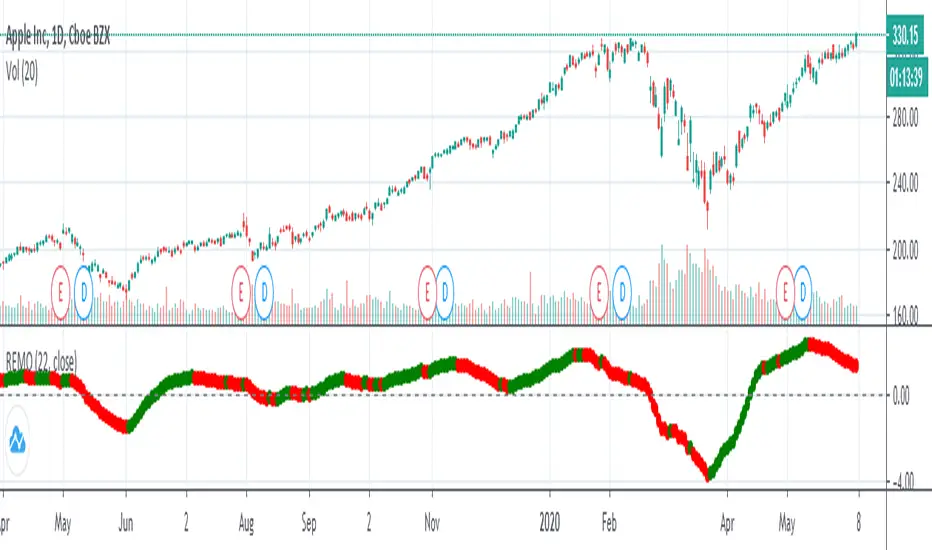
Regularized MomentumThis is a 1 bar momentum using a regularized ema (Chris Satchwell, Pattern Recognition And Trading Decisions pag.192) with a limit lambda (John F. Ehlers Cybernetic Analysis for Stocks and Futures pag.188), some say that is better than macd.
Stochastic RibbonA series of highs and lows of different lengths to create a ribbon-like indicator to emulate the stochastic oscillator's top (100), middle (50) and bottom (0). Traders can determine the strength of the support and resistance by the number of converging lines, choose price points and visualise momentum waves.
Inputs:
Theme: multiple colours/themes (theme 2)
Length: high/low length (14)
Start: plot number to start ribbon on (1)
PlotNumber: number of plots to show; maximum 10 per top, middle, bottom (10)
Example:
Length: 14
Start: 5
PlotNumber: 10

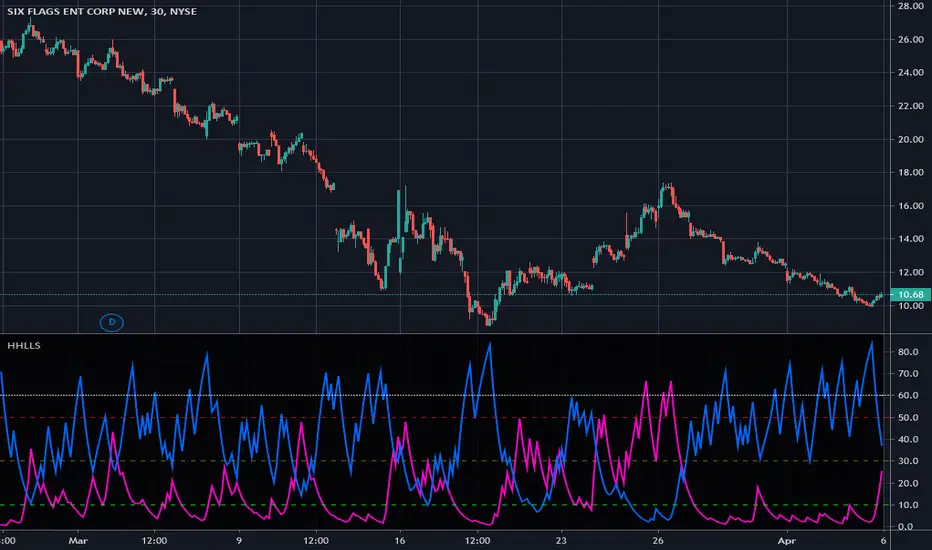
Higher Highs & Lower Lows Stochastics - Vitali ApirineThis is my modified "Higher Highs & Lower Lows Stochastics" employing PSv4.0, originally formulated by Vitali Apirine for TASC - February 2016 Traders Tips. Reading through a TASC magazine of mine, behold, I found a little known indicator that I can't find anywhere on all of Tradingview. That was a tragedy I felt I had to resolve... This indicator is best described as a dual momentum indicator, being helpful with anticipating reversals, spotting emerging trends, and defining correction periods. I felt it worthy of justice to unveil this for all TV members to utilize and also learn from. It's uniqueness is beyond past due for the honor it deserves on Tradingview.
As always, I have included advanced Pine programming techniques that conform to proper "Pine Etiquette". For those of you who are newcomers to Pine Script, this code release may also help you comprehend the "Power of Pine" by employing advanced programming techniques while exhibiting code utilization in a most effective manner. This script's uniqueness displays that we can now override built-in Pine functions. Firstly, you may have noticed that I replaced ema(), sma(), highest(), and lowest(). If you weren't aware of this Pine capability, well, here is a prime example... Now you know! Just heed caution when doing so to ensure your replacement algorithms are 100% sound. Lastly, I also added an additional "Median" line where the companion stochastics seemingly appear to gravitate within a central zone.
NOTICE: You may have observed, there is highest(), lowest(), ema(), and sma() custom functions overwriting Pine built-ins, some of which are audaciously used in ternary. "IF" you are planning to use Pine Script v4.0 functions in ternary, be forewarned, they WILL NOT operate as expected in most scenarios. The reason why I legitimately used them here in ternary is because they are ONLY manually controlled by an input(). If these were dynamically controlled with bar-to-bar dynamic conditional logic, you would most certainly run into serious unexpected programming issues, potentially resulting in hours of frustrations and guaranteed loss of hair. That's my lesson for this release, so never ever forget this when utilizing the full potential of the "Power of Pine". For more information concerning these potential dilemmas, please consult "Execution of Pine functions and historical context inside function blocks" in the "Pine Script v4 User Manual".
Features List Includes:
Dark Background - Easily disabled in indicator Settings->Style for "Light" charts or with Pine commenting
AND much, much more... You have the source!
The comments section below is solely just for commenting and other remarks, ideas, compliments, etc... regarding only this indicator, not others. When available time provides itself, I will consider your inquiries, thoughts, and concepts presented below in the comments section, should you have any questions or comments regarding this indicator. When my indicators achieve more prevalent use by TV members, I may implement more ideas when they present themselves as worthy additions. As always, "Like" it if you simply just like it with a proper thumbs up, and also return to my scripts list occasionally for additional postings. Have a profitable future everyone!