QFT MTF Range DetectorQFT MTF Range Detector — QuantumFlowTrader
Description:
The QFT MTF Range Detector is a multi-timeframe (MTF) tool designed to identify consolidation zones or ranging conditions across multiple intraday timeframes — from 1 minute up to 4 hours. This indicator is optimized for high-frequency trading environments such as scalping and day trading.
How it works:
For each selected timeframe, the indicator evaluates five key technical conditions:
- Low ADX (less than 17) – suggesting weak trend strength.
- Range width within a specific normalized threshold.
- Normalized ATR (volatility filter) in a defined range.
- RSI near the neutral zone (40–60) with low volatility.
- Price proximity to the mid-range (consolidation center).
Each condition contributes a score. If at least 3 out of 5 conditions are met, that timeframe is considered to be in a range (consolidation).
Visual output:
A compact table is displayed on the chart showing all selected timeframes:
Black box = Timeframe is in a range (consolidation).
Purple box = Not in a range (likely trending or volatile).
Timeframes are labeled (e.g., "4H", "15M") for clarity.
Customization:
Choose display corner (top/bottom, left/right).
Enable or disable table borders.
Set custom colors for range and non-range signals.
Use case:
Traders can quickly assess which timeframes are in a range, helping them:
Avoid choppy markets,
Time entries and exits better,
Confirm multi-timeframe alignment.
Note: This is not a buy/sell signal indicator. It is a market condition filter to enhance decision-making.
在腳本中搜尋"mtf"

[CT] Kurutoga MTF HistogramWhat is Kurutoga MTF Histogram?
The Kurutoga MTF Histogram is a multi-time-frame momentum and mean-deviation tool.
It measures how far the current close is trading away from a rolling midpoint of price and then displays that deviation as a color-coded histogram.
Instead of looking only at one lookback, this version plots three Kurutoga “leads” at the same time:
Kurutoga Lead (x1) – base length
Kurutoga Lead 2x – slower, 2 × base length
Kurutoga Lead 4x – slowest, 4 × base length
Each lead is calculated both on the chart’s timeframe (LTF) and on a Higher Time Frame (HTF) of your choice, so you can see short-term deviation inside a higher-time-frame structure.
4-color Kurutoga scheme
Each Kurutoga lead uses a 4-color MACD-style scheme:
For a given lead:
Up Light – divergence ≥ 0 and rising compared to the previous bar
Up Dark – divergence ≥ 0 and falling (positive but losing momentum)
Down Light – divergence < 0 and falling (bearish momentum increasing)
Down Dark – divergence < 0 and rising (negative but contracting)
By default the same four teal / red hues are shared across x1, x2, and x4. The only difference between the leads is transparency:
x1 = strongest (least transparent)
x2 = medium opacity
x4 = faintest
This lets you see all three layers at once without the chart becoming a solid block of color.
The HTF areas use the same palette but with an extra transparency offset applied, so they appear as soft background bands rather than competing with the histograms.
Inputs and how to use them
1. Base Length
Defines the lookback for the main Kurutoga Lead.
The script automatically creates:
len1 = baseLength
len2 = baseLength × 2
len3 = baseLength × 4
Smaller base lengths → faster, more reactive histograms.
Larger base lengths → smoother, trend-focused behavior.
2. Higher Time Frame
This is the HTF used for the area plots and HTF midpoints.
Examples:
5-minute chart with HTF = 30 or 60 minutes
15-minute chart with HTF = 4H or 1D
The idea is to trade on the lower timeframe while seeing how far price is stretched relative to a higher-time-frame range midpoint.
3. Show / Hide toggles
Under “Show / Hide” you can independently turn on/off:
Kurutoga Lead (x1)
Kurutoga Lead 2x
Kurutoga Lead 4x
HTF Lead, HTF Lead 2x, HTF Lead 4x
This lets you:
Run only a single Kurutoga if you want a clean panel, or
Stack multiple leads for a “multi-speed” view of extension and mean reversion.
4. Color Scheme (4-color Kurutoga)
Up Light / Up Dark / Down Light / Down Dark – base hues used for every lead.
Lead opacity (x1, 2x, 4x) – sets how strong or faint each lead appears.
x1 is usually your primary “trading speed.”
x2 and x4 can be faded so they act as context.
Extra transparency for HTF areas – additional opacity applied on top of each lead’s opacity when drawing HTF areas. This keeps the HTF layer subtle.
You can fine-tune the exact teal/red values here to match your personal palette.
Practical reading & trade ideas
Trend alignment
When all three Kurutoga leads (x1, 2x, 4x) are above zero, price is trading above its rolling mid-range on multiple speeds → bullish environment.
When all three are below zero, you have a multi-speed bearish environment.
Mixed readings (e.g., x1 above zero, x4 below zero) can signal transition or mean-reversion areas.
Momentum vs exhaustion
Up Light / Down Light (light colors) show momentum expanding in that direction.
Up Dark / Down Dark (dark colors) show momentum contracting – price still on that side of zero, but the push is weakening.
After a run of Up Light bars, a shift to Up Dark may hint at a stall or pullback.
After a run of Down Light bars, a shift to Down Dark may hint at short covering / bounce potential.
Multi-time-frame confluence
Use the HTF areas as a backdrop:
If LTF Kurutoga leads are above zero while the HTF area is also positive (and ideally expanding), that’s strong bullish alignment.
If LTF leads are trying to flip up while HTF divergence is still deeply negative, you may be looking at a counter-trend bounce rather than a true trend change.
Example setups
Trend-following entries:
Look for x2 & x4 leads on the same side of zero as the HTF area, then use x1 color shifts (from Down Dark → Up Light or vice versa) to fine-tune entries in the direction of that higher-time-frame bias.
Mean-reversion fades:
Watch for extreme Kurutoga values where x1/x2 are strongly extended beyond zero while color flips from Light to Dark (momentum stalling) against an opposing HTF backdrop .
Notes
The indicator is non-directional by itself – it measures distance from a rolling midpoint rather than trend structure or order flow. It works best when combined with your existing price action/trend tools (moving averages, HLBO, structure zones, etc.).
Because HTF values are brought down via request.security, choose HTF settings that make sense for your product and session (for example, don’t use very high HTFs on thin intraday markets).
Use the Kurutoga MTF Histogram as a visual scanner for extension, momentum regime, and multi-speed alignment, then layer your own entry/exit rules on top.

Turtle System 1 (20/10) + N-Stop + MTF Table V7.2🐢 Description: Turtle System 1 (20/10) IndicatorThis indicator implements the original trading signals of the Turtle Trading System 1 based on the classic Donchian Channels. It incorporates a historically correct, volatility-based Trailing Stop (N-Stop) and a Multi-Timeframe (MTF) status dashboard. The script is written in Pine Script v6, optimized for performance and reliability.📊 Core Logic and ParametersThe system is a pure trend-following model, utilizing the more widely known, conservative parameters of the Turtle System 1:FunctionParameterValueDescriptionEntry$\text{Donchian Breakout}$$\mathbf{20}$Buy/Sell upon breaking the 20-day High/Low.Exit (Turtle)$\text{Donchian Breakout}$$\mathbf{10}$Close the position upon breaking the 10-day Low/High.Volatility$\mathbf{N}$ (ATR Period)$\mathbf{20}$Calculation of market volatility using the Average True Range (ATR).Stop-LossMultiplier$\mathbf{2.0} BER:SETS the initial and Trailing Stop at $\mathbf{2N}$.🛠️ Key Technical Features1. Original Turtle Trailing Stop (Section 4)The stop-loss mechanism is implemented with the historically accurate Turtle Trailing Logic. The stop is not aggressively tied to the current candle's low/high, which often causes premature exits. Instead, the stop only trails in the direction of the trend, maximizing the previous stop price against the new calculated $\text{Close} \pm 2N$:$$\text{New Trailing Stop} = \text{max}(\text{Previous Stop}, \text{Close} \pm (2 \times N))$$2. Reliable Multi-Timeframe (MTF) Status (Section 6)The indicator features a robust MTF status table.Purpose: It calculates and persistently stores the Turtle System 1 status (LONG=1, SHORT=-1, FLAT=0) for various timeframes (1H, 4H, 8H, 1D, and 1W).Method: It uses global var int variables combined with request.security(), ensuring the status is accurately maintained and updated across different bars and timeframes, providing a reliable higher-timeframe context.3. VisualizationsChannels: The 20-period (Entry) and 10-period (Exit) Donchian Channels are plotted.Stop Line: The dynamic $\mathbf{2N}$ Trailing Stop is visible as a distinct line.Signals: plotshape markers indicate Entry and Exit.MTF Table: A clean, color-coded status summary is displayed in the upper right corner.

Turtle System 2 (55/20) + N-Stop + MTF Table V7.2🐢 Description: Turtle System 2 (55/20) IndicatorThis indicator implements the trading signals of the Turtle Trading System 2 based on the classic Donchian Channels, supplemented by a historically correct, volatility-based Trailing Stop (N-Stop) and a Multi-Timeframe (MTF) status overview. The script was developed in Pine Script v6 and is optimized for performance and robustness.📊 Core Logic and ParametersThe indicator is based on the rule-based trend-following system developed by Richard Dennis and William Eckhardt, utilizing the more aggressive Entry/Exit parameters of System 2:FunctionParameterValueDescriptionEntry$\text{Donchian Breakout}$$\mathbf{55}$Buy/Sell upon breaking the 55-day High/Low.Exit (Turtle)$\text{Donchian Breakout}$$\mathbf{20}$Close the position upon breaking the 20-day Low/High.Volatility$\mathbf{N}$ (ATR Period)$\mathbf{20}$Calculation of market volatility using the Average True Range (ATR).Stop-LossMultiplier$\mathbf{2.0} BER:SETS the initial and Trailing Stop at $\mathbf{2N}$.🛠️ Technical Implementation1. Correct Trailing Stop (Section 4)In contrast to many flawed implementations, the Trailing Stop is implemented here according to the Original Turtle Logic. The stop price (current_stop_price) is not aggressively tied to the current low or high. Instead, at the close of each bar, it is only trailed in the direction of the trade (math.max for long positions) based on the formula:$$\text{New Trailing Stop} = \text{max}(\text{Previous Stop}, \text{Close} \pm (2 \times N))$$This ensures the stop is only adjusted upon sustained positive movement and is not prematurely triggered by short-term, deep price shadows.2. Reliable Multi-Timeframe (MTF) Logic (Section 6)The MTF section utilizes global var int variables (mtf_status_1h, mtf_status_D, etc.) in conjunction with the request.security() function.Purpose: Calculates and persistently stores the current Turtle System 2 status (LONG=1, SHORT=-1, FLAT=0) for the timeframes 1H, 4H, 8H, 1D, and 1W.Advantage: By persistently storing the status using the var variables, the critical error of single-update status is eliminated. The states shown in the table are reliable and accurately reflect the Turtle System's position status on the respective timeframes.3. Visual ComponentsDonchian Channels: The entry (55-period) and exit (20-period) channels are drawn with color highlighting.N-Stop Line: The dynamically calculated Trailing Stop ($\mathbf{2N}$) is displayed as a magenta line.Visual Signals: plotshape markers indicate Entry and Exit points.MTF Table: A compact status summary with color coding (Green/Red/Gray) for the higher timeframes is displayed in the upper right corner.

💎 Trend Master Pro Scalping MTFTrend Master Pro Scalping MTF is a professional-grade indicator designed for intraday trading and scalping, optimized for 1M, 5M, and 15M timeframes. It combines multiple technical filters to provide high-confidence breakout and trend signals with visual clarity.
Key Features:
Multi-indicator analysis: EMA, RSI, ATR, SuperTrend, and volume.
Multi-Timeframe (MTF) filter: signals are validated only if the higher timeframe trend is aligned.
Clear visual signals: colored triangles and dynamic labels showing signal strength: A++, A+, A, B.
Confirmation dashboard: instantly see EMA trend, RSI strength, volume, ATR activity, SuperTrend direction, and final signal on your chart.
Reliable alerts: fixed alert messages compatible with TradingView, avoiding Pine Script errors.
Customizable parameters: adjust EMA, RSI, ATR, volume, and SuperTrend settings to match your scalping or day trading style.
How to Use:
Select your desired timeframe: 1M, 5M, or 15M.
Look for signals rated A++ or A+ for maximum probability.
Confirm trends using labels and the dashboard before entering trades.
Receive real-time notifications via alerts when confirmed signals occur.
Benefits:
Ideal for quick scalping and intraday strategies.
Reduces false signals with MTF trend filtering.
Professional visualization for fast and confident decision-making.
Recommendations:
Test on a demo account before trading live.
Adjust parameters to fit your asset and timeframe.
Combine with proper risk management strategies.

Pinbar MTF - No Repaint# Pinbar MTF - No Repaint Indicator
## Complete Technical Documentation
---
## 📊 Overview
**Pinbar MTF (Multi-Timeframe) - No Repaint** is a professional-grade TradingView Pine Script indicator designed to detect high-probability pinbar reversal patterns with advanced filtering systems. The indicator is specifically engineered to be **100% non-repainting**, making it reliable for both live trading and backtesting.
### Key Features
✅ **Non-Repainting** - Signals only appear AFTER bar closes, never disappear
✅ **Three-Layer Filter System** - ATR, SWING, and RSI filters
✅ **Automatic SL/TP Calculation** - Based on risk:reward ratios
✅ **Real-time Alerts** - TradingView notifications for all signals
✅ **Visual Trade Management** - Lines, labels, and areas for entries, stops, and targets
✅ **Backtesting Ready** - Reliable historical data for strategy testing
---
## 🎯 What is a Pinbar?
A **Pinbar (Pin Bar/Pinocchio Bar)** is a single candlestick pattern that indicates a potential price reversal:
### Bullish Pinbar (BUY Signal)
- **Long lower wick** (rejection of lower prices)
- **Small body at the top** of the candle
- Shows buyers rejected sellers' attempt to push price down
- Forms at support levels or swing lows
- Entry signal for LONG positions
### Bearish Pinbar (SELL Signal)
- **Long upper wick** (rejection of higher prices)
- **Small body at the bottom** of the candle
- Shows sellers rejected buyers' attempt to push price up
- Forms at resistance levels or swing highs
- Entry signal for SHORT positions
---
## 🔧 How the Indicator Works
### 1. **Pinbar Detection Logic**
The indicator analyzes the **previous closed bar ** to identify pinbar patterns:
```
Bullish Pinbar Requirements:
- Lower wick > 72% of total candle range (adjustable)
- Upper wick < 28% of total candle range
- Close > Open (bullish candle body)
Bearish Pinbar Requirements:
- Upper wick > 72% of total candle range (adjustable)
- Lower wick < 28% of total candle range
- Close < Open (bearish candle body)
```
**Why check ?** By analyzing the previous completed bar, we ensure the pattern is fully formed and won't change, preventing repainting.
---
### 2. **Three-Layer Filter System**
#### 🔍 **Filter #1: ATR (Average True Range) Filter**
- **Purpose**: Ensures the pinbar has significant size
- **Function**: Only signals if pinbar range ≥ ATR value
- **Benefit**: Filters out small, insignificant pinbars
- **Settings**:
- Enable/Disable toggle
- ATR Period (default: 7)
**Example**: If ATR = 50 pips, only pinbars with 50+ pip range will signal.
---
#### 🔍 **Filter #2: SWING Filter** (Always Active)
- **Purpose**: Confirms pinbar forms at swing highs/lows
- **Function**: Validates the pinbar is an absolute high/low
- **Benefit**: Identifies true reversal points
- **Settings**:
- Swing Candles (default: 3)
**How it works**:
- For bullish pinbar: Checks if low is lowest of past 3 bars
- For bearish pinbar: Checks if high is highest of past 3 bars
**Example**: With 3 swing candles, a bullish pinbar must have the lowest low among the last 3 bars.
---
#### 🔍 **Filter #3: RSI (Relative Strength Index) Filter**
- **Purpose**: Confirms momentum conditions
- **Function**: Prevents signals in extreme momentum zones
- **Benefit**: Avoids counter-trend trades
- **Settings**:
- Enable/Disable toggle
- RSI Period (default: 7)
- RSI Source (Close, Open, High, Low, HL2, HLC3, OHLC4)
- Overbought Level (default: 70)
- Oversold Level (default: 30)
**Logic**:
- Bullish Pinbar: Only signals if RSI < 70 (not overbought)
- Bearish Pinbar: Only signals if RSI > 30 (not oversold)
---
### 3. **Stop Loss Calculation**
Two methods available:
#### Method A: ATR-Based Stop Loss (Recommended)
```
Bullish Pinbar:
SL = Pinbar Low - (1 × ATR)
Bearish Pinbar:
SL = Pinbar High + (1 × ATR)
```
**Benefit**: Dynamic stops that adapt to market volatility
#### Method B: Fixed Pips Stop Loss
```
Bullish Pinbar:
SL = Pinbar Low - (Fixed Pips)
Bearish Pinbar:
SL = Pinbar High + (Fixed Pips)
```
**Settings**:
- Calculate Stop with ATR (toggle)
- Stop Pips without ATR (default: 5)
---
### 4. **Take Profit Calculation**
Take Profit is calculated based on Risk:Reward ratio:
```
Bullish Trade:
TP = Entry + (Entry - SL) × Risk:Reward Ratio
Bearish Trade:
TP = Entry - (SL - Entry) × Risk:Reward Ratio
```
**Example**:
- Entry: 1.2000
- SL: 1.1950 (50 pip risk)
- RR: 2:1
- TP: 1.2100 (100 pip reward = 50 × 2)
**Settings**:
- Risk:Reward Ratio (default: 1.0, range: 0.1 to 10.0)
---
## 📈 Visual Elements
### On-Chart Displays
1. **Signal Markers**
- 🟢 **Green Triangle Up** = Bullish Pinbar (BUY)
- 🔴 **Red Triangle Down** = Bearish Pinbar (SELL)
- Placed directly on the pinbar candle
2. **Entry Labels**
- Green "BUY" label with entry price
- Red "SELL" label with entry price
- Shows exact entry level
3. **Stop Loss Lines**
- 🔴 Red horizontal line
- "SL" label
- Extends 20 bars forward
4. **Take Profit Lines**
- 🟢 Green horizontal line
- "TP" label
- Extends 20 bars forward
5. **Risk/Reward Areas** (Optional)
- Red shaded box = Risk zone (Entry to SL)
- Green shaded box = Reward zone (Entry to TP)
- Visual risk:reward visualization
6. **Info Table** (Top Right)
- Displays current settings
- Shows filter status (ON/OFF)
- Real-time RSI value
- Quick reference panel
---
## 🔔 Alert System
Three alert types available:
### 1. Combined Alert: "Pinbar Signal (Any Direction)"
- Fires for BOTH bullish and bearish pinbars
- **Best for**: General monitoring
- **Message**: "Pinbar Signal Detected on {TICKER} at {PRICE}"
### 2. Bullish Alert: "Bullish Pinbar Alert"
- Fires ONLY for BUY signals
- **Best for**: Long-only strategies
- **Message**: "BUY Signal on {TICKER} at {PRICE}"
### 3. Bearish Alert: "Bearish Pinbar Alert"
- Fires ONLY for SELL signals
- **Best for**: Short-only strategies
- **Message**: "SELL Signal on {TICKER} at {PRICE}"
---
## ⚙️ Input Parameters Reference
### **Filters Group**
| Parameter | Default | Range | Description |
|-----------|---------|-------|-------------|
| ATR Filter on Pinbar Range? | ✅ ON | Boolean | Enable/disable ATR filter |
| ATR Period | 7 | 1+ | Lookback period for ATR calculation |
| Swing Candles | 3 | 1+ | Bars to check for swing high/low |
| RSI Filter on Pinbar? | ❌ OFF | Boolean | Enable/disable RSI filter |
| RSI Period | 7 | 2+ | Lookback period for RSI calculation |
| RSI Source | Close | Multiple | Price data for RSI (Close/Open/High/Low/etc) |
| RSI Overbought Level | 70 | 50-100 | Upper threshold for RSI filter |
| RSI Oversold Level | 30 | 0-50 | Lower threshold for RSI filter |
### **Pinbar Detection Group**
| Parameter | Default | Range | Description |
|-----------|---------|-------|-------------|
| Shadow % vs Body | 72 | 50-95 | Minimum wick size as % of total range |
### **Visualization Group**
| Parameter | Default | Range | Description |
|-----------|---------|-------|-------------|
| Show SL and TP Lines? | ✅ ON | Boolean | Display stop loss and take profit lines |
| Show SL and TP Area? | ❌ OFF | Boolean | Show shaded risk/reward boxes |
### **Risk Management Group**
| Parameter | Default | Range | Description |
|-----------|---------|-------|-------------|
| Risk:Reward Ratio | 1.0 | 0.1-10.0 | Target profit vs risk (1.0 = 1:1, 2.0 = 1:2) |
| Calculate Stop with ATR? | ✅ ON | Boolean | Use ATR for stop calculation |
| Stop Pips without ATR | 5 | 1+ | Fixed pip stop when ATR disabled |
---
## 🚫 Non-Repainting Architecture
### What is Repainting?
**Repainting** occurs when an indicator's historical signals differ from what appeared in real-time. This makes backtesting unreliable and can lead to false confidence in a strategy.
### How This Indicator Prevents Repainting
1. **Closed Bar Analysis**
- All calculations use ` ` offset (previous bar)
- Only analyzes COMPLETED candles
- Signals appear on the bar AFTER the pinbar closes
2. **Confirmed Swing Points**
- Waits for sufficient bar history before signaling
- Only checks historical bars that cannot change
- Prevents premature swing detection
3. **Static Alert Timing**
- Alerts fire only after bar completion
- No conditional logic that changes historically
- Same results in replay mode and live trading
### Verification Method
To verify non-repainting behavior:
1. Apply indicator to chart
2. Note signal locations and prices
3. Refresh browser / reload chart
4. **Signals remain in exact same locations**
---
## 💼 Trading Strategy Guidelines
### Entry Rules
**For Bullish Pinbar (LONG):**
1. Wait for green triangle to appear
2. Enter at close of pinbar (shown in label)
3. Alternative: Enter on break of pinbar high
4. Place stop loss at red SL line
5. Set target at green TP line
**For Bearish Pinbar (SHORT):**
1. Wait for red triangle to appear
2. Enter at close of pinbar (shown in label)
3. Alternative: Enter on break of pinbar low
4. Place stop loss at red SL line
5. Set target at green TP line
### Risk Management
- **Position Sizing**: Risk only 1-2% of account per trade
- **Stop Loss**: Always use the calculated SL (never move it wider)
- **Take Profit**: Use calculated TP or trail stop after 1:1 RR
- **Multiple Timeframes**: Confirm signals on higher timeframe
### Best Practices
✅ **DO:**
- Wait for bar to close before entering
- Trade in direction of higher timeframe trend
- Use on liquid markets with clear support/resistance
- Combine with price action analysis
- Keep a trading journal
❌ **DON'T:**
- Enter before bar closes (prevents seeing full pattern)
- Trade against strong trends
- Ignore the filters (they improve win rate)
- Risk more than 2% per trade
- Trade every signal (be selective)
---
## 📊 Backtesting & Data Export
### Available Data Points
The indicator exports these values for strategy development:
| Output | Description |
|--------|-------------|
| Bullish Signal | 1 = BUY signal, 0 = No signal |
| Bearish Signal | 1 = SELL signal, 0 = No signal |
| Bull SL | Stop loss level for long trades |
| Bull TP | Take profit level for long trades |
| Bull Entry | Entry price for long trades |
| Bear SL | Stop loss level for short trades |
| Bear TP | Take profit level for short trades |
| Bear Entry | Entry price for short trades |
### How to Use in Strategy
These values can be accessed by Pine Script strategies using:
```pine
indicator_values = request.security(syminfo.tickerid, timeframe.period,
)
```
---
## 🎓 Understanding the Filters
### Why Use Multiple Filters?
Single-indicator systems often generate too many false signals. This indicator uses a **confluence approach**:
1. **Pinbar Pattern** = Price rejection detected
2. **+ SWING Filter** = Rejection at key level
3. **+ ATR Filter** = Significant move
4. **+ RSI Filter** = Favorable momentum
**Result**: Higher probability setups with better risk:reward
### Filter Optimization
**Conservative Settings** (Fewer, Higher Quality Signals):
- ATR Filter: ON
- Swing Candles: 5
- RSI Filter: ON
- Shadow %: 75%
**Aggressive Settings** (More Signals, More Noise):
- ATR Filter: OFF
- Swing Candles: 2
- RSI Filter: OFF
- Shadow %: 65%
**Balanced Settings** (Recommended):
- ATR Filter: ON
- Swing Candles: 3
- RSI Filter: OFF (or ON for trending markets)
- Shadow %: 72%
---
## 🔍 Troubleshooting
### "No Signals Appearing"
**Possible Causes:**
1. Filters are too strict
2. No pinbars forming on chart
3. Insufficient bar history
**Solutions:**
- Reduce Shadow % to 65%
- Reduce Swing Candles to 2
- Disable ATR or RSI filters temporarily
- Check that chart has enough data loaded
### "Too Many Signals"
**Solutions:**
- Enable ATR filter
- Increase Swing Candles to 4-5
- Enable RSI filter
- Increase Shadow % to 75-80%
### "Signals Appearing Late"
**This is normal behavior!** The indicator:
- Analyzes previous closed bar
- Signals appear on the bar AFTER the pinbar
- This is what prevents repainting
- Signal latency is 1 bar (by design)
---
## 📝 Technical Specifications
**Indicator Type:** Overlay (displays on price chart)
**Pine Script Version:** 5
**Max Labels:** 500
**Max Lines:** 500
**Repainting:** None (100% non-repainting)
**Data Window Values:** 8 exported values
**Alert Types:** 3 (Combined, Bullish, Bearish)
**Performance:**
- Lightweight script (fast execution)
- Works on all timeframes
- Compatible with all markets (Forex, Crypto, Stocks, Futures)
- No data snooping bias
---
## 🎯 Use Cases
### 1. **Swing Trading**
- Timeframe: Daily, 4H
- Filter Settings: All enabled
- Best for: Catching major reversals
### 2. **Day Trading**
- Timeframe: 15m, 1H
- Filter Settings: ATR + SWING only
- Best for: Intraday reversals
### 3. **Scalping**
- Timeframe: 5m, 15m
- Filter Settings: SWING only (aggressive)
- Best for: Quick reversals (requires experience)
### 4. **Position Trading**
- Timeframe: Weekly, Daily
- Filter Settings: All enabled + high RR (2:1 or 3:1)
- Best for: Long-term trend reversal catches
---
## 🏆 Advantages Over Other Pinbar Indicators
✅ **Guaranteed Non-Repainting** - Many pinbar indicators repaint; this one never does
✅ **Automatic SL/TP** - No manual calculation needed
✅ **Multi-Layer Filtering** - Reduces false signals significantly
✅ **Visual Trade Management** - Clear entry, stop, and target levels
✅ **Flexible Configuration** - Adaptable to any trading style
✅ **Alert System** - Never miss a setup
✅ **Backtesting Ready** - Reliable historical data
✅ **Professional Grade** - Suitable for live trading
---
## 📚 Educational Resources
### Recommended Reading on Pinbars
- "The Pin Bar Trading Strategy" by Nial Fuller
- "Price Action Trading" by Al Brooks
- TradingView Education: Price Action Patterns
### Practice Recommendations
1. Paper trade signals for 20+ trades before live trading
2. Backtest on different timeframes and markets
3. Keep detailed records of all trades
4. Analyze winning vs losing setups
5. Refine filter settings based on results
---
## ⚖️ Disclaimer
This indicator is a tool for technical analysis and does not guarantee profits. Trading involves substantial risk of loss. Past performance is not indicative of future results.
- Always use proper risk management
- Never risk more than you can afford to lose
- Consider your trading experience and objectives
- Seek independent financial advice if needed
---
## 📧 Version Information
**Current Version:** 1.0
**Last Updated:** 2024
**Compatibility:** TradingView Pine Script v5
**Status:** Production Ready
---
## 🔄 Future Enhancements (Potential)
Possible future additions:
- Multi-timeframe confirmation option
- Volume filter integration
- Customizable color schemes
- Win rate statistics display
- Partial profit taking levels
- Trailing stop functionality
---
## 📖 Quick Start Guide
### 5-Minute Setup
1. **Add to Chart**
- Open TradingView
- Go to Pine Editor
- Paste the code
- Click "Add to Chart"
2. **Configure Settings**
- Open indicator settings (gear icon)
- Start with default settings
- Enable "Show SL and TP Lines"
3. **Set Alert**
- Right-click indicator name
- Click "Add Alert"
- Select "Pinbar Signal (Any Direction)"
- Configure notification method
4. **Test**
- Scroll back on chart
- Verify signals make sense
- Check that signals don't repaint
5. **Trade** (After Practice!)
- Wait for alert
- Verify signal quality
- Enter, place SL/TP
- Manage trade
---
## 🎯 Final Thoughts
The **Pinbar MTF - No Repaint** indicator is designed for serious traders who value:
- **Reliability** over flashy signals
- **Quality** over quantity
- **Honesty** over false promises
This indicator will NOT:
- Make you rich overnight
- Win every trade
- Replace proper trading education
This indicator WILL:
- Identify high-probability reversal setups
- Save you analysis time
- Provide consistent, non-repainting signals
- Help you develop a systematic trading approach
**Success in trading comes from:**
1. Proper education (60%)
2. Risk management (30%)
3. Technical tools like this indicator (10%)
Use this tool as part of a complete trading plan, not as a standalone solution.

VWMA Series (Dynamic) mtf - Dual Gradient Colored"VWMA Series (Dynamic) mtf - Dual Gradient Colored" is a multi-timeframe (MTF) Volume-Weighted Moving Average (VWMA) ribbon indicator that plots up to 60 sequential VWMAs with arithmetic progression periods (e.g., 1, 4, 7, 10…). Each VWMA line is dual-gradient colored: Base hue = Greenish (#2dd204) if close > VWMA (bullish), Magenta (#ff00c8) if close < VWMA (bearish)
Brightness gradient = fades from base → white as period increases (short → long-term)
Uses daily resolution by default (timeframe="D"), making it ideal for higher-timeframe trend filtering on lower charts.Key FeaturesFeature
Description
Dynamic Periods
Start + i × Increment → e.g., 1, 4, 7, 10… up to 60 terms
Dual Coloring
Bull/Bear + Gradient (short = vivid, long = pale)
MTF Ready
Plots daily VWMAs on any lower timeframe (1H, 15M, etc.)
No Lag on Long Sets
Predefined "best setups" eliminate repainting/lag
Transparency Control
Adjustable line opacity for clean visuals
Scalable
Up to 60 VWMAs (max iterations)
Recommended Setups (No Lag)Type
Example Sequence (Start, Inc, Iter)
Long-Term Trend
1, 3, 30 → 1, 4, 7 … 88
93, 3, 30 → 93, 96 … 180
372, 6, 30 → 372, 378 … 546
Short-Term Momentum
1, 1, 30 → 1, 2, 3 … 30
94, 2, 30 → 94, 96 … 152
1272, 5, 30 → 1272, 1277 … 1417
Key Use CasesUse Case
How to Use
1. Multi-Timeframe Trend Alignment
On 1H chart, use 1, 3, 30 daily VWMAs → price above all green lines = strong uptrend
2. Dynamic Support/Resistance
Cluster of long-term pale VWMAs = major S/R zone
3. Early Trend Change Detection
Short-term vivid lines flip from red → green before longer ones = early bullish signal
4. Ribbon Compression/Expansion
Tight bundle → consolidation; fanning out → trend acceleration
5. Mean Reversion Entries
Price far from long-term VWMA cluster + short-term reversal = pullback trade
6. Volume-Weighted Fair Value
Long-period VWMAs reflect true average price paid over weeks/months
Visual Summary
Price ↑
████ ← Short VWMA (vivid green = close > VWMA)
███
██
█
. . . fading to white
█
██
███
████ ← Long VWMA (pale = institutional average)
Green lines = price above VWMA (bullish bias)
Magenta lines = price below VWMA (bearish bias)
Gradient = shorter (left) → brighter; longer (right) → whiter
Ribbon thickness = trend strength (wide = strong, narrow = weak)
Best For Swing traders using daily trend on intraday charts
Volume-based strategies (VWMA > SMA)
Clean, colorful trend visualization without clutter
Institutional fair value anchoring via long-period VWMAs
Pro Tip:
Use Start=1, Increment=3, Iterations=30 on a 4H chart with timeframe="D" → perfect daily trend filter with zero lag and beautiful gradient flow.

LA - EMA Bands with MTF DashboardDetailed Explanation of the LA - EMA Bands with MTF Dashboard Indicator
This custom Pine Script v6 indicator, designed for Trading View, overlays EMA-based price channels on the chart while incorporating a multi-timeframe (MTF) dashboard for broader market context. It focuses on visualizing trend direction and momentum through three sets of EMA bands, each representing different time horizons, and extends this with a tabular dashboard that summarizes signals across user-selected timeframes. The bands help identify support, resistance, and trend shifts, while the dashboard provides at-a-glance alignment across multiple periods, aiding in confirming trades or spotting divergences. Unlike volatility-based channels (e.g., Bollinger or Keltner), it relies solely on EMAs for simplicity and lag-reduced responsiveness.
Inputs Section
The script begins with user-configurable options grouped for ease. A timeframe input allows specifying a resolution for the EMA bands' data fetching, defaulting to the chart's timeframe if left empty—this enables higher-timeframe overlays on lower charts for context.
Next, a shared source input defines the price data for all midlines, defaulting to the midpoint of high and low (hl2) but customizable to close, open, or others.
The EMA bands have dedicated toggles and length inputs for each of the three sets: the first (long-term) defaults to 144 periods, the second (medium-term) to 72, and the third (short-term) to 12. These are inlined for compact settings panels, with minimum lengths of 1 to prevent errors.
A boolean toggle controls the visibility of the MTF dashboard. Following this are nine pairs of inputs for dashboard timeframes: each pair includes a show/hide toggle and an editable timeframe string (e.g., '1' for 1-minute, 'D' for daily). Defaults progress from short (1, 3, 5 minutes) to longer (15, 30, 60 minutes, daily, weekly, monthly), grouped in inlines for organization. Only enabled and non-empty timeframes appear in the dashboard.
Helpers Section
Two utility functions are defined here. The first computes an EMA on any source series over a specified length using Trading View's built-in function, reused throughout for midlines and bands.
The second function generates a signal string ("B" for buy/bullish, "S" for sell/bearish, or "-" for neutral) based on the direction of an EMA applied to high prices. It compares the current EMA value to the previous one, mirroring the band fill logic for consistency in the dashboard.
Core Components per Band Set:
Midline: An EMA calculated on a user-selectable source price (default: hl2, which is the midpoint between high and low prices). This acts as the central trend line.
Upper Band: An EMA applied directly to the high prices of each bar.
Lower Band: An EMA applied to the low prices of each bar.
These form a channel that captures the smoothed range of price action, highlighting potential support (lower band), resistance (upper band), and overall trend direction (midline).
Multiple Band Sets: The indicator includes three independent EMA band sets, each with its own length parameter for customization:
EMA1 (default length: 144) – Focuses on long-term trends.
EMA2 (default length: 72) – Targets medium-term trends.
EMA3 (default length: 12) – Emphasizes short-term momentum.
Each set can be toggled on or off via input checkboxes, allowing users to reduce chart clutter if needed.
Visual Elements:
Midline Plot: Displayed as a line colored based on its direction compared to the previous bar: green for rising (bullish), red for falling (bearish), and black for neutral (flat).
Band Fill: The area between the upper and lower bands is filled with a semi-transparent color indicating the trend of the upper band: light green for rising (suggesting expanding highs/upward momentum) and light pink for falling (contracting highs/downward pressure). The bands themselves are plotted in blue with a thin linewidth.
Multi-Timeframe Support: Users can input a custom timeframe (e.g., 'D' for daily), and the indicator fetches data from that resolution. This enables higher-timeframe context on lower-timeframe charts, such as viewing daily EMA bands on a 1-hour chart.
Calculation Mechanics:
All EMAs are computed using Trading View's built-in ta.ema() function.
Data is retrieved in a single request.security() call for efficiency, with lookahead enabled to avoid repainting.
No multipliers or volatility adjustments are included, making it a simple EMA-based envelope rather than a true volatility channel.
In practice, this indicator helps traders identify trend strength, potential breakouts (price crossing bands), or mean-reversion opportunities (price bouncing within bands). It's particularly useful for swing or position trading where multi-period alignment (e.g., all midlines green) signals conviction.
Pros
Multi-Period Insight: By combining short (12), medium (72), and long (144) periods, it offers a layered view of trends across time horizons, helping confirm alignments or divergences without needing multiple separate indicators.
Visual Clarity: Color-coded trends and fills make it easy to spot bullish/bearish shifts at a glance, reducing analysis time.
Flexibility: Custom timeframe input allows for multi-timeframe analysis, while shared source and toggles provide user control.
Simplicity and Efficiency: Purely EMA-based, it's computationally light and avoids overcomplication, making it accessible for beginners while still useful for spotting channel-based setups like squeezes or expansions.
No Repainting: With lookahead, plots are stable once bars close.
Cons
Lagging Nature: EMAs inherently lag price action, especially longer ones like 144-period, which may cause delayed signals in fast-moving or ranging markets.
Lack of Volatility Adjustment: Unlike Keltner Channels or Bollinger Bands, it doesn't incorporate ATR or standard deviation, so bands may not accurately reflect true volatility—potentially leading to false breakouts in high-volatility environments.
Chart Clutter: Displaying all three band sets simultaneously can overcrowd the chart, particularly on lower timeframes or volatile assets.
Subjective Interpretation: Color changes and band interactions require trader discretion; there's no built-in alerting or quantitative signals, which might lead to inconsistent results.
Market Dependency: Defaults may not suit all assets (e.g., stocks vs. crypto); shorter periods like 12 could whipsaw in noisy markets, while 144 might be too slow for intraday trading.
Justification for Default Values (12, 72, and 144)
The default lengths of 12, 72, and 144 are not arbitrary but draw from established trading principles, particularly W.D. Gann's geometric and numerical theories, as well as Fibonacci sequences, to create a harmonic progression for short-, medium-, and long-term analysis. Here's the rationale:
12 (Short-Term): This is a common period for capturing recent momentum in technical indicators, often seen in setups like the MACD (which uses 12- and 26-day EMAs). It aligns with natural cycles, such as the 12 months in a year, and in Gann theory, 12 serves as a base unit for squaring price and time (e.g., in the "Square of 12" where multiples like 12, 24, etc., measure cycles in days, weeks, or months). At 12 periods, the EMA reacts quickly to price changes without excessive noise, making it ideal for short-term trend detection.
72 (Medium-Term): This acts as an intermediate bridge, derived from Gann's divisions of the 360-degree circle (a key Gann concept representing a full cycle). Specifically, 72 is 360/5 (relating to pentagonal geometry and natural harmonics) and appears in Gann's time cycle measurements (e.g., as a multiple in the Square of 12: 12×6=72). It's roughly half of 144, providing a balanced midpoint for medium-term trends without overlapping too closely with the others. In practice, 72 periods smooth out short-term fluctuations while still responding to developing trends.
144 (Long-Term): This is a powerhouse number in trading lore, being both 12 squared (12×12=144, central to Gann's "Square of 144" for monthly charts and major cycle turns, as there are 12 months in a year) and a Fibonacci sequence value (1, 1, 2, 3, 5, 8, 13, 21, 34, 55, 89, 144...). Fibonacci periods are popular in moving averages for their alignment with natural growth patterns in markets, and 144 is often used for long-term regime definition (e.g., confirming trends over 144 bars). It helps identify major support/resistance in extended cycles.
Overall, these values form a geometric/harmonic series (12, 72=12×6, 144=12×12), promoting alignment with market cycles as per Gann and Fibonacci principles, rather than generic lengths like 50 or 200. They can be adjusted based on the asset or timeframe, but the defaults provide a starting point rooted in time-tested trading numerology for balanced multi-period analysis.
Please use this along with other indicators (eg. Pivot, MACD, etc) for better results.

Two Poles Trend Finder MTF [BigBeluga]🔵 OVERVIEW
Two Poles Trend Finder MTF is a refined trend-following overlay that blends a two-pole Gaussian filter with a multi-timeframe dashboard. It provides a smooth view of price dynamics along with a clear summary of trend directions across multiple timeframes—perfect for traders seeking alignment between short and long-term momentum.
🔵 CONCEPTS
Two-Pole Filter: A smoothing algorithm that responds faster than traditional moving averages but avoids the noise of short-term fluctuations.
var float f = na
var float f_prev1 = na
var float f_prev2 = na
// Apply two-pole Gaussian filter
if bar_index >= 2
f := math.pow(alpha, 2) * source + 2 * (1 - alpha) * f_prev1 - math.pow(1 - alpha, 2) * f_prev2
else
f := source // Warm-up for first bars
// Shift state
f_prev2 := f_prev1
f_prev1 := f
Trend Detection Logic: Trend direction is determined by comparing the current filtered value with its value n bars ago (shifted comparison).
MTF Alignment Dashboard: Trends from 5 configurable timeframes are monitored and visualized as colored boxes:
• Green = Uptrend
• Magenta = Downtrend
Summary Arrow: An average trend score from all timeframes is used to plot an overall arrow next to the asset name.
🔵 FEATURES
Two-Pole Gaussian Filter offers ultra-smooth trend curves while maintaining responsiveness.
Multi-Timeframe Trend Detection:
• Default: 1H, 2H, 4H, 12H, 1D (fully customizable)
• Each timeframe is assessed independently using the same trend logic.
Visual Trend Dashboard positioned at the bottom-right of the chart with color-coded trend blocks.
Dynamic Summary Arrow shows overall market bias (🢁 / 🢃) based on majority of uptrends/downtrends.
Bold + wide trail plot for the filter value with gradient coloring based on directional bias.
🔵 HOW TO USE
Use the multi-timeframe dashboard to identify aligned trends across your preferred trading horizons.
Confirm trend strength or weakness by observing filter slope direction .
Look for dashboard consensus (e.g., 4 or more timeframes green] ) as confirmation for breakout, continuation, or trend reentry strategies.
Combine with volume or price structure to enhance entry timing.
🔵 CONCLUSION
Two Poles Trend Finder MTF delivers a clean and intuitive trend-following solution with built-in multi-timeframe awareness. Whether you’re trading intra-day or positioning for swing setups, this tool helps filter out market noise and keeps you focused on directional consensus.

AWR Pearsons R & LR Oscillator MTF1. Overview
This indicator is designed to analyze the correlation between a price series (or any custom indicator) and the bar index using Pearson’s correlation coefficient. It performs multiple linear regressions over shifted periods and then aggregates these results to create an oscillator. In addition, it integrates a multi-timeframe (MTF) analysis by retrieving the same calculations on 3 different time intervals, providing a more comprehensive view of the trend evolution.
2. User Parameters
The indicator offers several configurable parameters that allow the user to adjust both the calculations and the display:
Source (Linear Regression): The data source on which the regressions are applied (by default, the closing price).
Number of Linear Regressions (numOfLinReg): Allows choosing the number of correlation calculations (up to 10) to be carried out on different shifted periods.
Start Period (startPeriod) and Period Increment (periodIncrement): These parameters define the reference window for each regression. The calculation starts with a base period and then increases with each regression by a fixed increment, creating several time windows to assess the relationship between price evolution and time progression.
Deviation (def_deviation): Although defined, this parameter is intended to control the sensitivity of the calculations. It can be used in further developments of the indicator.
For Multi Time Frames analysis, three additional timeframes are provided through inputs in addition of the current period:
Sum up :
Timeframe 1 = current
Timeframe 2 = 30-minute (default settings)
Timeframe 3 = 1-hour (default settings)
Timeframe 4 = 4-hour (default settings)
These different timeframes allow you to obtain consistent or divergent signals over multiple resolutions, thereby enhancing the confidence of trading decisions.
3. Calculation Logic
At the core of the indicator is the f_calcConditions() function, which performs several essential tasks:
Calculating Pearson's Coefficients For each linear regression, the script uses ta.correlation() to measure the correlation between the chosen source (for example, the closing price) and the chronological index (bar_index). Up to 10 coefficients are computed over shifted windows, providing an evolving view of the linear relationship over different intervals.
Averaging the Results Once the coefficients are calculated, they are stored in an array and averaged to produce a global correlation value called avgPR_local.
Applying Moving Averages
The resulting average is then smoothed using several moving averages (SMA):
A short-term SMA (period of 14),
An intermediate SMA (period of 100),
A long-term SMA (period of 400).
These moving averages help to highlight the underlying trend of the oscillator by indicating the direction in which the correlation is moving.
Defining Trading Conditions Based on avgPR_local and its associated SMAs, multiple conditions are set to generate buy or sell signals:
Simple SMA Conditions :
Small signal :
Light blue below bar signal :
When the averaged coefficients lie between -1 and -0.63, are above the short-term SMA (14 periods), and are increasing, it may indicate a bullish dynamic (buy signal).
Orange above bar signal :
Conversely, when the value is higher (between 0.63 and 1) and below its SMA (14 periods), and are decreasing the trend is considered bearish (sell signal).
Medium signal :
Dark green signal
When the averaged coefficients lie between -1 and -0.45, are above the short-term SMA (14 periods), and are increasing, and also the average 100 is increasing. It may indicate a bullish dynamic (buy signal).
Light red signal :
Conversely, when the value is higher (between 0.45 and 1) and below its SMA (14 periods), the trend and are decreasing, and also the average 100 is decreasing. It may indicate a bearish dynamic(sell signal).
Light green signal :
When the averaged coefficients lie between -1 and -0.15, are above the short-term SMA (14 periods), and are increasing, and also the average 100 & 400 is increasing . It may indicate a bullish dynamic (buy signal).
Dark red signal :
Conversely, when the value is higher (between 0.45 and 1) and below its SMA (14 periods), the trend and are decreasing, and also the average 100 & 400 is decreasing. It may indicate a bearish dynamic(sell signal).
These additional conditions further refine the signals by verifying the consistency of the movement over longer periods. They check that the trends from the respective averages (intermediate and long-term) are in line with the direction indicated by the initial moving average.
These conditions are designed to capture moments when the oscillator's dynamics change, which can be interpreted as opportunities to enter or exit a trade.
4. Multi-Timeframes and Display
One of the main strengths of this indicator is its multi-timeframe approach.
This offers several advantages:
Comparative Analysis: Compare short-term dynamics with broader trends.
Enhanced Signal Reliability: A signal confirmed across multiple timeframes has a higher probability of success.
To visually highlight these signals on the chart, the indicator uses the plotchar() function with distinct symbols for each timeframe:
Current Timeframe: Signals are represented by the character "1"
30-Minute Timeframe: Displayed with the character "2".
1-Hour Timeframe: Displayed with the character "3".
4-Hour Timeframe: Displayed with the character "4".
The colors used are various shades of green for buy signals and shades of red/orange for sell signals, making it easy to distinguish between the different alerts.
5. Integrated Alerts
To avoid missing any trading opportunities, the indicator includes an alert condition via the alertcondition() function. This alert is triggered if any buy or sell signal is generated on any of the analyzed timeframes. The message "MTF valide" indicates that multiple timeframes are confirming the signal, enabling more informed decision-making.
6. How to Use This Indicator
Installation and Configuration: Copy the script into the TradingView Pine Script editor and add it to your chart. The default parameters can be tuned according to market behavior or personal preferences regarding sensitivity and responsiveness.
Interpreting the Signals:
Watch for the symbols on the chart corresponding to each timeframe.
A buy signal appears as a specific symbol below the bar (indicating a bullish condition based on a rising or less negative correlation), while a sell signal appears above the bar.
Multi-Timeframe Analysis: By comparing signals across timeframes, you can filter out false signals. For example, if the short-term timeframe shows a buy signal but the 4-hour timeframe indicates a bearish trend, you may need to reassess your position.
Adjusting the Settings: Depending on the asset type or market volatility, you might need to tweak the periods (startPeriod, periodIncrement) or the number of linear regressions to generate signals that better align with the price dynamics.
Using Alerts: Activate the built-in alert feature so that TradingView notifies you as soon as a multi-timeframe signal is detected. This ensures you stay informed even if you are not continuously monitoring the chart.
In Conclusion
The AWR Pearsons R & LR Oscillator MTF is a powerful tool for traders seeking a detailed understanding of market trends by combining statistical rigor (via Pearson's correlation coefficient) with a multi-timeframe approach. It is capable of generating clear entry and exit signals, visualized with specific symbols and colors depending on the timeframe. By adjusting the parameters to match your trading strategy and leveraging the alert system, you now have a robust instrument for making well-informed market decisions.
Feel free to dive deeper into each component and experiment with different configurations to see how the oscillator integrates with your overall technical analysis strategy. Enjoy exploring its potential and refining your trading approach!

Support and Resistance MTFSupport and Resistance MTF
Support and Resistance MTF is a powerful tool that automatically detects and visualizes key support and resistance levels based on pivot highs and lows, using a higher timeframe of your choice. It is designed for traders who focus on price action and market structure, and want an adaptive, clean, and customizable indicator that helps identify important market zones.
The script uses configurable pivot logic to identify levels, with user-defined parameters for pivot strength and timeframe. Once a support or resistance level is detected, it is displayed on the chart either as a horizontal line, a shaded box, or both, depending on your display settings. You can fully customize the visual appearance including color, transparency, and line thickness. Levels are automatically extended into the future, and optionally into the past, to give better context.
Each level is monitored for breakout behavior. If price breaks through a level, it can change its role — a former resistance may become support, and vice versa. After a certain number of breakouts (which you define), the level is considered invalid and is automatically removed from the chart. This helps to maintain a clean visual layout and ensures only relevant levels are shown.
The indicator supports multi-timeframe analysis, allowing you to overlay higher-timeframe structure directly on your lower-timeframe trading chart. It is also compatible with Heikin Ashi candles internally for reference, without affecting your main chart type.
Support and Resistance MTF is ideal for traders looking to align intraday setups with higher-timeframe zones, manage risk around structural levels, or simply highlight market turning points in a clear and automated way. Built with Pine Script v5 and optimized for performance, it is both powerful and lightweight.
⚙️ Input Parameters – Description
[Time-Frame
Defines the higher timeframe used for detecting support and resistance levels. For example, you can set this to 1h, 4h, or D to visualize significant levels from a broader market perspective on a lower-timeframe chart.
Left / Right (Pivot Left / Pivot Right)
These parameters control the sensitivity of the pivot detection. A pivot high/low is confirmed if it is higher/lower than the defined number of candles to its left and right. Higher values reduce noise but may miss smaller turning points.
Extend Left
When enabled, the drawn levels (lines and/or boxes) are extended to the left side of the chart, allowing you to see the historical alignment of these levels.
Max Breaks Before Delete
Defines how many times a level can be broken by price before it is removed from the chart. This helps to avoid clutter from outdated or invalidated levels and keeps your chart relevant to current price action.
Draw Lines Only
If enabled, the indicator will draw only horizontal lines for support and resistance zones, omitting the colored background boxes. Useful for a cleaner chart appearance.
Line Width Broken Level
Sets the thickness of the support/resistance lines. Thicker lines can emphasize key levels, especially after a breakout.
Transparency Boxes
Controls the transparency (0–100) of the background boxes representing the zones. A higher value makes the boxes more transparent, lower values make them more opaque.
Transparency Lines
Controls the transparency (0–100) of the horizontal support and resistance lines. This allows for visual fine-tuning based on chart background and personal preference.
Support (Color, Group: Display)
Lets you choose the color used for support zones and lines. By default, it's green, but you can change it to fit your theme or visual preference.
Resistance (Color, Group: Display)
Defines the color for resistance zones and lines. The default is red, but it can be customized freely.

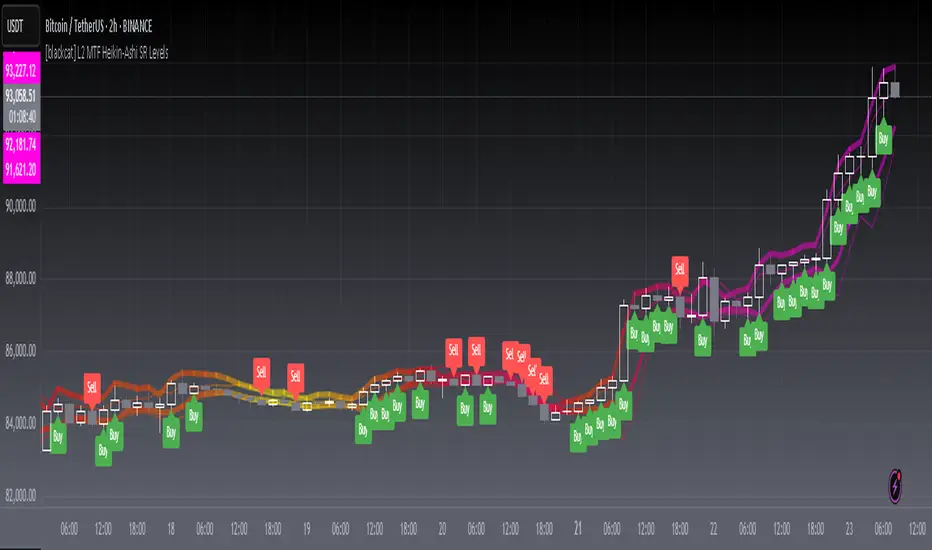
[blackcat] L2 MTF Heikin-Ashi SR LevelsOVERVIEW
The L2 MTF Heikin-Ashi SR Levels indicator is a sophisticated tool designed to help traders identify critical support and resistance levels across multiple timeframes. This script employs Heikin-Ashi candles, which provide a smoothed representation of price action, making it easier to spot trends and reversals. By integrating multi-timeframe analysis, this indicator offers a comprehensive view of market dynamics, enabling traders to make more informed decisions 📊✅.
This indicator not only calculates essential support and resistance levels but also visually represents them on the chart with gradient colors based on Relative Strength Index (RSI) values. Additionally, it features customizable alerts and labels to enhance user experience and ensure timely execution of trades.
FEATURES
Advanced Trend Identification:
Uses Heikin-Ashi candles for smoother price action analysis.
Helps filter out noise and focus on significant trends.
Ideal for both short-term and long-term trading strategies.
Multi-Timeframe Analysis:
Allows users to select different resolutions for deeper insights.
Ensures compatibility with various trading styles and preferences.
Comprehensive Support and Resistance Calculation:
Computes four distinct levels: Support Level 1, Support Level 2, Resistance Level 1, and Resistance Level 2.
Each level serves as a reference point for potential price reversals or continuations.
Gradient Color Visualization:
Employs a spectrum of colors derived from RSI values to represent support and resistance lines.
Enhances readability and helps traders quickly assess market sentiment 🎨.
Dynamic Labels and Alerts:
Automatically generates buy ('Buy') and sell ('Sell') labels when price crosses key levels.
Provides real-time alerts for crossing events, ensuring traders never miss important signals 🔔.
Customizable Parameters:
Offers adjustable Length and Resolution inputs for tailored performance.
Allows traders to fine-tune the indicator according to their unique needs and strategies.
HOW TO USE
Adding the Indicator:
Open your TradingView chart and navigate to the indicators list.
Search for ' L2 MTF Heikin-Ashi SR Levels' and add it to your chart.
Configuring Settings:
Adjust the Length parameter to determine the period over which calculations are made.
A shorter length increases sensitivity, while a longer length smoothens the output.
Choose a specific Resolution to analyze different timeframes simultaneously.
For example, set it to 'D' for daily charts or 'W' for weekly charts.
Interpreting the Chart:
Observe the plotted support and resistance lines on the chart.
Look for price interactions with these levels to identify potential entry and exit points.
Pay attention to the gradient colors, which reflect underlying market momentum.
Setting Up Alerts:
Configure alerts based on the generated signals to receive instant notifications.
Customize alert messages and conditions to suit your trading plan.
Utilizing Labels:
Use the automatically placed buy and sell labels as quick references for decision-making.
Combine these labels with other technical analyses for confirmation.
Backtesting and Optimization:
Thoroughly test the indicator on historical data to evaluate its performance.
Optimize settings and refine your strategy based on backtest results.
Live Trading:
Apply the indicator to live charts and monitor real-time price movements.
Execute trades based on the generated signals and adjust positions accordingly.
Combining with Other Tools:
Integrate this indicator with other technical tools and fundamental analyses for a holistic approach.
Consider using moving averages, oscillators, or volume indicators alongside L2 MTF Heikin-Ashi SR Levels.
LIMITATIONS
Market Volatility:
In highly volatile or ranging markets, the indicator might produce false signals due to erratic price movements 🌪️.
Traders should exercise caution during such periods and consider additional confirmations.
Timeframe Dependency:
The effectiveness of the indicator can vary significantly depending on the chosen timeframe and asset.
Always validate the indicator's performance across different contexts before relying solely on it.
Over-reliance Risk:
While powerful, no single indicator guarantees success in all market conditions.
Combining this tool with other analytical methods enhances reliability and reduces risk.
NOTES
Data Requirements:
Ensure your chart has enough historical data to perform accurate calculations.
Insufficient data may lead to inaccurate or incomplete results.
Demo Testing:
Before deploying the indicator in live trading, conduct extensive testing on demo accounts.
Familiarize yourself with how the indicator behaves under various market scenarios.
Parameter Tuning:
Experiment with different Length and Resolution settings to find what works best for your trading style.
Regularly review and update parameters as market conditions evolve.
Continuous Learning:
Stay updated with the latest developments in technical analysis and trading strategies.
Adapt your use of the indicator based on new insights and experiences.
THANKS
Additionally, gratitude goes to the broader TradingView community for fostering collaboration and knowledge-sharing among traders worldwide. Together, we strive to elevate our understanding and application of financial markets 🌍💡.
Market Structure MTF Trend [Pt]█ Author's Notes
There are numerous market structure indicators in the TradingView library, each offering a unique approach to identifying price action shifts. Market Structure MTF Trend was created with simplicity and flexibility in mind—providing a highly customizable multi-timeframe setup, visually clear trendlines, and straightforward labeling. This combination helps both new and experienced traders easily spot and interpret market structure changes.
█ Overview
Market Structure MTF Trend is a powerful yet user-friendly indicator designed to identify and visualize key turning points in price action. It focuses on two core concepts:
Change of Character (CHoCH): A momentary shift in the market’s behavior, signaling that the current price movement may be losing momentum and could soon reverse.
Break of Structure (BoS): A more definitive event confirming a new price pattern, where the market establishes a fresh trend direction by surpassing previous swing highs or lows.
By combining these signals across up to four different timeframes, even traders unfamiliar with market structure can quickly learn to spot and validate potential trend reversals or continuations.
█ Key Features
Multi-Timeframe Analysis: Monitors CHoCH and BoS events simultaneously on multiple intervals (e.g., 15m, 30m, 60m, 240m), providing a clear, layered understanding of market dynamics.
Straightforward Visual Cues: Labels are placed directly on the chart at swing highs and lows, while colored bars at the bottom give an instant snapshot of whether each timeframe is bullish or bearish.
Configurable Timeframes & Pivot Strength: Easily set up the desired intervals and adjust pivot strength to tune how sensitive the indicator is to minor price fluctuations.
Color-Coded Signals: Different colors help you distinguish between potential early reversals (CHoCH) and confirmed shifts (BoS), ensuring each signal’s importance is immediately clear.
█ Usage & Benefits
Learn Market Structure Basics: For those new to swing highs/lows, CHoCH, and BoS, the script’s on-chart labels and dynamic bar coloring provide a practical, visual way to grasp these concepts.
Spot Reversals Early: CHoCH alerts you to possible shifts in momentum, allowing you to anticipate trend changes before they fully develop.
Confirm Trend Breaks: BoS events confirm that the market has established a new directional bias, reinforcing higher‐probability entry or exit points.
Reduce Noise & Stay Focused: The multi-timeframe setup ensures you won’t overlook larger trends or get lost in smaller fluctuations.
Streamline Decision-Making: Color-coded bars let you gauge overall market sentiment at a glance—ideal for quickly validating trades without juggling multiple charts.
Market Structure MTF Trend is perfect for traders who want to learn or refine their understanding of price action. By integrating multiple timeframes into a single, cohesive interface, this tool highlights both subtle shifts and confirmed breaks in market structure, empowering you to trade with greater insight and confidence.

SSL Channel MTFSSL Channel with MTF support, This eliminates the noise of a basic SSL Channel script which is based on ErwinBeckers SSL Channel. So i have used a Multi Time Frame approach to have a clear confirmation of trend and reduce Noise and False signals unlike basic SSL Channel.
This script can be used to determine.
Support/Resistance
High/Low Breakout
Trend Direction
MA candles for Entry
The high and low sma are plotted as SSL CHANNEL when ever the high and low sma cross each other a direction change is observed.
The direction of SSL channel determines the trend of the price. The length of the channel can be changed as required a low value has a high noise and direction can be determined with low accuracy. Increasing the length of SSL channel has high accuracy trend confirmation.
The MTF SSL Channel uses plot from higher timeframe this helps in using SSL Channel as a Price Action Tool. Price when ever crosses over or below the channel determines a breakout. Price tries to move between the High SMA line and Low SMA Line of the SSL Channel rejection, breakouts can be easily observed on a lower timeframe using SSL Channel Plot from a higher timeframe.
I have used 5min/15min chart with MTF SSL from a 1Hr/4Hr and a length of 5 instead of 10. This helps quick direction changes over a period of 1hr to 4hr. Price is trapped within the High SMA and Low SMA lines of SSL Channel. In addition to SSL High Low and average mid line is plotted to additional reference.
Buy Sell Signals are plotted based on crossover of SMA High and Low.
Candle are Plotted Using a SMA with length of 5. This Candle Plot can be used to make an entry based on direction confirmation of SSL. keep in mind the direction of SSL Plot and the candle must be same. Preferably Entry can made above or below the midline of SSL Channel. The Candle Plot eliminates the Noise of traditional Japanese Candlesticks.
Additionally MACD Crossover and MACD Trend line confirmations can be used to confirm a Buy Sell and Entry signals
Alerts are also plotted accordingly.

Support and Resistance Signals MTF [LuxAlgo]The Support and Resistance Signals MTF indicator aims to identify undoubtedly one of the key concepts of technical analysis Support and Resistance Levels and more importantly, the script aims to capture and highlight major price action movements, such as Breakouts , Tests of the Zones , Retests of the Zones , and Rejections .
The script supports Multi-TimeFrame (MTF) functionality allowing users to analyze and observe the Support and Resistance Levels/Zones and their associated Signals from a higher timeframe perspective.
This script is an extended version of our previously published Support-and-Resistance-Levels-with-Breaks script from 2020.
Identification of key support and resistance levels/zones is an essential ingredient to successful technical analysis.
🔶 USAGE
Support and resistance are key concepts that help traders understand, analyze and act on chart patterns in the financial markets. Support describes a price level where a downtrend pauses due to demand for an asset increasing, while resistance refers to a level where an uptrend reverses as a sell-off happens.
The creation of support and resistance levels comes as a result of an initial imbalance of supply/demand, which forms what we know as a swing high or swing low. This script starts its processing using the swing highs/lows. Swing Highs/Lows are levels that many of the market participants use as a historical reference to place their trading orders (buy, sell, stop loss), as a result, those price levels potentially become and serve as key support and resistance levels.
One of the important features of the script is the signals it provides. The script follows the major price movements and highlights them on the chart.
🔹 Breakouts (non-repaint)
A breakout is a price moving outside a defined support or resistance level, the significance of the breakout can be measured by examining the volume. This script is not filtering them based on volume but provides volume information for the bar where the breakout takes place.
🔹 Retests
Retest is a case where the price action breaches a zone and then revisits the level breached.
🔹 Tests
Test is a case where the price action touches the support or resistance zones.
🔹 Rejections
Rejections are pin bar patterns with high trading volume.
Finally, Multi TimeFrame (MTF) functionality allows users to analyze and observe the Support and Resistance Levels/Zones and their associated Signals from a higher timeframe perspective.
🔶 SETTINGS
The script takes into account user-defined parameters to detect and highlight the zones, levels, and signals.
🔹 Support & Resistance Settings
Detection Timeframe: Set the indicator resolution, the users may examine higher timeframe detection on their chart timeframe.
Detection Length: Swing levels detection length
Check Previous Historical S&R Level: enables the script to check the previous historical levels.
🔹 Signals
Breakouts: Toggles the visibility of the Breakouts, enables customization of the color and the size of the visuals
Tests: Toggles the visibility of the Tests, enables customization of the color and the size of the visuals
Retests: Toggles the visibility of the Retests, enables customization of the color and the size of the visuals
Rejections: Toggles the visibility of the Rejections, enables customization of the color and the size of the visuals
🔹 Others
Sentiment Profile: Toggles the visibility of the Sentiment Profiles
Bullish Nodes: Color option for Bullish Nodes
Bearish Nodes: Color option for Bearish Nodes
🔶 RELATED SCRIPTS
Support-and-Resistance-Levels-with-Breaks
Buyside-Sellside-Liquidity
Liquidity-Levels-Voids

Regression Channel Alternative MTF█ OVERVIEW
This indicator displays 3 timeframes of parallel channel using linear regression calculation to assist manual drawing of chart patterns.
This indicator is not true Multi Timeframe (MTF) but considered as Alternative MTF which calculate 100 bars for Primary MTF, can be refer from provided line helper.
The timeframe scenarios are defined based on Position, Swing and Intraday Trader.
█ INSPIRATIONS
These timeframe scenarios are defined based on Harmonic Trading : Volume Three written by Scott M Carney.
By applying channel on each timeframe, MW or ABCD patterns can be easily identified manually.
This can also be applied on other chart patterns.
█ CREDITS
Scott M Carney, Harmonic Trading : Volume Three (Reaction vs. Reversal)
█ TIMEFRAME EXPLAINED
Higher / Distal : The (next) longer or larger comparative timeframe after primary pattern has been identified.
Primary / Clear : Timeframe that possess the clearest pattern structure.
Lower / Proximate : The (next) shorter timeframe after primary pattern has been identified.
Lowest : Check primary timeframe as main reference.
█ EXAMPLE OF USAGE / EXPLAINATION

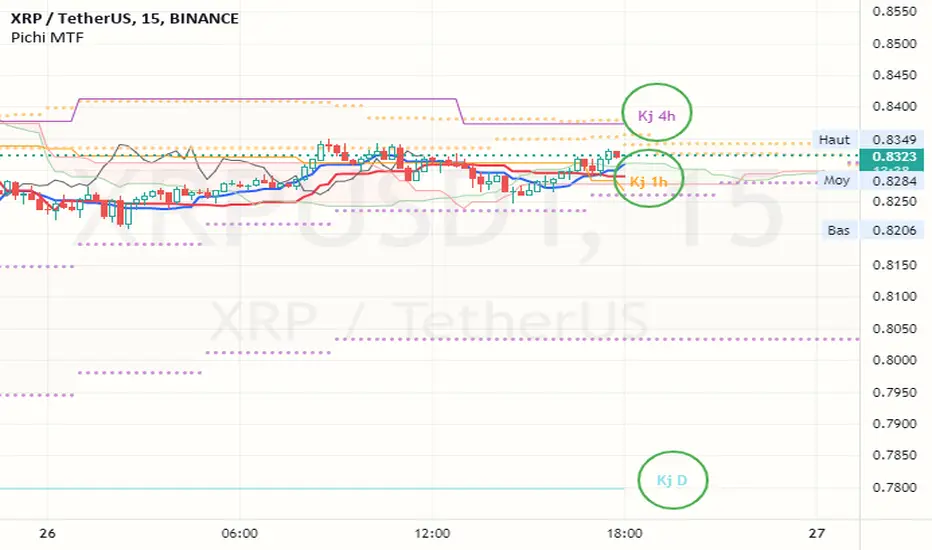
Pax24 MTF IchimokuPax24 Multiple Time Frames and Adaptative Ichimoku Cloud.
(based on the scripts : MTF Selection Framework by PineCoders and MTF ichimoku by anthonyf50)
Possible display :
- four differents Ichimoku, 1 current and 3 from higher UT (depending on your actual UT)
- Tenkan, Kijun, Chikou and Kumo for all
- labels : offset from line, color if you change style and with/without abbreviation
The 3 upper ichimoku you can display depends of your actual Time Frame :
- M1, M3 => M5 M15 H1
- M5 => M15 H1 H4
- M15, M30, M45 => H1 H4 D
- H1, H2, H3 => H4 D W
- H4, H6, H12 => D W M
- D => W M
- W => M
- M => none other
To add the indicator on your graph, go to "Indicators" then search for "Pax24 MTF Ichimoku" and add the script to your favorites.
-------- CONFIGURATION -------
Base : ichimoku numbers
ichimoku and +1 +2 +3 : Show the first ichimoku (actual UT) and 3 others (higher UT)
for each :
Tenkan : Show the Tenkan
Kijun : Show the Kijun
Chikou : Show the Chikou (Lagging span)
Kumo : Show the Kumo
Label : Show the labels
Offset : Label offset
Color : Label color (because you can't change the style of the label in "Style")
Abbreviation : Label abbreviation (Tk = Tenkan)
If you want to best see others UT kumo, change transparency in style for Kumo
There may be slow display since TradingView requires a minimum of candles to make these calculations. Just zoom out and then zoom in to fix the problem (especially for kumo).
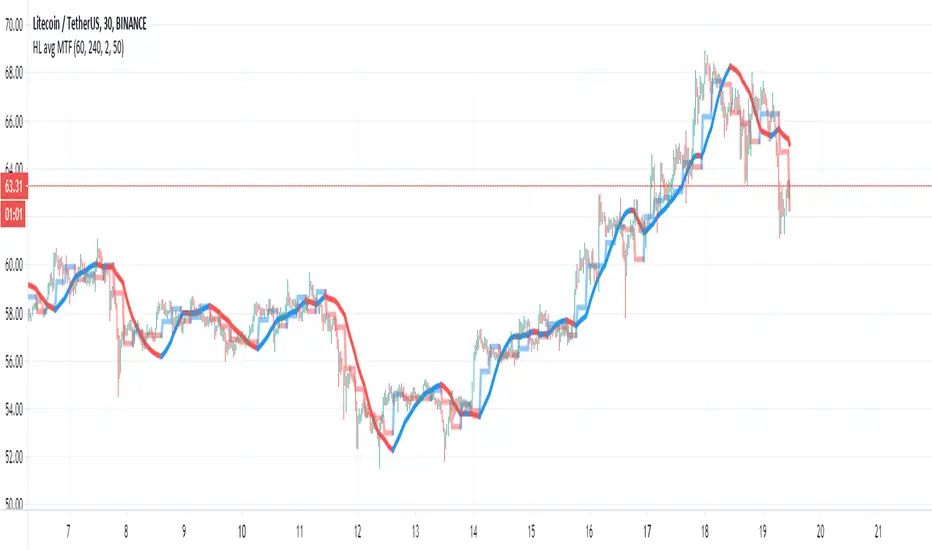
HL avg MTFThis indicator try to find trends more accurate
So first step is to make candle MTF and to find the average of high and low of the MTF candle. I think a ratio of 4/1 is good .
so this seen in the lime /red line
after we take this line and transform it to linear regression type . I use here 50 candle size seen in blue line
if close are above the blue line then we are above the avg of the high and low of the mtf candle .. this indicate a positive trend. if we close is bellow the blue line then it a negative trend and it good time to short it .
also very important is the direction of the blue line as it give us the direction of the trend
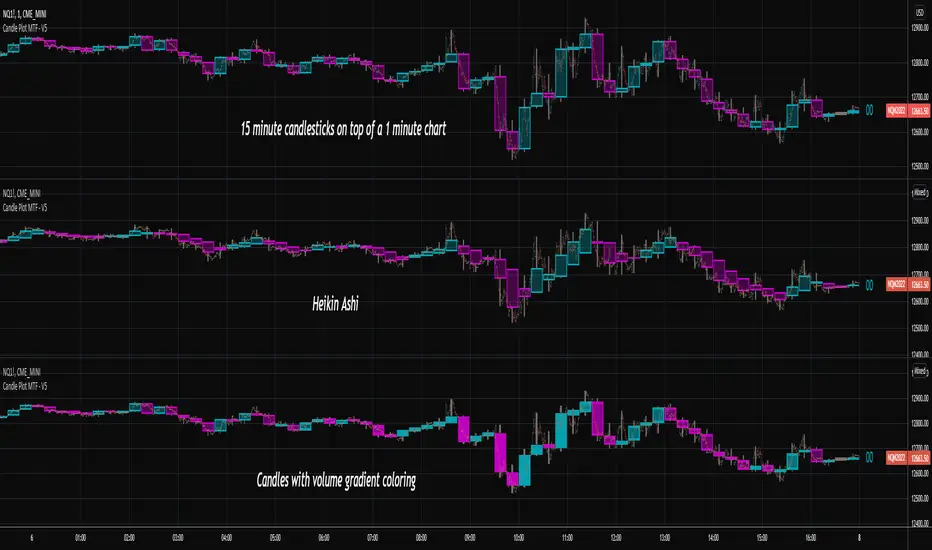
Candlestick Plot MTFPlots the live non-repainting candles for a higher time interval than the chart interval.
Features:
Configuration of the look and feel of the MTF candles.
Live candles update as the price action evolves for the session.
Historical candles can be toggled on/off.
Includes a moving average ribbon that is also MTF, matching the interval chosen.
Please watch this video to understand more:
RSI Shaded - MTF
Non-repainting multiple time frame RSI with shading of overbought and oversold levels.
Includes option for simple moving average smooth of the RSI (Larry Connors)
Includes option to plot the EMA of the RSI
Related to RSI Shaded .
For other multiple time frame indicators see:
Adaptive ATR-ADX Trend
Fisher Transform MTF
ADX-DI MTF
Laguerre RSI MTF
[OZ]MTF Ichimoku CloudBased on this script from RicardoSantos:
This script can display Ichimoku cloud , SSA , SSB , Chikou, Kijun and Tenkan from another time frame.
With it you can apply Karen Péloille's MTF Ichimoku Kinko Hyo advanced trading techniques on TradingView.
By default Tenkan is not displayed (fully transparent).
The original script has been enhanced to draw the full cloud beyond the price and to draw the Chikou.

SMA/WMA histogram with MTF and alertsThis histogram is based on the difference between SMA and WMA (I make it as false MACD to create signals)
Since we have the non repainting MTF function we can see the buy and the sell signals at different time frames.
the color of the histo change according to difference so as the color change from dark red to light red be ready to buy and if color change from dark green to light green be ready to sell. The signal based on cross to the 0 .
since you have MTF in build you can change time frame changing int2 to desire min you want
here 60 min MTF on 30 min graph. you can make any variation you want .it flexible model allow you to find the best setting for your purpose

modified DMI with MTF and alertsThis is special indicator based on DMI , I add to time length MTF that is not repainting
you can change the MTF using int2 function
the alerts are based on crossing the 0 (up or down)
I hope you like it
with no MTF
