MTF Stoch RSI + Realtime DivergencesMulti-timeframe Stochastic RSI + Realtime Divergences + Alerts + Pivot lookback periods.
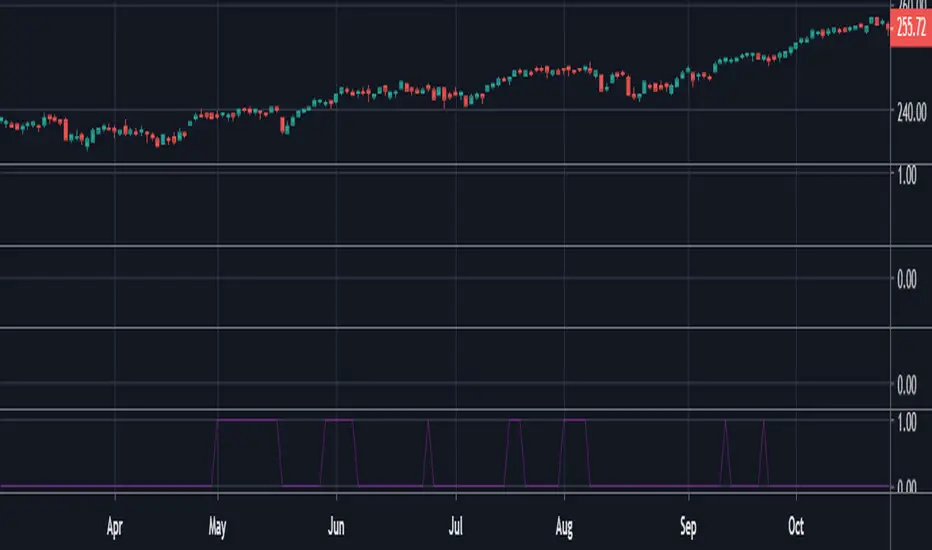
This version of the Stochastic RSI adds the following additional features to the stock UO by Tradingview:
- Optional 3 x Multiple-timeframe overbought and oversold signals, indicating where 3 selected timeframes are all overbought (>80) or all oversold (<20) at the same time, with alert option.
- Optional divergence lines drawn directly onto the oscillator in realtime, with alert options.
- Configurable lookback periods to fine tune the divergences drawn in order to suit different trading styles and timeframes, including the ability to enable automatic adjustment of pivot period per chart timeframe.
- Alternate timeframe feature allows you to configure the oscillator to use data from a different timeframe than the chart it is loaded on.
- Indications where the Stoch RSI is crossing down from above the overbought threshold (<80) and crossing above the oversold threshold (>20) levels on a given user selected timeframe, by printing gold dots on the indicator.
- Also includes standard configurable Stoch RSI options, including k length, d length, RSI length, Stochastic length, and source type (close, hl2, etc)
While this version of the Stochastic RSI has the ability to draw divergences in realtime along with related settings and alerts so you can be notified as divergences occur without spending all day watching the charts, the main purpose of this indicator was to provide the triple multiple-timeframe overbought and oversold confluence signals and alerts, in an attempt to add more confluence, weight and reliability to the single timeframe overbought and oversold states, commonly used for trade entry confluence. It's primary purpose is intended for scalping on lower timeframes, typically between 1-15 minutes. The triple timeframe overbought can often indicate near term reversals to the downside, with the triple timeframe oversold often indicating neartime reversals to the upside. The default timeframes for this confluence are set to check the 1 minute, 5 minute, and 15 minute timeframes, ideal for scalping the < 15 minute charts.
The Stochastic RSI
The popular oscillator has been described as follows:
“The Stochastic RSI is an indicator used in technical analysis that ranges between zero and one (or zero and 100 on some charting platforms) and is created by applying the Stochastic oscillator formula to a set of relative strength index (RSI) values rather than to standard price data. Using RSI values within the Stochastic formula gives traders an idea of whether the current RSI value is overbought or oversold. The Stochastic RSI oscillator was developed to take advantage of both momentum indicators in order to create a more sensitive indicator that is attuned to a specific security's historical performance rather than a generalized analysis of price change.”
How do traders use overbought and oversold levels in their trading?
The oversold level, that is when the Stochastic RSI is above the 80 level is typically interpreted as being 'overbought', and below the 20 level is typically considered 'oversold'. Traders will often use the Stochastic RSI at an overbought level as a confluence for entry into a short position, and the Stochastic RSI at an oversold level as a confluence for an entry into a long position. These levels do not mean that price will necessarily reverse at those levels in a reliable way, however. This is why this version of the Stoch RSI employs the triple timeframe overbought and oversold confluence, in an attempt to add a more confluence and reliability to this usage of the Stoch RSI.
What are divergences?
Divergence is when the price of an asset is moving in the opposite direction of a technical indicator, such as an oscillator, or is moving contrary to other data. Divergence warns that the current price trend may be weakening, and in some cases may lead to the price changing direction.
There are 4 main types of divergence, which are split into 2 categories;
regular divergences and hidden divergences. Regular divergences indicate possible trend reversals, and hidden divergences indicate possible trend continuation.
Regular bullish divergence: An indication of a potential trend reversal, from the current downtrend, to an uptrend.
Regular bearish divergence: An indication of a potential trend reversal, from the current uptrend, to a downtrend.
Hidden bullish divergence: An indication of a potential uptrend continuation.
Hidden bearish divergence: An indication of a potential downtrend continuation.
Setting alerts.
With this indicator you can set alerts to notify you when any/all of the above types of divergences occur, on any chart timeframe you choose, and also when the triple timeframe overbought and oversold confluences occur.
Configurable pivot lookback values.
You can adjust the default pivot lookback values to suit your prefered trading style and timeframe. If you like to trade a shorter time frame, lowering the default lookback values will make the divergences drawn more sensitive to short term price action. By default, this indicator has enabled the automatic adjustment of the pivot periods for 4 configurable timeframes, in a bid to optimise the divergences drawn when the indicator is loaded onto any of the 4 timeframes. These timeframes and the auto adjusted pivot periods on each of them can also be reconfigured within the settings menu.
How do traders use divergences in their trading?
A divergence is considered a leading indicator in technical analysis , meaning it has the ability to indicate a potential price move in the short term future.
Hidden bullish and hidden bearish divergences, which indicate a potential continuation of the current trend are sometimes considered a good place for traders to begin, since trend continuation occurs more frequently than reversals, or trend changes.
When trading regular bullish divergences and regular bearish divergences, which are indications of a trend reversal, the probability of it doing so may increase when these occur at a strong support or resistance level . A common mistake new traders make is to get into a regular divergence trade too early, assuming it will immediately reverse, but these can continue to form for some time before the trend eventually changes, by using forms of support or resistance as an added confluence, such as when price reaches a moving average, the success rate when trading these patterns may increase.
Typically, traders will manually draw lines across the swing highs and swing lows of both the price chart and the oscillator to see whether they appear to present a divergence, this indicator will draw them for you, quickly and clearly, and can notify you when they occur.
Disclaimer: This script includes code from the stock UO by Tradingview as well as the Divergence for Many Indicators v4 by LonesomeTheBlue.
在腳本中搜尋"oscillator"

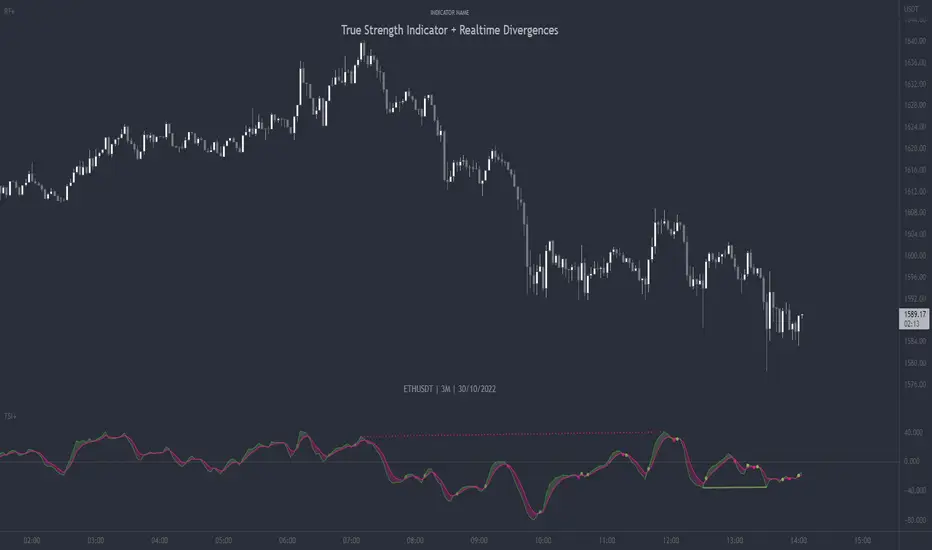
True Strength Indicator + Realtime DivergencesTrue Strength Indicator (TSI) + Realtime Divergences + Alerts + Lookback periods.
This version of the True Strength Indicator adds the following 5 additional features to the stock TSI by Tradingview:
- Optional divergence lines drawn directly onto the oscillator in realtime.
- Configurable alerts to notify you when divergences occur, as well as when the TSI and lagline bands crossover one another, when the oscillator begins heading up, or heading down.
- Configurable lookback periods to fine tune the divergences drawn in order to suit different trading styles and timeframes.
- Background colouring option to indicate when the two TSI bands, the TSI line and the TSI lagline, have crossed one another, either moving upwards or downwards, or optionally when the two TSI bands have crossed upwards and an external oscillator, which can be linked via the settings, has crossed above its centerline, and the TSI bands have crossed downwards and the external oscillator has crossed below its centerline.
- Alternate timeframe feature allows you to configure the oscillator to use data from a different timeframe than the chart it is loaded on.
This indicator adds additional features onto the stock TSI by Tradingview, whose core calculations remain unchanged, although this version has different settings as default to suit a shorter time period (it uses 6, 13, 4 by default, whereas the stock TSI typically ships with higher values, e.g. 25, 13, 13). Namely the configurable option to automatically, quickly and clearly draw divergence lines onto the oscillator for you as they occur in realtime. It also has the addition of unique alerts, so you can be notified when divergences occur without spending all day watching the charts. Furthermore, this version of the TSI comes with configurable lookback periods, which can be configured in order to adjust the sensitivity of the divergences, in order to suit shorter or higher timeframe trading approaches.
The True Strength Indicator
Tradingview describes the True Strength Indicator as follows:
“The True Strength Index (TSI) is a momentum oscillator that ranges between limits of -100 and +100 and has a base value of 0. Momentum is positive when the oscillator is positive (pointing to a bullish market bias) and vice versa. It was developed by William Blau and consists of 2 lines: the index line and an exponential moving average of the TSI, called the signal line. Traders may look for any of the following 5 types of conditions: overbought, oversold, centerline crossover, divergence and signal line crossover. The indicator is often used in combination with other signals..”
What are divergences?
Divergence is when the price of an asset is moving in the opposite direction of a technical indicator, such as an oscillator, or is moving contrary to other data. Divergence warns that the current price trend may be weakening, and in some cases may lead to the price changing direction.
There are 4 main types of divergence, which are split into 2 categories;
regular divergences and hidden divergences. Regular divergences indicate possible trend reversals, and hidden divergences indicate possible trend continuation.
Regular bullish divergence: An indication of a potential trend reversal, from the current downtrend, to an uptrend.
Regular bearish divergence: An indication of a potential trend reversal, from the current uptrend, to a downtrend.
Hidden bullish divergence: An indication of a potential uptrend continuation.
Hidden bearish divergence: An indication of a potential downtrend continuation.
Setting alerts.
With this indicator you can set alerts to notify you when any/all of the above types of divergences occur, on any chart timeframe you choose.
Configurable lookback values.
You can adjust the default lookback values to suit your prefered trading style and timeframe. If you like to trade a shorter time frame, lowering the default lookback values will make the divergences drawn more sensitive to short term price action.
How do traders use divergences in their trading?
A divergence is considered a leading indicator in technical analysis , meaning it has the ability to indicate a potential price move in the short term future.
Hidden bullish and hidden bearish divergences, which indicate a potential continuation of the current trend are sometimes considered a good place for traders to begin, since trend continuation occurs more frequently than reversals, or trend changes.
When trading regular bullish divergences and regular bearish divergences, which are indications of a trend reversal, the probability of it doing so may increase when these occur at a strong support or resistance level . A common mistake new traders make is to get into a regular divergence trade too early, assuming it will immediately reverse, but these can continue to form for some time before the trend eventually changes, by using forms of support or resistance as an added confluence, such as when price reaches a moving average, the success rate when trading these patterns may increase.
Typically, traders will manually draw lines across the swing highs and swing lows of both the price chart and the oscillator to see whether they appear to present a divergence, this indicator will draw them for you, quickly and clearly, and can notify you when they occur.
Disclaimer: This script includes code from the stock TSI by Tradingview as well as the Divergence for Many Indicators v4 by LonesomeTheBlue
XAGUSD Long/Short Signal ~ By: Sarp GokdagAbout the Oscillator :
The Rex Oscillator is a study that measures market behavior based on the relationship of the close to the open, high and low values of the same bar. The theory behind the Rex Oscillator is that a big difference between the high and close on a bar indicates weakness. Conversely, wide disparity between the low and close indicates strength. The difference between open and close also indicates market performance.
The True Value of a Bar (TVB) gives us an indication of how healthy the market is. It is possible to have a negative close and a positive TVB, and vice versa. This indicates that the market is building strength on the opposing side of the trend. The Rex Oscillator is a moving average of the TVB, indicating the inertia of the market. When the Rex Oscillator turns positive in a bearish trend, a reversal is indicated. Likewise, Rex turning negative in a bull market indicates a reversal to the downside.
When the Rex Oscillator turns positive in a bearish trend, a reversal is indicated. Likewise, Rex turning negative in a bull market indicates a reversal to the downside.
The REX Strategy goes long when the REX line of the REX Oscillator crosses above the Signal line and Short when the REX line crosses below the Signal line. The strategy is a reversal strategy through the use of the 'Cover and go Long' and 'Close and go Short' Actions. The REX Oscillator properties of Period' and Signal' can be changed for testing purposes using the available Rex1 'Factor.'
The blue line indicates the difference between the Rex MA and the Signal.
If the blue line crosses above "0", go Long.
If the blue line crosses below "0", go Short.
To achieve best results from this strategy, set your chart range minimum 4hrs, max 1 Day.
The above references an opinion and is for information purposes only. It is not intended to be investment advice. Seek a duly licensed professional for investment advice.

Combo Strategy 123 Reversal & DynamoThis is combo strategies for get a cumulative signal.
First strategy
This System was created from the Book "How I Tripled My Money In The
Futures Market" by Ulf Jensen, Page 183. This is reverse type of strategies.
The strategy buys at market, if close price is higher than the previous close
during 2 days and the meaning of 9-days Stochastic Slow Oscillator is lower than 50.
The strategy sells at market, if close price is lower than the previous close price
during 2 days and the meaning of 9-days Stochastic Fast Oscillator is higher than 50.
Second strategy
In July 1996 Futures magazine, E. Marshall Wall introduces the
Dynamic Momentum Oscillator (Dynamo). Please refer to this article
for interpretation.
The Dynamo oscillator is a normalizing function which adjusts the
values of a standard oscillator for trendiness by taking the difference
between the value of the oscillator and a moving average of the oscillator
and then subtracting that value from the oscillator midpoint.
WARNING:
- For purpose educate only
- This script to change bars colors.

MTF Stochastic RSIOverview: MTF Stochastic RSI
is a momentum-tracking tool that plots the Stochastic RSI oscillator for up to four user-
defined timeframes on a single panel. It provides a compact yet powerful view of how
momentum is aligning or diverging across different timeframes, making it suitable for both
scalpers and swing traders looking for multi-timeframe confirmation.
What it does:
Calculates Stochastic RSI values using the RSI of price as the base input and applies
smoothing for stability.
Aggregates and displays the values for four customizable TF (e.g., 5min, 15min, 1h, 4h).
Highlights potential support and resistance zones in the oscillator space using adaptive zone
logic.
Optionally draws dynamic support/resistance zone lines in the oscillator space based on
historical turning points.
How it works:
Each timeframe uses the same RSI and Stoch calculation settings but runs independently via
the request.security() function.
Stochastic RSI is calculated by first applying the RSI to price, then applying a stochastic
formula on the RSI values, and finally smoothing the %K output.
Adaptive overbought and oversold thresholds adjust based on ATR-based volatility and simple
trend filtering (e.g., price vs EMA).
When a crossover above the oversold zone or a crossunder below the overbought zone
occurs, the script checks for proximity to previously stored zones and either adjusts or
records a new one.
These zones are stored and re-plotted as dotted support/resistance levels within the
oscillator space.
What it’s based on:
The indicator builds upon traditional Stochastic RSI by applying it to multiple timeframes in
parallel.
Zone detection logic is inspired by the idea of oscillator-based support/resistance levels.
Volatility-adjusted thresholds are based on ATR (Average True Range) to make the
overbought/oversold zones responsive to market conditions.
How to use it:
Look for alignment across timeframes (e.g., all four curves pushing into the overbought
region suggests strong trend continuation).
Reversal risk increases when one or more higher timeframes are diverging or showing signs of
cooling while lower timeframes are still extended.
Use the zone lines as soft support/resistance references within the oscillator—retests of
these zones can indicate strong reversal opportunities or continuation confirmation.
This script is provided for educational and informational purposes only. It does not constitute financial advice, trading recommendations, or an offer to buy or sell any financial instrument. Always perform your own due diligence, use proper risk management, and consult a qualified financial professional before making any trading decisions. Past performance does not guarantee future results. Use this tool at your own discretion and risk.

Xmaster Formula Indicator [TradingFinder] No Repaint Strategies🔵 Introduction
The Xmaster Formula Indicator is a powerful tool for forex trading, combining multiple technical indicators to provide insights into market trends, support and resistance levels, and price reversals. Developed in the early 2010s, it is widely valued for generating reliable buy and sell signals.
Key components include Exponential Moving Averages (EMA) for identifying trends and price momentum, and MACD (Moving Average Convergence Divergence) for analyzing trend strength and direction.
The Stochastic Oscillator and RSI (Relative Strength Index) enhance accuracy by signaling potential price reversals. Additionally, the Parabolic SAR assists in identifying trend reversals and managing risk.
By integrating these tools, the Xmaster Formula Indicator provides a comprehensive view of market conditions, empowering traders to make informed decisions.
🔵 How to Use
The Xmaster Formula Indicator offers two distinct methods for generating signals: Standard Mode and Advance Mode. Each method caters to different trading styles and strategies.
Standard Mode :
In Standard Mode, the indicator uses normalized moving average data to generate buy and sell signals. The difference between the short-term (10-period) and long-term (38-period) EMAs is calculated and normalized to a 0-100 scale.
Buy Signal : When the normalized value crosses above 55, accompanied by the trend line turning green, a buy signal is generated.
Sell Signal : When the normalized value crosses below 45, and the trend line turns red, a sell signal is issued.
This mode is simple, making it ideal for traders looking for straightforward signals without the need for additional confirmations.
Advance Mode :
Advance Mode combines multiple technical indicators to provide more detailed and robust signals.
This method analyzes trends by incorporating :
🟣 MACD
Buy Signal : When the MACD histogram bars are positive.
Sell Signal : When the MACD histogram bars are negative.
🟣 RSI
Buy Signal : When RSI is below 30, indicating oversold conditions.
Sell Signal : When RSI is above 70, suggesting overbought conditions.
🟣 Stochastic Oscillator
Buy Signal : When Stochastic is below 20.
Sell Signal : When Stochastic is above 80.
🟣 Parabolic SAR
Buy Signal : When SAR is below the price.
Sell Signal : When SAR is above the price.
A signal is generated in Advance Mode only when all these indicators align :
Buy Signal : All conditions point to a bullish trend.
Sell Signal : All conditions indicate a bearish trend.
This mode is more comprehensive and suitable for traders who prefer deeper analysis and stronger confirmations before executing trades.
🔵 Settings
Method :
Choose between "Standard" and "Advance" modes to determine how signals are generated. In Standard Mode, signals are based on normalized moving average data, while in Advance Mode, signals rely on the combination of MACD, RSI, Stochastic Oscillator, and Parabolic SAR.
Moving Average Settings :
Short Length : The period for the short-term EMA (default is 10).
Mid Length : The period for the medium-term EMA (default is 20).
Long Length : The period for the long-term EMA (default is 38).
MACD Settings :
Fast Length : The period for the fast EMA in the MACD calculation (default is 12).
Slow Length : The period for the slow EMA in the MACD calculation (default is 26).
Signal Line : The signal line period for MACD (default is 9).
Stochastic Settings :
Length : The period for the Stochastic Oscillator (default is 14).
RSI Settings :
Length : The period for the Relative Strength Index (default is 14).
🔵 Conclusion
The Xmaster Formula Indicator is a versatile and reliable tool for forex traders, offering both simplicity and advanced analysis through its Standard and Advance modes. In Standard Mode, traders benefit from straightforward signals based on normalized moving average data, making it ideal for quick decision-making.
Advance Mode, on the other hand, provides a more detailed analysis by combining multiple indicators like MACD, RSI, Stochastic Oscillator, and Parabolic SAR, delivering stronger confirmations for critical market decisions.
While the Xmaster Formula Indicator offers valuable insights and reliable signals, it is important to use it alongside proper risk management and other analytical methods. By leveraging its capabilities effectively, traders can enhance their trading strategies and achieve better outcomes in the dynamic forex market.

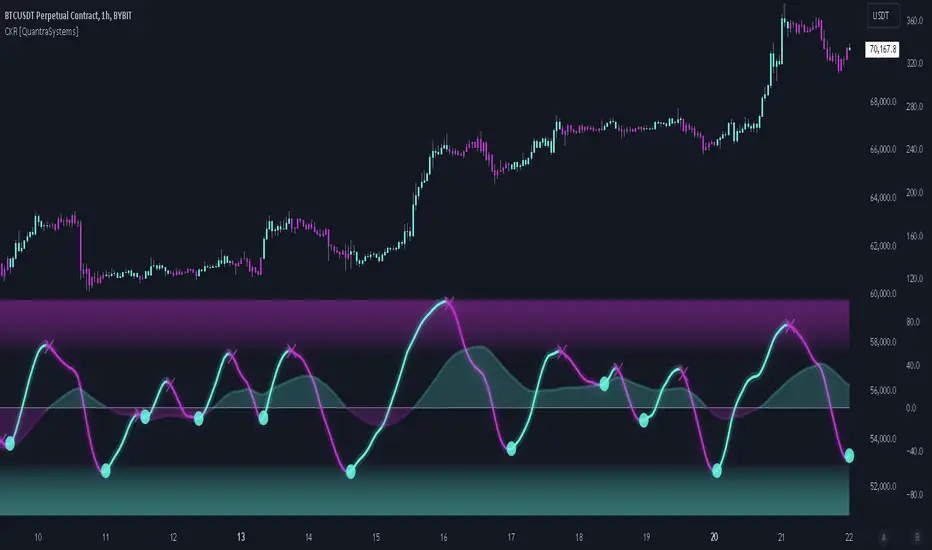
Cosine Kernel Regressions [QuantraSystems]Cosine Kernel Regressions
Introduction
The Cosine Kernel Regressions indicator (CKR) uses mathematical concepts to offer a unique approach to market analysis. This indicator employs Kernel Regressions using bespoke tunable Cosine functions in order to smoothly interpret a variety of market data, providing traders with incredibly clean insights into market trends.
The CKR is particularly useful for traders looking to understand underlying trends without the 'noise' typical in raw price movements. It can serve as a standalone trend analysis tool or be combined with other indicators for more robust trading strategies.
Legend
Fast Trend Signal Line - This is the foreground oscillator, it is colored upon the earliest confirmation of a change in trend direction.
Slow Trend Signal Line - This oscillator is calculated in a similar manner. However, it utilizes a lower frequency within the cosine tuning function, allowing it to capture longer and broader trends in one signal. This allows for tactical trading; the user can trade smaller moves without losing sight of the broader trend.
Case Study
In this case study, the CKR was used alongside the Triple Confirmation Kernel Regression Oscillator (KRO)
Initially, the KRO indicated an oversold condition, which could be interpreted as a signal to enter a long position in anticipation of a price rebound. However, the CKR’s fast trend signal line had not yet confirmed a positive trend direction - suggesting that entering a trade too early and without confirmation could be a mistake.
Waiting for a confirmed positive trend from the CKR proved beneficial for this trade. A few candles after the oversold signal, the CKR's fast trend signal line shifted upwards, indicating a strong upward momentum. This was the optimal entry point suggested by the CKR, occurring after the confirmation of the trend change, which significantly reduced the likelihood of entering during a false recovery or continuation of the downtrend.
This is one of the many uses of the CKR - by timing entries using the fast signal line , traders could avoid unnecessary losses by preventing premature entries.
Methodology
The methodology behind CKR is a multi-layered approach and utilizes many ‘base’ indicators.
Relative Strength Index
Stochastic Oscillator
Bollinger Band Percent
Chande Momentum Oscillator
Commodity Channel Index
Fisher Transform
Volume Zone Oscillator
The calculated output from each indicator is standardized and scaled before being averaged. This prevents any single indicator from overpowering the resulting signal.
// ╔════════════════════════════════╗ //
// ║ Scaling/Range Adjustment ║ //
// ╚════════════════════════════════╝ //
RSI_ReScale (_res ) => ( _res - 50 ) * 2.8
STOCH_ReScale (_stoch ) => ( _stoch - 50 ) * 2
BBPCT_ReScale (_bbpct ) => ( _bbpct - 0.5 ) * 120
CMO_ReScale (_chandeMO ) => ( _chandeMO * 1.15 )
CCI_ReScale (_cci ) => ( _cci / 2 )
FISH_ReScale (_fish1 ) => ( _fish1 * 30 )
VZO_ReScale (_VP, _TV ) => (_VP / _TV) * 110
These outputs are then fed into a customized cosine kernel regression function, which smooths the data, and combines all inputs into a single coherent output.
// ╔════════════════════════════════╗ //
// ║ COSINE KERNEL REGRESSIONS ║ //
// ╚════════════════════════════════╝ //
// Define a function to compute the cosine of an input scaled by a frequency tuner
cosine(x, z) =>
// Where x = source input
// y = function output
// z = frequency tuner
var y = 0.
y := math.cos(z * x)
Y
// Define a kernel that utilizes the cosine function
kernel(x, z) =>
var y = 0.
y := cosine(x, z)
math.abs(x) <= math.pi/(2 * z) ? math.abs(y) : 0. // cos(zx) = 0
// The above restricts the wave to positive values // when x = π / 2z
The tuning of the regression is adjustable, allowing users to fine-tune the sensitivity and responsiveness of the indicator to match specific trading strategies or market conditions. This robust methodology ensures that CKR provides a reliable and adaptable tool for market analysis.
Advanced Stochastic [CryptoSea]The Advanced Stochastic Indicator is a sophisticated tool designed to enhance market analysis through detailed stochastic calculations. This tool is built for traders who seek to identify market divergences and pivot points with higher accuracy.
Key Features
Multi-Layer Stochastic Analysis: Tracks both standard and smoothed stochastic values to provide a granular view of market momentum.
Divergence Detection: Automatically detects both regular and hidden bullish and bearish divergences, offering critical insights into potential market reversals.
Adaptive Oscillator Display: Features customizable display options for the stochastic oscillator, allowing traders to view data in Default, Histogram, or Both modes.
Customizable Lookback Periods: Users can set specific lookback periods for divergence analysis and stochastic calculations, tailoring the tool to fit various trading strategies.
In the example below, there is a bearish divergence above 0. You would first want the stoch to break below the 0 level as a show of strength, this would be an aggressive entry, a higher probability option would be to wait for the stoch to retest and reject from 0 which is what we have a few candles later.
How it Works
Stochastic Calculation: Computes the stochastic oscillator by smoothing the %K line over a user-defined period, then applying a second smoothing for the %D line.
Pivot Point Analysis: Utilizes advanced algorithms to find low and high pivot points based on the oscillator values, crucial for spotting trend reversals.
Colour-Coded Divergence Alerts: Utilizes color codes to highlight divergence signals directly on the chart, aiding in quick visual analysis.
Responsive Threshold Settings: Includes options to adjust the sensitivity of divergence detection, ensuring that only significant divergences are highlighted.
In the example below, we have 2 divergence signals. The first a bullish one which fails to break above 0. The second signal is given above 0 so you would want a retest and a show of strength when the stoch returns to 0 but it fails to hold. Both of these divergence signals are invalidated.
Application
Strategic Decision-Making: Assists traders in making informed decisions by providing detailed analysis of stochastic movements and divergence.
Trend Confirmation: Reinforces trading strategies by confirming potential reversals with pivot point detection and divergence analysis.
Customized Analysis: Adapts to various trading styles with extensive input settings that control the display and sensitivity of oscillator data.
The Advanced Stochastic Indicator by is an invaluable addition to a trader's toolkit, offering depth and precision in market trend analysis to navigate complex market conditions effectively.

Stocastic Reference Dinoa technical analysis indicator named "Stocastic Reference Dino," which is a stochastic oscillator used to analyze market trends and potential price reversals.
Key Features:
Inputs:
K Period (lengthK): Defines the period for the %K line calculation (default 13).
D Period (lengthD): Defines the period for the %D line calculation (default 9).
Smoothing Period (smoothK): Smoothing period for the %K line (default 8).
Low Threshold (lowThreshold): Lower bound threshold for the oscillator (default 10).
High Threshold (highThreshold): Upper bound threshold for the oscillator (default 80).
%K Line Calculation:
Calculates the lowest low and highest high over the lengthK period.
Computes the %K value and smooths it using a simple moving average over smoothK periods.
%D Line Calculation:
Calculates the %D line as a simple moving average of the %K line over the lengthD period.
Plotting:
Plots the %K line in blue and the %D line in red on a new pane.
Adds horizontal lines to represent the low and high thresholds, colored green and red, respectively.
This indicator helps traders identify potential overbought and oversold conditions by analyzing the stochastic oscillator lines (%K and %D) relative to the defined thresholds.

Stochastic Trend Evaluator (STE)Stochastic Trend Evaluator (STE): Detailed Description
Overview :
The Stochastic Trend Evaluator (STE) is a sophisticated trading tool designed for TradingView that combines stochastic oscillation analysis with Exponential Moving Average (EMA) trends. It is tailored to assist traders in identifying potential buy and sell opportunities in various market conditions, particularly focusing on trend reversals and momentum shifts.
Functionality & Concept :
The STE is built on two core components – the Stochastic Oscillator and the 200-period EMA.
Stochastic Oscillator :
This oscillator is a momentum indicator comparing a particular closing price of a security to a range of its prices over a certain period.
Settings:
- %K Length: 14
- %K Smoothing: 3
- %D Smoothing: 3
The %K line is the main line indicating momentum, while the %D line is a moving average of %K, providing signal triggers.
200 EMA :
The 200-period EMA serves as a dynamic trend indicator.
It helps in distinguishing between bullish and bearish market phases.
A closing price above the 200 EMA suggests a bullish trend, while below it indicates a bearish trend.
Signal Generation :
STE generates signals based on the interaction between the Stochastic Oscillator and the 200 EMA.
Buy Signal :
Occurs when the stochastic %K crosses above 20 (indicative of oversold conditions), and the closing price is above the 200 EMA.
Represented visually by green label-up arrows.
Sell Signal :
Triggered when the stochastic %K crosses below 80 (suggestive of overbought conditions), and the closing price is below the 200 EMA.
Indicated by red label-down arrows.
Background Color Indicator :
The background color of the chart changes to enhance visual interpretation of the market condition.
Green background for a bullish market scenario (when a buy signal is active).
Red background for a bearish market scenario (when a sell signal is active).
Usage Guidelines :
The STE is best used in markets that exhibit clear trends.
Ideal for traders focusing on medium to long-term trade setups.
Can be used in conjunction with other indicators for confirmation and risk management.
Note : The STE, being a proprietary tool, is based on a unique blend of standard technical analysis concepts and custom logic to provide these trading signals. It is designed to give traders a comprehensive view of the market momentum and trend strength without revealing the intricate details of its algorithm.

Oscillator overlayHi all!
This script is useful in the way that it let's you see an oscillator value on the chart, as an overlay. As of now you can choose from displaying Money Flow Index (MFI) (www.tradingview.com), Relative Strength Index (RSI) (www.tradingview.com) or Stochastic (www.tradingview.com). The size of the area, where the oscillator value is shown, is determined by a factor of the Average True Range (ATR), that defaults to 2 (the 'ATR factor' setting). Oscillator pivots (of user defined length in the 'Length' setting) and oscillator pivot values)ä can be shown and the background can change when the oscillator value crosses oversold/overbought. The value from the hidden plot "Value (for alerts)" can be used for setting alerts on oscillator values, e.g. crossings. The length and overbought/oversold values can be set by the user as a setting.
Best of trading luck!

ATR OSC and Volume Screener (ATROSCVS)In today's world of trading, having the right tools and indicators can make all the difference. With the vast number of cryptocurrencies available, I've found it challenging to keep track of the market's overall direction and make informed decisions. That's where the ATR OSC and Volume Screener comes in, a powerful Pine Script that I use to identify potential trading opportunities across multiple cryptocurrencies, all in one convenient place.
This script combines two essential components: the ATR Oscillator (ATR OSC) and a Volume Screener. It is designed to work with the TradingView platform. Let me explain how this script works and how it benefits my trading.
Firstly, the ATR Oscillator is an RSI-like oscillator that performs better under longer lookback periods. Unlike traditional RSI, the ATR OSC doesn't lose its min and max ranges with a long lookback period, as the scale remains intact. It calculates the true range by considering the high, low, open, and close prices of a financial instrument, and uses this true range instead of the standard deviation in a modified z-score calculation. This unique approach helps provide a more precise assessment of the market's volatility.
The Volume Screener, on the other hand, helps me identify unusual trading volumes across various cryptocurrencies. It employs a normalized volume calculation method, effectively filtering out outliers and highlighting potentially significant trading opportunities.
One feature I find particularly impressive about the ATR OSC and Volume Screener is its versatility and the way it displays information using color gradients. With support for over 30 different cryptocurrencies, including popular options like Bitcoin (BTC), Ethereum (ETH), Ripple (XRP), and Dogecoin (DOGE), I can monitor a wide range of markets simultaneously. The color gradient on the grid is visually appealing and makes it easy to identify the strength of the indicators for each cryptocurrency, allowing me to make quick comparisons and spot potential trading opportunities.
The customizable input options allow me to fine-tune the script to suit my individual trading preferences and strategies. In summary, the ATR OSC and Volume Screener has been an invaluable tool for me as I navigate the ever-evolving world of cryptocurrencies. By combining the power of the ATR Oscillator with a robust Volume Screener, this Pine Script makes it easier than ever to identify promising trading opportunities and stay ahead of the game.
The color gradient in the ATR OSC and Volume Screener is essential for visually representing the data on the heatmap. It uses a range of colors to indicate the strength of the indicators for each cryptocurrency, making it easier to understand the market dynamics at a glance.
In the heatmap, the color gradient typically starts from a cooler color, such as blue or green, at the lower extremes (low ATR OSC values) and progresses towards warmer colors, like yellow, orange, or red, as the ATR OSC values approach the upper extremes (high ATR OSC values). This color-coding system enables me to quickly identify and interpret the data without having to examine individual numerical values.
For example, cooler colors (blue or green) might represent lower values of the ATR Oscillator, suggesting oversold conditions in the respective cryptocurrencies. On the other hand, warmer colors (yellow, orange, or red) indicate higher ATR OSC values, signaling overbought market conditions. This visual representation allows me to make rapid comparisons between different cryptocurrencies and spot potential trading opportunities more efficiently.
By utilizing the color gradient in the heatmap, the ATR OSC and Volume Screener simplifies the analysis of multiple cryptocurrencies, helping me to quickly identify market trends and make better-informed trading decisions.
I highly recommend testing the ATR OSC and Volume Screener and seeing the difference it can make in your trading decisions. Happy trading!

Cipher Twister - Long and ShortINTRO / NOTES:
This script is based on Market Cipher B Oscillator by Falcon
The difference in this script is that only the useful points are printed on the indicator, namely Long and Short Trade Execution signals to be used by a bot, namely the PT Bot.
The script also differs from the original that it has been upgraded to Pinescript v4
This oscillator can be used with ALL time frames, but generally works the best on 15 minute and 1 hour charts on ANY market, no matter, stock, forex, crypto, spot, futures, derivatives, Nasdaq etc...
DEFINITIONS:
This oscillator forms the foundation of Buy and Exit of Long and Short Trades.
There are 2 'Red' Lines at the top of the channel and 2 Green Lines at the bottom of the channel.
These two channels are set at default to be +53 / -53 and +60 / -60 respectively. These two lines will serve as the threshold point if one is to make cautious trades only.
There is a center line which divides the Oscillator into two parts. Above the center line, the market is in over bought territory and Below the center line is in over sold territory.
'Red' dots are drawn by the indicator to represent a potential Short (or a signal to exit from a Long position)
'Green' dots are drawn by the indicator to represent a potential Long (or a signal to exit from a Short position)
The 'Red' and 'Green' dots are draw when a Cross between both wt1 & wt2 cross, thus providing a fantastic indication of potential trend reversal and entry/exit of a position.
STRATEGY NOTES:
The strategy to use this indicator with for realistic and proper results would be to use it with an automated Trading Bot such as Profit Trailer (PT-BOT)
You could use this strategy manually, however it would mean you would need to sit in front of the screen all day and night long and activate the trades immediately after the 'red'/'green' dots are drawn. Usually this will result in non-optimal entries and exits as well as loss on various instances when a 'red' and 'green' dot are printed close together (which is usually when the market goes into correction/consolidation) and slow entries/exits will result in a loss rather than a small profit or exit at BE (Break Even)
ACTUAL STRATEGY (For use with automated bot)
To be used in conjunction with Heikin Ashi Candles for added cautionary measures
For LONGs ONLY
--------------------
1/ When 'Green' dot is drawn, ACTIVATE Long Position
(Use 1.5% Risk Management for each trade)
(Use Lot size based on 1.5% risk management and xLeverage (if any))
2/ Make sure bot Opens an SL (Stop Loss) value based on 1.5% Risk Management
3/ When 'Red' dot is drawn, CLOSE Long Position.
*If you want to add extra caution to your trade, only activate the trade if the 'Green' dot is BELOW the 'Green' Markers
*For added caution, use color coded Heikin Ashi candles to 'confirm' Activation and Closing of a trade in the bot configuration
---------------------------------------------------------------------------------------------------
For SHORTs ONLY
--------------------
1/ When 'Red' dot is drawn, ACTIVATE Short Position
(Use 1.5% Risk Management for each trade)
(Use Lot size based on 1.5% risk management and xLeverage (if any))
2/ Make sure bot Opens an SL (Stop Loss) value based on 1.5% Risk Management
3/ When 'Green' dot is drawn, CLOSE Short Position
*If you want to add extra caution to your trade, only activate the trade if the 'Red' dot is Above the Red Markers
*For added caution, use color coded Heikin Ashi candles to 'confirm' Activation and Closing of a trade in the bot configuration
---------------------------------------------------------------------------------------------------
Supplementary Notes:
Make sure that your bot configuration will only activate ONE TRADE when the 'Green'/'Red' dot appears.
Occasionally during high volatility , 'red'/'green' dots will appear intermittently before remaining drawn, thus the oscillator 'redraws' the dots during market movement.
There will be times where occasionally a 'green' dot or a 'red' dot will appear, the trade will be opened, but the trade will fail due to the market manipulation (algorithm/market maker bots/fake volume etc), to wipe out those trading on derivatives and futures markets using leverage. Do not worry about this, no bot can make 100% wins, no strategy will achieve 100% win ratio and one necessarily doesn't need a high win ratio when using strict money management practices with your trading for SL and lot size.
If you use this method, you will see great results, but again I must stress, using this method with a fully automated bot is the only way to achieve proper results.

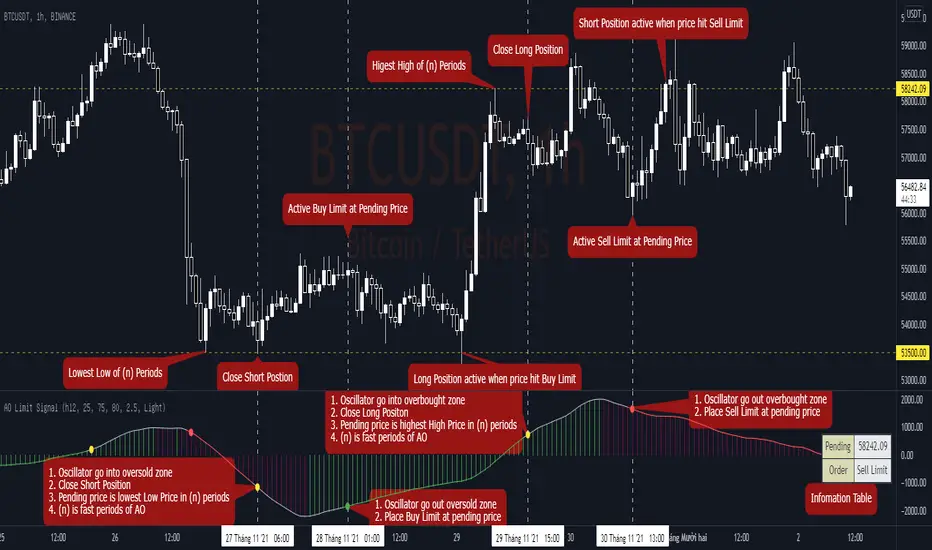
AO Limit Signal===
AO Limit Signal supply Pending Price and Limit Order with detail as bellow
===
A.Buy Limit
1.Get Pending Price
+ Oscillator go into oversold zone
+ Pending price is lowest Low Price in (n) periods
+ (n) is fast periods of AO
2.Active Buy Limit
+ Oscillator go out oversold zone
+ Place Buy Limit at pending price
===
B.Sell Limit
1.Get Pending Price
+ Oscillator go into overbought zone
+ Pending price is highest High Price in (n) periods
+ (n) is fast periods of AO
2.Active Sell Limit
+ Oscillator go out overbought zone
+ Place Sell Limit at pending price
===
C.Oscillator
1.AO default parameter
+ Source: HL2
+ Fast Period: 25 H1
+ Slow Period: 75 H1
2.Overbought - Oversold Zone
+ AO's %b period: 80
+ AO's %b multiplier: 2.5
+ Overbought zone: AO's %b above 0.8
+ Oversold zone: AO's %b below 0.2
3.Color
+ Yellow dot: AO go into Overbought - Oversold Zone
+ Red dot: AO go out Overbought Zone
+ Green dot: AO go out Oversold Zone
===
Multpile strategies [LUPOWN]///English
This indicator contains many indicators that together can form different strategies, by default there is the Latin trading strategy with the points of the cipher by @Vumanchu indicator that actually these points appear when a lazy bear indicator gives the signal, the white shadow that It is seen by default is the MFI, this adaptation is the same as the one with the indicator cipher by @Vumanchu, if the white shadow is above the 0 point we can search for a buy position, this helping us with the squeeze momentum and the ADX (information in the panel), you can even enter before the buy or sell panel if the green dot appears, this is one of several strategies that can be formed with this indicator.
Other hidden indicators by default are the CCi, Koncorde (adapted thanks to the version of @inversiones por el mundo and modified by @ lkdml), MACD, stochastic, Awesome Oscillator, Elliot Oscillator, which, as I say, combined can be good strategies.
The indicator also shows divergences, both in the RSI and in the Squeeze momentum and in the Awesome Oscillator if it is on the chart, the divergence code is from @madoqa and I adapted it for the different indicators.
The panel shows the status of the chart according to the Trading Latino strategy
You can hide and show the indicators you want through the settings.
///// Spanish
Este indicador contiene muchos indicadores que en conjunto pueden formar diversas estrategias, por default esta la estrategia de trading latino con los puntos del indicador cipher by @Vumanchu que en realidad estos puntos aparecen cuando un indicador de lazy bear da la señal, la sombra blanca que se ve por default es el MFI esta adaptación es la misma a la que tiene el indicador cipher by @Vumanchu, si la sombra blanca esta por encima del punto 0 podemos buscar entradas en compra, esto ayudándonos del squeeze momentum y el ADX (información en el panel), incluso se puede entrar antes que el panel nos de compra o venta si el punto verde aparece, esta es una de varias estrategias que se pueden formar con este indicador.
Otros indicadores ocultos por default están el CCi, Koncorde (adaptado gracias a la versión de @inversiones por el mundo y modificado por @ lkdml), MACD, estocastico , Awesome Oscillator, Elliot Oscilator, que como digo combinados se pueden hacer buenas estrategias.
En el indicador también se muestran divergencias, tanto en el RSI como en el Squeeze momentum y en el Awesome Oscillator si es que esta en el grafico, el código de divergencias es de @madoqa yo lo adapte para los diferentes indicadores.
El panel muestra el estatus del grafico según la estrategia de Trading Latino
Puedes ocultar y mostrar los indicadores que quieras mediante las configuraciones.

VIX Fix Double PleasureFULL README: github.com/samgozman/vix-fix-double-pleasure
The idea of an oscillator is quite simple. It is based on the popular VIX Fix oscillator, the purpose of which is to find local bottoms within the scope of trend movement. But in addition to the classic VIX fix, I built an oscillator opposite to it, which serves as a potential signal of the end of local growth.
Components
VIX Fix classic (red lines)
VIX Fix reversed (green lines)
Buy/sell signals (colored dots)
Parameters
VIXFix_length - defval: 22. Classic length for VIX fix
VIXFix_arraySize - defval: 22. The number of periods among which to look for lows and highs. If there are too many signals, reduce this value.
plotMarks - defval: true. Plot high/low marks
How it is calculated
VIX fix classic: (highest(close, VIXFix_length) - low) / highest(close, VIXFix_length) * -100
VIX fix reversed: (lowest(close, VIXFix_length) - high) / lowest(close, VIXFix_length) * -100
Signals
🟢 Buy signal if current "VIX fix classic" or "VIX Fix reversed" value is lowest from the last VIXFix_arraySize periods.
🔴 Sell signal if current "VIX fix classic" or "VIX Fix reversed" value is highest from the last VIXFix_arraySize periods.
General recommendations
I advise you not to use this oscillator for a short positions. Long only . It is recommended to set a long position by pyramiding.

Rsi, Stoch, DMI, Doble(Stoch RSi) // By MocheroWith this indicator we seek to find convergence of the
First Oscillator (RSI, Stoch and DMI) and the Second Oscillator (Stoch, Stoch RSI 1 and Stoch RSI 2) for purchases or sales.
Search Buy when,
First Oscillator
-Rsi oversold
-Stoch over sold
-DMI oversold
Second Oscillator
-Stoch over sold
-Stoch RSI 1 oversold
-Stoch RSI 2 oversold
Suggested values
First Oscillator
Rsi: 4
Stoch: 5.1.1
DMI: 10.3
Second Oscillator
Stoch: 14.3.3
Stoch RSI 1: 14 .14.3.3
Stoch RSI 2: 6. 6.3.3
Suggested time, 3M 5M 15M

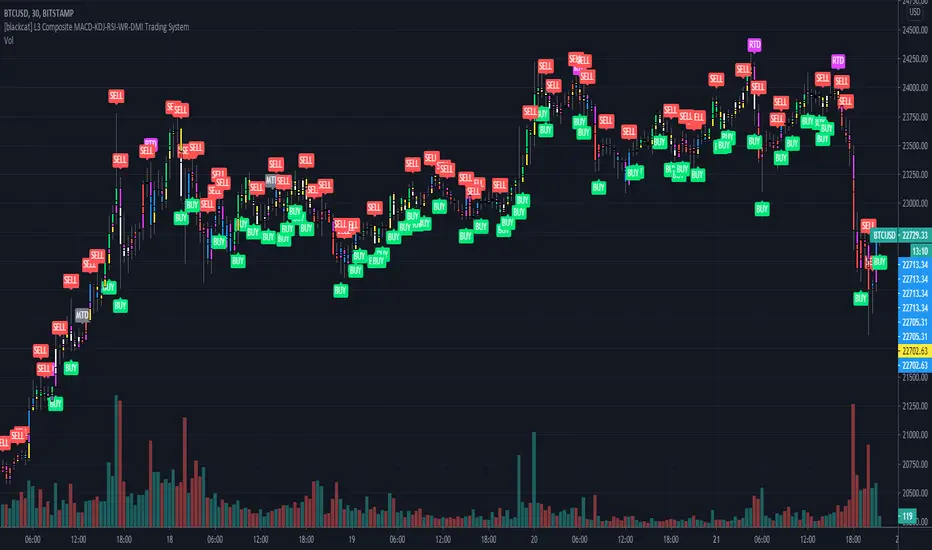
[blackcat] L3 Composite MACD-KDJ-RSI-WR-DMI Trading SystemLevel: 3
Background
The moving average convergence / divergence (MACD) indicator is a pulse oscillator that is mainly used to trade trends. Although it is an oscillator, it is not typically used to identify overbought or oversold conditions. It appears in the diagram as two lines that oscillate without limits. The crossing of the two lines provides trading signals similar to a system with two moving averages.
The KDJ indicator is a technical indicator used to analyze and predict changes in stock performance and the price patterns of a traded asset. The KDJ indicator is also known as the random index. It is a very useful technical indicator that is most commonly used in short term stock market trend analysis. KDJ is a derived form of the Stochastic Oscillator Indicator with the only difference that an additional line is called the J-line. Values of% K and% D indicate whether the security is overbought (over 80) or oversold (under 20). The moments when% K exceeds% D are the moments to sell or buy. The J line represents the deviation of the% D value from% K. The value of J can exceed for the% K and% D lines on the graph.
The Relative Strength Index (RSI) developed by J. Welles Wilder is a pulse oscillator that measures the speed and change of price movements. The RSI hovers between zero and 100. Traditionally, the RSI is considered overbought when it is above 70 and oversold when below 30. Signals can be generated by looking for divergences and error fluctuations.
Williams% R, also known as the Williams Percent Range, is a type of momentum indicator that moves between 0 and -100 and measures overbought and oversold levels. The Williams% R can be used to find entry and exit points in the market. The indicator is very similar to the stochastic oscillator and is used in the same way.
The Directional Movement Index (DMI) is an indicator developed by J. Welles Wilder in 1978 to determine in which direction asset prices are moving. The indicator does this by comparing previous highs and lows and drawing two lines: a positive movement line (+DI) and a negative movement line (-DI). The optional third line is called "Directional Movement (DX)" and it shows the difference between the two lines. When +DI is higher than -DI, the upward pressure on the price is greater than the downward pressure. If -DI is higher than +DI, the price will have greater downward pressure. This indicator can help traders assess the trend direction. Crosses between lines are sometimes used as buying and selling signals.
Function
L3 Composite MACD-KDJ-RSI-WR-DMI Trading System is a simple trading system composed of MACD-KDJ-RSI-WR-DMI together. It can produce 6 types of long entries and 3 types of short entries. It utilizes divergence effect from MACD, KDJ and RSI to detect trend reversal. 6 types of Bottom and top divergence labels are displayed in the chart together with "BUY" and "SELL".
NOTE:In order to make the actual label of the chart more clear, this script does not add stop loss and take profit functions and according labels.
Signal
b1~b3 ---> MACD, KDJ, RSI bottom divergence signal respectively, which hint bull trend may start soon.
d1~d3 ---> MACD, KDJ, RSI top divergence signal respectively, which hint bear trend may start soon.
longentry1~6 ---> with composite indicators together, 6 types of long entry signal are produced.
shortentry1~3 ---> with composite indicators together, 3 types of short entry signal are produced.
Pros and Cons
Pros:
1. excellent open-close, long-short entry signal generation with multiple powerful indicators
2. indicator resonance can help to promote the confidence level of signal and divergence alerts
Cons:
1. integration of multiple indicators is not deeply optimized. fake signal may be produced without filtering schemes
2. no range filter is added
Remarks
To celebrate number of followers exceeds 100. This is my first L3 script published.
Readme
In real life, I am a prolific inventor. I have successfully applied for more than 60 international and regional patents in the past 12 years. But in the past two years or so, I have tried to transfer my creativity to the development of trading strategies. Tradingview is the ideal platform for me. I am selecting and contributing some of the hundreds of scripts to publish in Tradingview community. Welcome everyone to interact with me to discuss these interesting pine scripts.
The scripts posted are categorized into 5 levels according to my efforts or manhours put into these works.
Level 1 : interesting script snippets or distinctive improvement from classic indicators or strategy. Level 1 scripts can usually appear in more complex indicators as a function module or element.
Level 2 : composite indicator/strategy. By selecting or combining several independent or dependent functions or sub indicators in proper way, the composite script exhibits a resonance phenomenon which can filter out noise or fake trading signal to enhance trading confidence level.
Level 3 : comprehensive indicator/strategy. They are simple trading systems based on my strategies. They are commonly containing several or all of entry signal, close signal, stop loss, take profit, re-entry, risk management, and position sizing techniques. Even some interesting fundamental and mass psychological aspects are incorporated.
Level 4 : script snippets or functions that do not disclose source code. Interesting element that can reveal market laws and work as raw material for indicators and strategies. If you find Level 1~2 scripts are helpful, Level 4 is a private version that took me far more efforts to develop.
Level 5 : indicator/strategy that do not disclose source code. private version of Level 3 script with my accumulated script processing skills or a large number of custom functions. I had a private function library built in past two years. Level 5 scripts use many of them to achieve private trading strategy.
Price Action Trading System v0.3 by JustUncleL with modifcationsThe base of this script is the Price Action Trading System from JustUncle .
I have first combined it with script ADX and DI by BeikabuOyaji to indicate when the +DI is above the -DI and the ADX is above 20. This is represented by crosses at the top of the page: green indicating that the +DI is above the -DI and ADX above 20, and red if -DI is above the +DI and ADX above 20. If the ADX is increasing in slope while the +DI is above the -DI, an up green arrow is shown at the bottom of the page, indicating an increase in this trend, and the slope of the ADX is increasing and the -DI is above the +DI, a down arrow is shown at the bottom. One could think to a green cross with a green up arrow as a potential buy opportunity, and a red cross with a red down arrow as a potential sell opportunity.
Next, I have combined this script with the Indicator: WaveTrend Oscillator from Lazybear . If the oscillator has readings below -45 and the slope of the line is increasing, a green diamond appears above the chart. This indicates a potential buy opportunity. If the oscillator has readings above 50 and the slope of the line is decreasing, a red diamond appears above the chart. This indicates a potential sell opportunity. Now if the slope of the oscillator is rising significantly but does not hit the -45 threshold to start its increase, but is negative in value, a green flag appears at the top of the page. This represents a potential buy opportunity. If the slope of the oscillator is significantly decreasing and is positive in value, a red flag appears at the bottom of the page. This represents a potential sell opportunity.
The base of this script, the Price Action Trading System v0.3 by JustUncle , has many of its own features that I have kept. If the MACD is positive, the background colour is green. If it is negative, the colour is red. If the CCI and RSI indicate an oversold opportunity and the MACD is positive, you get an up olive arrow below the chart. If they indicate an overbought opportunity and the MACD is negative, you get a red down arrow above the chart. If the CCI value stays oversold after a green arrow, the candle chart turns turquoise, and if overbought, turns black after a red arrow.
You can use these indicators in combination to help you with your trading strategy.

Bias And Sentiment Strength (BASS) Indicator by mattzabBias And Sentiment Strength (BASS) Indicator is designed to be a quick visualization as to the market strength.
Pair with Alligator, MACD, or Moving Average lines on your chart for good results.
How to use this indicator:
Blue above 0 is positive sentiment, red below 0 is negative sentiment.
If you have blue above and red below, be cautious! The Bass is telling you that we have a battle between the Bulls and the Bears!
The purple bars are your volume bias. Volume bias can be positive or negative, despite the direction of the overall trend. Positive Volume Bias along with Bullish Blue Sentiment is a great sign! Go Long! If you have Bullish Sentiment and have a negative Volume Bias, be cautious! Price may not be moving with much conviction, and may be subject to reversal!
This is basically several different histograms overlaying one another, and they are blue above 0 and red below 0.
MACD Histogram - Standard MACD Histogram here.
RSI Histogram - This is a standard RSI. It has been adjusted to "oscillate" above and below zero, which would be the 50 line on a normal RSI chart.
Slow Stochastic Histogram - This is a slow stochastic with a 21 Period K, 14 Period D, and 14 Smoothing K. The "oscillator" histogram is formed by subtracting K from D.
Awesome Oscillator - This is a standard Awesome Oscillator
Alligator Oscillator - This is formed by adding (lips + teeth) + (teeth - jaw)
Volume Bias - The Volume Bias is displayed as purple bars, and is calculated by a highly sophisticated and complex algorithmic function called subtraction. It's just the 30 Period Volume-Weighted Moving Average Minus the 30 Simple Moving Average.
Enjoy!

Trading Range Indicator - TRISimple script made to identify trading ranges in any timeframe
The oscillator bounces between 1 and 0. 1 means that the current asset is in a trading range and 0 meaning it is not.
The determination of a trading range is determined by the following:
ATR(14)40 and RSI<60
ADX<25
Due to all 3 having to be fulfilled in order for the oscillator to show there is a trading range, this causes a problem where 2 of the conditions are fulfilled and therefore still shows 0 on the oscillator, however, the asset could very well be in a trading range.
So what in the world do you use this for if there is such a significant margin of error?
Since all 3 conditions need to be fulfilled in order for it to be considered a trading range, this gives a very strong indicator of said trading ranges. So if a person is looking at individual stock tickers or the SPY index ticker, then when the oscillator reads a 1, it could be ideal to open an Iron Condor on said ticker. This means that this indicator is not well suiting for traditional long and short stock positions, but rather it is made for options traders who by using an Iron Condor can make money of a range-bound market.
Multiple WaveTrend with Ribbons [CryptoFarian]This is based on LazyBear's WaveTrend Oscillator . I get the idea from klov's Kite Crossing Oscillator which adds support for multiple time frames and what I have done here is to add support for Heikin Ashi candles, ribbons and mark bars for long/short opportunities.
Combo Strategy 123 Reversal & Bill Williams. AC with Signal Line This is combo strategies for get a cumulative signal.
First strategy
This System was created from the Book "How I Tripled My Money In The
Futures Market" by Ulf Jensen, Page 183. This is reverse type of strategies.
The strategy buys at market, if close price is higher than the previous close
during 2 days and the meaning of 9-days Stochastic Slow Oscillator is lower than 50.
The strategy sells at market, if close price is lower than the previous close price
during 2 days and the meaning of 9-days Stochastic Fast Oscillator is higher than 50.
Second strategy
This indicator plots the oscillator as a histogram where blue denotes
periods suited for buying and red . for selling. If the current value
of AO (Awesome Oscillator) is above previous, the period is considered
suited for buying and the period is marked blue. If the AO value is not
above previous, the period is considered suited for selling and the
indicator marks it as red.
You can make changes in the property for set calculating strategy MA, EMA, WMA
WARNING:
- For purpose educate only
- This script to change bars colors.