BTC Energy + HR + Longs + M2
BTC Energy Ratio + Hashrate + Longs + M2
The #1 Bitcoin Macro Weapon on TradingView 🚀🔥
If you’re tired of getting chopped by fakeouts, ETF noise, and Twitter hopium — this is the one chart that finally puts you on the right side of every major move.
What you’re looking at:
Orange line → Bitcoin priced in real-world mining energy (Oil × Gas + Uranium × Coal) × 1000
→ The true fundamental floor of BTC
Blue line → Scaled hashrate trend (miner strength & capex lag)
Green line → Bitfinex longs EMA (leveraged bull sentiment)
Purple line → Global M2 money supply (US+EU+CN+JP) with 10-week lead (the liquidity wave BTC rides)
Why this indicator prints money:
Most tools react to price.
This one predicts where price is going based on energy, miners, leverage, and liquidity — the only four things that actually drive Bitcoin long-term.
It has nailed:
2022 bottom at ~924 📉
2024 breakout above 12,336 🚀
2025 top at 17,280 🏔️
And right now it’s flashing generational accumulation at ~11,500 (Nov 2025)
13 permanent levels with right-side labels — no guessing what anything means:
20,000 → 2021 Bull ATH
17,280 → 2025 ATH
15,000 → 2024 High Resist
14,000 → Overvalued Zone
13,000 → 2024 Breakout
12,336 → Bull/Bear Line (the most important level)
12,000 → 2024 Volume POC
10,930 → Key Support 2024
9,800 → Strong Buy Fib
8,000 → Deep Support 2023
6,000 → 2021 Mid-Cycle
4,500 → 2023 Accum Low
924 → 2022 Bear Low
Live dashboard tells you exactly what to do — no thinking required:
Current ratio (updates live)
Hashrate + 24H %
Longs trend
Risk Mode → Orange vs Hashrate (RISK ON / RISK OFF)
180-day correlation
RSI
13-tier Zone + SIGNAL (STRONG BUY / ACCUMULATE / HOLD / DISTRIBUTE / EXTREME SELL)
Dead-simple rules that actually work:
Weekly timeframe = cleanest view
Blue peaking + orange holding support → miner pain = next leg up
Green spiking + orange failing → overcrowded longs = trim
Purple rising → liquidity coming in = ride the wave
Risk Mode = RISK OFF → price is cheap vs miners → buy
Set these 3 alerts and walk away:
Ratio > 12,336 → Bull confirmed → add
Ratio > 14,000 → Start scaling out
Ratio < 9,800 → Generational buy → back up the truck
No repainting • Fully open-source • Forced daily data • Works on any TF
Energy is the only real backing Bitcoin has.
Hashrate lag is the best leading indicator.
Longs show greed.
M2 is the tide.
This chart combines all four — and right now it’s screaming ACCUMULATE.
Load it. Trust it.
Stop trading hope. Start trading reality.
DYOR • NFA • For entertainment purposes only 😎
#bitcoin #macro #energy #hashrate #m2 #cycle #riskon #riskoff
在腳本中搜尋"poc"

[CASH] Crypto And Stocks Helper (MultiPack w. Alerts)ATTENTION! I'm not a good scripter. I have just learned a little basics for this project, stolen code from other public scripts and modified it, and gotten help from AI LLM's.
If you want recognition from stolen code please tell me to give you the credit you deserve.
The script is not completely finished yet and contains alot of errors but my friends and family wants access so I made it public.
_________________________________________________________________________________
CASH has multiple indicators (a true all-in-one multipack), guides and alerts to help you make better trades/investments. It has:
- Bitcoin Bull Market Support Band
- Dollar Volume
- 5 SMA and 5 EMA
- HODL Trend (a.k.a SuperTrend) indicator
- RSI, Volume and Divergence indicators w. alerts
More to come as well, like Backburner and a POC line from Volume Profile.
Everything is fully customizable, appearance and off/on etc.
More information and explainations along with my guides you can find in settings under "Input" and "Style".

Support & Resitance LinesIntroduction:
Support & Resistance levels are time consuming to mark on charts. They also must be maintained. If the user has multiple charts they analyze, this adds to the workload. This indicator attempts to automate that work flow for the user.
Description:
Psychological Support and Resistances
are marked with a horizontal ray and labeled.
Levels marked include the 1 Month, 1 Week, and the Daily.
If a candle closes on the marked levels, the horizontal ray marking that level will disappear.
Volume Based Support and Resistances [/i
With the fixed range volume profile tool, marked levels include the point of control(POC) and the Value Areas (VA). This includes both the Value Area Low (VAL) and the Value Area High (VAH). Levels marked include the 1 Year, 6 Month, and the 1 Month fixed range volume profile.
If a candle closes on the marked levels, the horizontal ray marking that level will disappear.
How to use:
1) Turn on indicator and make sure you are on the 1D time frame.
2) Find areas of high confluence and mark with rectangular box.
3) Once all areas are marked, turn off indicator to save CPU time.
4) It is now ready to use and you can scan the chart using multiple time frames.
Useful Tips:
1) Use this tool to see if these levels marked are respected in forward testing.
2) You can turn off labels and color code horizontal rays to make tool run more efficiently for the CPU.
3) Use RSI, MACD, Wave Trend with Crosses , or any other oscillator to identify divergences once price hits support & resistance. Observe if price reacts.
4) Confluence is key, the higher the confluence, the better.

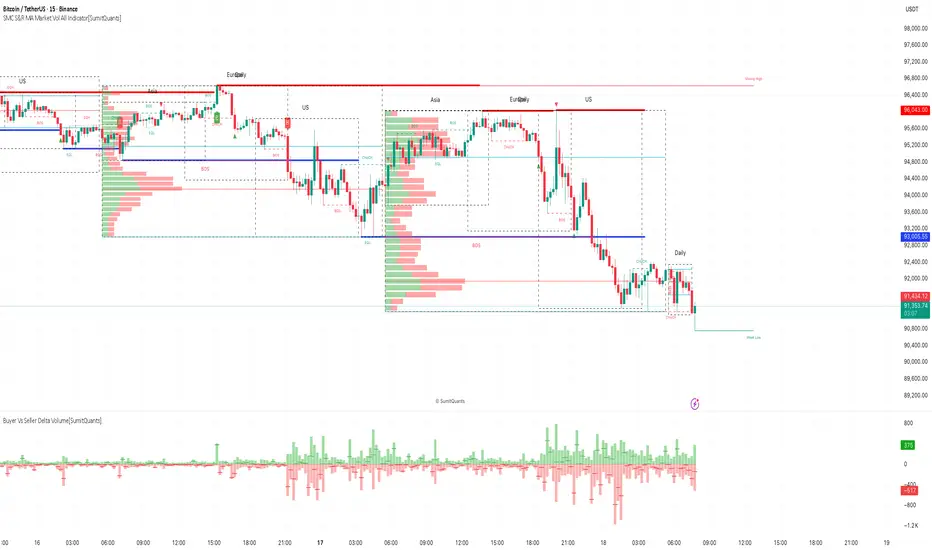
SMC S&R MA Market Vol All Indicator[SumitQuants]🚀 SMC S&R + Market Sessions + Volume Profile + Order Flow Suite
The Only All-In-One Institutional Trading System You’ll Ever Need.
Looking for an indicator that actually brings clarity to chaotic markets?
Meet the SMC S&R MA Market Volume & Sessions Order Flow System — a powerhouse that fuses Smart Money Concepts, Session Profiles, and Dynamic Volume Flow into one ultra-optimized institutional toolkit.
This is not “just another SMC indicator.”
This is your complete trading ecosystem.
💠 What This Indicator Does (In Simple Terms)
It automatically reads the market the way institutions do — and displays it cleanly on your chart with zero clutter.
Below is everything packed inside 👇
🔥 1. Market Sessions + Volume Profile (Real Institutional Map)
✔ Tokyo- Asia | London- Europe | New York- US sessions auto-detected ⏱️
✔ Each session gets its own Volume Profile 📊
✔ See POC, VAH, VAL, Value Area Box for each session
✔ Live Developing Profile in real-time
✔ Wick-based and body-volume distribution for ultra-accurate auctions
✔ Session Boxes that highlight imbalance zones
✔ Perfect for:
High-volume Asia breaks
London volatility expansion
NY reversal traps
👉 Think of it as having pro-level TPO/Volume Profile inside TradingView.
🎯 2. Advanced S&R Strength Engine (Buyer vs Seller Power Meter)
✔ Detects strongest Support & Resistance zones
✔ Measures Buyer Strength & Seller Strength (% based)
✔ Auto-plots S/R Lines + S/R Zones
✔ Detects Bounce signals, Rejection points, Pressure shifts
✔ Zero repaint logic
You get institutional footprints directly on your chart.
📈 3. Smart Money Concepts (Full Automation)
✔ BOS / CHoCH detection
✔ Internal + Swing Structure
✔ Order Blocks (Internal + Swing)
✔ Equal Highs & Equal Lows
✔ Fair Value Gaps (FVG)
✔ Strong/Weak Highs + Lows labeling
✔ Trend coloring (optional)
✔ Premium / Discount Zones
All plotted with precision.
All customizable.
All built to remove guesswork.
💹 4. Multi-MA Engine (5 Fully Configurable MAs)
✔ EMA, SMA, WMA, VWMA, SMMA
✔ Choose length, color, and source
✔ Ideal for trend confirmation + dynamic S/R
Smooth. Clean. Non-laggy.
📊 5. Enhanced Supertrend (Toggles + Filters)
✔ Switch between Line / Histogram / Hidden
✔ Optional background trend coloring
✔ Buy/Sell signals with trend-change alerts
✔ No repaint
Perfect for directional bias.
⚡ 6. Breakout Detection + Volume Confirmation
✔ Auto-detects Support/Resistance Breaks
✔ Confirms breaks through Volume Surge % Oscillator
✔ Detects:
Bullish Breaks
Bearish Breaks
Bullish Rejections
Bearish Rejections
You instantly know when a breakout is real or fake.
📍 7. VWAP System with Multi-Band Zones
✔ Session-based VWAP
✔ Bands via Std Deviation or %
✔ Clean pullback zones
✔ Perfect for intraday institutions-style precision
🧠 8. Fully Integrated Alerts
Alerts for:
✔ BOS / CHoCH (Internal + Swing)
✔ Order Block Breakouts
✔ Equal Highs / Equal Lows
✔ Fair Value Gaps
✔ S/R Zone Interactions
✔ Trend Shifts
✔ Breakouts with Volume Confirmation
✔ Supertrend Reversals
And more.
Never miss major price shifts again.
🎨 9. Clean UI + Auto-Adaptive Watermark
✔ Auto-contrast watermark
✔ Minimalistic but premium
✔ Chart-friendly colors
✔ Built to match dark or light themes
🌍 Who This Indicator Is For?
✔ Intraday traders
✔ Swing traders
✔ SMC traders
✔ Volume/Order Flow traders
✔ Forex, Crypto, Index & Stocks
✔ Anyone wanting a single all-in-one trading system
🔥 Why 90% Traders Love This System
Because it gives you:
🔥 Session Bias
🔥 Volume-backed Zones
🔥 Clean Market Structure
🔥 Trend Bias + Liquidity Areas
🔥 Institutional S/R with Strength Meter
🔥 Accurate Order Flow Reactions
Everything you need to trade like top-tier professionals — without needing 10 indicators.
🛒 Get Full Access
This premium institutional system is available as part of the Courses Section on the official website.
👉 Purchase the indicator as a Course at:
www.ironmindtrader.com
Inside the course, you'll get:
✔ Access instructions
✔ Setup guide
✔ Trading rules
✔ Updates included
TradeX Labs Pivot MasterLucrorStrategies — Automated Price Action Execution Framework
This indicator-strategy automation is built for traders who want a simple, consistent, and rules-based trading system—no multi-timeframe chaos or overcomplicated confirmation layers. It trades purely from prior-day price action, keeping volatility, structure, and logic constant across all sessions.
Every entry, stop, and target comes directly from the same volatility-adjusted model. If the trade can’t fit your defined dollar risk, it simply won’t execute or plot.
⸻
IMPORTANT NOTE
***Since TradingView utilizes close of bar for plots, this is best utilized for real time entry/exit signals on 1 second charts or lower. If you do not have 1 second charts we can not recommend you to upgrade your subscription but we HIGHLY recommend utilizing this script on a 1 second chart. If utilizing on any higher time frame any signals or trade logic will be delayed and inaccurate or signals can be entirely skipped altogether and populate incorrect entries***
⸻
Purpose & Core Design
The framework is anchored to prior-day settlement data and mathematically transforms it into real-time, session-specific trading levels. This creates a daily map of opportunity that evolves with volatility while maintaining a consistent structure.
This approach eliminates guesswork and ensures the same conditions that produced historical edge apply to every live session.
⸻
Key Inputs & Control
1. Dollar Risk
Set your maximum dollar risk per trade. The system automatically sizes positions to stay at or below that risk limit based on stop distance.
• If the trade qualifies: a red-to-green gradient fill and entry label appear.
• If not: no fill, no entry, no false visual signals.
2. Timer Exit (Default: 30 Minutes)
The strategy is designed for momentum capture in the first 30 minutes after market open. If a trade remains active beyond that time, it is closed automatically.
All back tests and live reports reference this same window to maintain integrity. (Adjustable if you wish.)
3. Days to Keep Lines
Controls how many sessions of plotted levels and fills stay visible (up to 10).
To explore further back, use TradingView’s replay mode. The indicator will continue plotting as far as platform data allows.
4. Font & Label Size
• Price Label Size: Adjusts the numerical price levels beside pivots for manual pre-market entries.
• Level Label Size: Controls the on-chart text size for active trade signals. Both fully customizable.
⸻
Level Structure & Trade Mechanics
All plotted levels originate from a proprietary prior-day volatility formula. You will see:
• Middle Green Horizontal Lines — Support Levels
These mark historically reactive zones where price has a higher probability of holding or bouncing.
• Middle Blue Horizontal Lines — Resistance Levels
These represent opposing zones where price tends to reject or stall.
(Solid and dotted variants handle different roles in execution logic.)
• Red Horizontal Lines — Points of Control (POC Zones)
These are high-impact levels where price historically either rejects violently or breaks with strength.
⸻
Trade Logic
Long Trades
• Trigger: The solid blue line above the current structure acts as the long trigger.
• Stop: The solid blue line below is the stop-loss.
• Target: The next solid blue line above serves as the target.
Long trades are executed when price hits the solid blue trigger above the current level, using solid levels exclusively for entry, stop, and target.
Short Trades
• Trigger: The dotted blue line below the current structure is the short trigger.
• Stop: The dotted blue line above is the stop-loss.
• Target: The next dotted blue line below becomes the target.
Short trades use only dotted levels to define all key mechanics — entry, stop, and target — keeping short setups visually distinct and structurally independent from longs.
This dual structure allows for clean, symmetrical trade logic across both sides of the market, with consistent volatility mapping from prior-day data.
⸻
High-Priority Red Levels (Points of Control)
Red horizontal levels represent areas of major interest — typically where institutional activity concentrated previously. Price often reacts sharply here: either reversing instantly or breaking through with momentum.
These are optional reference points but often signal where the strongest reactions occur.
⸻
Visualization & Behavior
• Executed trades show the red-to-green gradient fill.
• Trades that exceed risk parameters simply do not appear.
• Levels remain clean and persistent day to day for back testing, journaling, or educational
use.
⸻
Disclaimer
This is a closed, proprietary LucrorStrategies tool. It is provided for analytical and educational use only. It does not predict price or guarantee profit. All trade execution, configuration, and outcomes remain the responsibility of the user.

smaemarvwapClaireLibrary "smaemarvwapClaire"
repeat_character(count)
Parameters:
count (int)
f_1_k_line_width()
is_price_in_merge_range(p1, p2, label_merge_range)
Parameters:
p1 (float)
p2 (float)
label_merge_range (float)
get_pre_label_string(kc, t, is_every)
Parameters:
kc (VWAP_key_levels_draw_settings)
t (int)
is_every (bool)
f_is_new_period_from_str(str)
Parameters:
str (string)
total_for_time_when(source, days, ma_set)
Parameters:
source (float)
days (int)
ma_set (ma_setting)
f_calculate_sma_ema_rolling_vwap(src, length, ma_settings)
Parameters:
src (float)
length (simple int)
ma_settings (ma_setting)
f_calculate_sma_ema_rvwap(ma_settings)
Parameters:
ma_settings (ma_setting)
f_get_ma_pre_label(ma_settings, sma, ema, rolling_vwap)
Parameters:
ma_settings (ma_setting)
sma (float)
ema (float)
rolling_vwap (float)
f_smart_ma_calculation(ma_settings2)
Parameters:
ma_settings2 (ma_setting)
f_calculate_endpoint(start_time, kc, is_every, endp, extend1, extend2, line_label_extend_length)
Parameters:
start_time (int)
kc (VWAP_key_levels_draw_settings)
is_every (bool)
endp (int)
extend1 (bool)
extend2 (bool)
line_label_extend_length (int)
f_single_line_label_fatory(left_point, right_point, line_col, line_width, lines_style_select, labeltext_col, label_text_size, label_array, line_array, label_col, label_text, l1, label1)
根据两个点创建线段和/或标签,并将其添加到对应的数组中
Parameters:
left_point (chart.point) : 左侧起点坐标
right_point (chart.point) : 右侧终点坐标
line_col (color) : 线段颜色
line_width (int) : 线段宽度
lines_style_select (string) : 线段样式(实线、虚线等)
labeltext_col (color) : 标签文字颜色
label_text_size (string) : 标签文字大小
label_array (array) : 存储标签对象的数组
line_array (array) : 存储线段对象的数组
label_col (color) : 标签背景颜色(默认:半透明色)
label_text (string) : 标签文字内容(默认:空字符串)
l1 (bool) : 是否创建线段(默认:false)
label1 (bool) : 是否创建标签(默认:false)
Returns: void
f_line_and_label_merge_func(t, data, l_text, kc, is_every, endp, merge_str_map, label_array, line_array, extend1, extend2, line_label_extend_length, label_merge_control, line_width, lines_style_select, label_text_size)
Parameters:
t (int)
data (float)
l_text (string)
kc (VWAP_key_levels_draw_settings)
is_every (bool)
endp (int)
merge_str_map (map)
label_array (array)
line_array (array)
extend1 (bool)
extend2 (bool)
line_label_extend_length (int)
label_merge_control (bool)
line_width (int)
lines_style_select (string)
label_text_size (string)
plot_ohlc(kc, ohlc_data, extend1, extend2, merge_str_map, label_array, line_array, is_every, line_label_extend_length, label_merge_control, line_width, lines_style_select, label_text_size)
Parameters:
kc (VWAP_key_levels_draw_settings)
ohlc_data (bardata)
extend1 (bool)
extend2 (bool)
merge_str_map (map)
label_array (array)
line_array (array)
is_every (bool)
line_label_extend_length (int)
label_merge_control (bool)
line_width (int)
lines_style_select (string)
label_text_size (string)
plot_vwap_keylevels(kc, vwap_data, extend1, extend2, merge_str_map, label_array, line_array, is_every, line_label_extend_length, label_merge_control, line_width, lines_style_select, label_text_size)
Parameters:
kc (VWAP_key_levels_draw_settings)
vwap_data (vwap_snapshot)
extend1 (bool)
extend2 (bool)
merge_str_map (map)
label_array (array)
line_array (array)
is_every (bool)
line_label_extend_length (int)
label_merge_control (bool)
line_width (int)
lines_style_select (string)
label_text_size (string)
plot_vwap_bardata(kc, ohlc_data, vwap_data, extend1, extend2, merge_str_map, label_array, line_array, is_every, line_label_extend_length, label_merge_control, line_width, lines_style_select, label_text_size)
Parameters:
kc (VWAP_key_levels_draw_settings)
ohlc_data (bardata)
vwap_data (vwap_snapshot)
extend1 (bool)
extend2 (bool)
merge_str_map (map)
label_array (array)
line_array (array)
is_every (bool)
line_label_extend_length (int)
label_merge_control (bool)
line_width (int)
lines_style_select (string)
label_text_size (string)
f_start_end_total_min(session)
Parameters:
session (string)
f_get_vwap_array(anchor1, data_manager, is_historical)
Parameters:
anchor1 (string)
data_manager (data_manager)
is_historical (bool)
f_get_bardata_array(anchorh, data_manager, is_historical)
Parameters:
anchorh (string)
data_manager (data_manager)
is_historical (bool)
vwap_snapshot
Fields:
t (series int)
vwap (series float)
upper1 (series float)
lower1 (series float)
upper2 (series float)
lower2 (series float)
upper3 (series float)
lower3 (series float)
VWAP_key_levels_draw_settings
Fields:
enable (series bool)
index (series int)
anchor (series string)
session (series string)
vwap_col (series color)
bands_col (series color)
bg_color (series color)
text_color (series color)
val (series bool)
poc (series bool)
vah (series bool)
enable2x (series bool)
enable3x (series bool)
o_control (series bool)
h_control (series bool)
l_control (series bool)
c_control (series bool)
extend_control (series bool)
only_show_the_lastone_control (series bool)
bg_control (series bool)
line_col_labeltext_col (series color)
bardata
Fields:
o (series float)
h (series float)
l (series float)
c (series float)
v (series float)
start_time (series int)
end_time (series int)
ma_setting
Fields:
day_control (series bool)
kline_numbers (series int)
ma_color (series color)
ema_color (series color)
rvwap_color (series color)
ma_control (series bool)
ema_control (series bool)
rvwap_control (series bool)
session (series string)
merge_label_template
Fields:
left_point (chart.point)
right_point (chart.point)
label_text (series string)
p (series float)
label_color (series color)
merge_init_false (series bool)
anchor_snapshots
Fields:
vwap_current (array)
vwap_historical (array)
bardata_current (array)
bardata_historical (array)
data_manager
Fields:
snapshots_map (map)
draw_settings_map (map)

War Room – Combined HUD v3.4 (Cap T+1, RTH+ON H/L)War Room Combined HUD — Futures / Flow Command Panel
Purpose:
A high-performance multi-layer heads-up display (HUD) designed for intraday futures trading (optimized for NQ/ES). It merges market flow, volume delta, session structure, and directional bias models into a single at-a-glance command panel.
Core Features:
Score / Bias Engine: Aggregates VWAP positioning, delta slope, and CVD structure to produce a live bias score (–5 → +5 scale) and simplified bias label (SBear → SBull).
State Monitor: Detects alignment or conflict between intraday bias and real-time flow. Highlights counter-trend conditions (“Use magnets / half size”) vs. aligned continuation.
Trap Detection (Dual):
Trap Short (shorts trapped, squeeze-up risk)
Trap Long (longs trapped, flush-down risk)
Color-coded strength meter indicates WATCH / TRAPPED / SQUEEZE.
Session CVD Table: Displays cumulative volume delta (CVD) and block delta by region — Asia / London / New York / Global — with auto-classified modes: Initiative Buy, Initiative Sell, Absorption, Distribution, or Neutral.
Flow Dominance Gauge: Tracks Global vs. Local momentum; signals when session flow diverges from the global CVD vector.
Price Anchors: Displays ON (overnight) high/low, RTH (regular trading hours) high/low, and prior session reference points (POC, VAH, VAL, HVN, LVN).
Capitulation T+1 Forecast: Computes early warning probability for next-day capitulation or squeeze events using volatility stretch, CVD intensity, control %, and score extremes. Direction marked with ↑ / ↓ arrow.
Futures / Flow Lower HUD (Optional): A cadence-based flow log showing Time, Px, VWAP, Δ, CVD, Bias, and Trap for the most recent 15-minute blocks — a micro-tape of intraday flow behavior.
Usage:
Primary HUD (top panel) → Real-time decision layer (bias, traps, state, cap-forecast).
Lower HUD (optional) → Historical flow context and confirmation.
Designed for use on 1m–15m charts, tuned for New York RTH bias detection.
Visual Key:
🟩 Green → Bullish continuation or trapped shorts
🟥 Red → Bearish continuation or trapped longs
🟧 Orange → Countertrend / Watch zone
⚫ Gray/Black → Neutral or no signal

Smart Liquidity 📊 # 💎 Smart Liquidity Indicator - User Guide
## 📋 Overview
**Smart Liquidity Indicator** is an advanced technical analysis tool for analyzing liquidity and volume in financial markets. It combines several powerful analytical tools to help you make informed trading decisions.
---
## 🎯 Main Components
### 1. 📊 Volume Profile
- **Function**: Displays volume distribution across different price levels
- **Benefit**: Identify strong support and resistance zones based on trading activity
- **Elements**:
- Colored boxes representing volume density at each level
- Labels showing HIGH/LOW of the price range
- PEAK FLOW line indicating the strongest volume level
### 2. 📦 Order Blocks
- **Function**: Identify bullish and bearish Order Block zones
- **Benefit**: Potential areas for price reversal or trend continuation
- **Displayed Information**:
- Delta %: Zone strength (difference between buying and selling pressure)
- Liquidity: Accumulated liquidity in the zone
- Buy/Sell ratios within the zone
### 3. 📈 SuperTrend (Market Direction)
- **Two lines for confirmation**:
- **🎯 Current SuperTrend** (Green/Red): Current timeframe direction
- **🔄 MTF SuperTrend** (Light Green/Red): Higher timeframe direction (4H default)
- **Benefit**: Trade with the overall market trend
### 4. 📊 Dashboard (Information Panel)
- Display current market status
- Trend and momentum information
- Active Order Blocks statistics
---
## 🚀 How to Use
### 1️⃣ **Reading Volume Profile**
- **Dense boxes** = High volume accumulation areas = Strong support/resistance
- **PEAK FLOW line** = Strongest price level (POC - Point of Control)
- **HIGH/LOW Labels** = Boundaries of the analyzed price range
### 2️⃣ **Analyzing Order Blocks**
- **Positive Delta (+)** = Strong buying pressure → Reliable bullish zone
- **Negative Delta (-)** = Strong selling pressure → Reliable bearish zone
- **Delta near 0** = Balance → Weak zone, avoid it
### 3️⃣ **Using SuperTrend**
- **Current TF (Green bullish / Red bearish)**: Current timeframe direction
- **MTF (Light Green bullish / Light Red bearish)**: Higher timeframe direction
- **Best Trading**: When both lines agree on the same direction
### 4️⃣ **Suggested Strategy**
```
✅ Strong Entry Signal:
1. Order Block with strong Delta (>30% or <-30%)
2. Current SuperTrend and MTF in the same direction
3. Volume Profile confirms the level (dense box or PEAK)
4. Price tests the zone for the first time
❌ Avoid Entry When:
- Weak Delta (between -10% and +10%)
- Conflict between Current and MTF SuperTrend
- Zone tested multiple times (weakened)
```
---
## 🎨 Understanding Colors
### Order Blocks
- 🟢 **Green**: Bullish Order Block
- 🔴 **Red**: Bearish Order Block
### SuperTrend
- 🟢 **Green**: Current SuperTrend bullish (same color as Order Blocks)
- 🔴 **Red**: Current SuperTrend bearish (same color as Order Blocks)
- 🟢 **Light Green**: MTF SuperTrend bullish
- 🔴 **Light Red**: MTF SuperTrend bearish
**Note**: Each SuperTrend has different transparency levels based on trend strength
### Volume Profile
- **Gradient from light to dark**: Represents volume density (darker = higher volume)
---
## ⚡ Performance Tips
### For Maximum Speed (Current Settings):
✅ **Enabled**:
- Order Blocks: 2 zones per side
- Volume Profile: 20 levels
- SuperTrends: Both active
- Strength Delta: Displayed
❌ **Disabled** (for speed):
- Gradient Fill
- Predictive Zones
- Background Fill
- MTF Calculations (in internal calculations)
### If Indicator is Slow:
1. Reduce `Profile Rows` from 20 → 15
2. Reduce `Lookback Period` from 50 → 40
3. Reduce `Max Zones` from 2 → 1
4. Turn off `Show OB Labels` if not needed
---
## 🔄 Additional Tools
### ♻️ Reset Now
- **Location**: Visual Tweaks
- **Usage**: If Volume Profile is cluttered, enable it to redraw
- **Note**: Disable after use
### 🎯 Draw Mode
- **Live**: Direct drawing on the last candle
- **Confirmed**: Draw only on closed candles (more stable)
---
## ⚠️ Disclaimer
### 🚨 Important Notice
**This indicator is a technical analysis tool only and is not considered financial advice or a trading recommendation.**
#### 📌 Please Note:
1. **Just an Analytical Tool**:
- The indicator provides technical information based on historical data
- Past results do not guarantee future results
2. **Personal Responsibility**:
- You are solely responsible for your own trading decisions
- Conduct your own research before making any investment decision
- Use appropriate risk management (Stop Loss, Position Sizing)
3. **No Guarantees**:
- There is no guarantee of profit or success in trading
- Financial markets carry high risks
- You may lose your entire invested capital
4. **Consult a Professional**:
- Consult a licensed financial advisor before making important investment decisions
- Ensure you fully understand the risks associated with trading
5. **Proper Use**:
- The indicator is designed as an assistive tool, not an automated trading system
- Preferably combine it with your own analysis and other tools
- Do not rely on a single signal alone
#### ⚖️ Acceptance:
By using this indicator, you acknowledge and agree that:
- The indicator developer is not responsible for any financial losses
- All trading decisions are your personal responsibility
- You understand the risks associated with trading in financial markets
---
## 💡 Final Advice
**"The best traders use tools wisely, not blindly"**
- Learn how the indicator works before relying on it
- Test settings on a demo account first
- Always use Stop Loss
- Don't risk more than you can afford to lose
---
## 📞 Contact and Support
**If you need any help or have any questions, feel free to contact me.**
I'm here to help you understand and use the indicator correctly! 🤝
---
**Good Luck & Trade Safe! 🚀📈**

OutsiderEdge - Adaptive Node Efficiency Function (ANEF)Overview - What is ANEF?
ANEF is a zero-centered oscillator that blends price efficiency, effective volume around VWAP (node proximity), order-flow imbalance (uptick/downtick proxy), and returns volatility into a single, normalized score. The goal is to help you spot efficient breakouts and inefficient mean-reversions in a way that’s transparent, systematic, and easy to align with your own analysis.
Users can combine ANEF’s components to build rules such as: “ Only consider short breakout signals when trend context is bearish and the ANEF score pushes into the Efficient Zone ,” or “ Look for mean-reversion setups when the ANEF score sinks into the Inefficient Zone while trend context remains bullish. ”
While ANEF can stand on its own, it also works well as a secondary confirmation layer to a user’s primary process (volume profile, price action, S/R, market structure, or your preferred overlays).
🔹 FEATURES
Below is each ANEF component/feature in the order that typically leads to the most confluence.
ANEF Core (Normalized Score)
Combines a price change term with effective volume near VWAP and order-flow imbalance, scaled by volatility and normalized into a zero-centered oscillator.
Read it like a pressure gauge: high positive values = efficient upside impulse risk; deep negative values = inefficient pressure that often reverts.
Efficient & Inefficient Zones (Thresholds)
Two user-set levels (default ≥ +4.6 and ≤ −4.6) to quickly see when ANEF pushes into efficient breakout territory (top zone) or inefficient territory (bottom zone).
Thresholds are not overbought/oversold; they’re contextual “efficiency bands.”
2nd-Signal Confirmation (Optional)
An opt-in rule to ignore the first signal of a type and only print the second occurrence within X bars (default 6).
Reduces one-off noise without repainting or lookahead.
Trend Context (EMA-based Wave, Optional)
A lightweight EMA context that lets you filter signals (e.g., only show ▼ in downtrend, only show ▲ in uptrend).
The context is plotted as a sub-pane wave centered around zero so it doesn’t fight for price-panel space.
Clean Alerts (Raw & Confirmed)
Raw alerts fire at zone interactions.
Confirmed alerts respect the 2nd-signal rule and (optionally) the trend filter.
Price-Panel Markers (through force_overlay)
Even with the oscillator in a separate pane, ANEF can print mini markers on the main chart.
Useful to correlate impulses/reversions with structure, S/R, or higher-TF levels.
🔹 USAGE
In the examples below, you see chart snapshot with five labeled points of (in)efficiency breakouts.
ICMARKETS:UK100
Point 1 — Efficient Downside Breakout (▼)
ANEF surges into the Efficient Zone, indicating downside momentum that’s aligned with node volume/imbalance and volatility. Typical use: trend-following continuation, takeprofit on existing long or tightening risk on existing shorts (invalidations above recent structure).
Point 2 — Inefficient Upside Reversion (▲)
First rebound after the selloff with ANEF deep in the Inefficient Zone. Not an ideal long entry on its own, but a good management cue: take partial profits on shorts or tighten stops as an early confirmation that the drop may be exhausting.
Point 3, 4 and 5 — Inefficient Upside Reversion (▲)
Another 3x ▲ appears as price forms a higher low and ANEF prints a less extreme negative reading. With the “second-signal within X bars” option enabled, this becomes a more credible mean-reversion attempt. Possible long entries or takeprofits on existing shorts.
Trading involves substantial risk. This tool is for educational purposes only and is not financial advice. Past performance does not guarantee future results. You are solely responsible for your trading decisions and risk management.
🔹 NAVIGATING MARKET CONDITIONS
Trending phases:
Expect more time in or near the zones in the trend direction.
Consider allowing only trend-aligned signals (filter ON) and using counter zone exits for trail/partials rather than counter-trend trades.
Ranging phases:
Expect frequent dips and surges into the (In)efficient Zones and back.
Counter-moves (▲ in range downs, ▼ in range ups) can be productive with tight invalidation and the 2nd-signal rule to reduce noise.
Regime shifts:
Watch for repeated failures of one side’s signals plus cross-pane confluence (e.g., context flips while ANEF re-anchors around zero).
That sequence often marks transitions where your rules should adapt (e.g., disable the trend filter temporarily or widen your 2nd-signal window).
🔹 SETTINGS SUMMARY
ANEF Core: lengthPrice, lengthVol, lengthVolat, imbalanceCap
Zones: Efficient (≥), Inefficient (≤)
Confirmation: Require 2nd signal, Lookahead bars
Trend Filter: Enable, EMA length, optional smoothing & “only show ▲/▼ with trend”
Chart Markers: Also show on main chart (force_overlay)
Alerts: Raw vs Confirmed (pick what suits your workflow)
🔹 GOOD PRACTICES
Treat signals as context cues, not as mechanical buy/sell calls. You can align ANEF with structure (S/R, HTF bias, LVN, HVN or POC) and risk management (partials on zone exit, invalidation beyond recent swing). Start with defaults; tweak parameters to match your market/TF.
🔹 LIMITATIONS / DISCLAIMER
ANEF does not use lookahead and does not repaint, but no indicator guarantees outcomes.
Thresholds are heuristics; markets can remain efficient/inefficient longer than expected.
Use appropriate position sizing and independent validation.
Trading involves substantial risk. This tool is for educational purposes only and is not financial advice. Past performance does not guarantee future results. You are solely responsible for your trading decisions and risk management.
Release Notes
v1.0 — Initial invite-only release with: normalized ANEF core, Efficient/Inefficient zones, optional EMA trend context, 2nd-signal confirmation, raw & confirmed alerts, and optional price-panel markers via force_overlay.

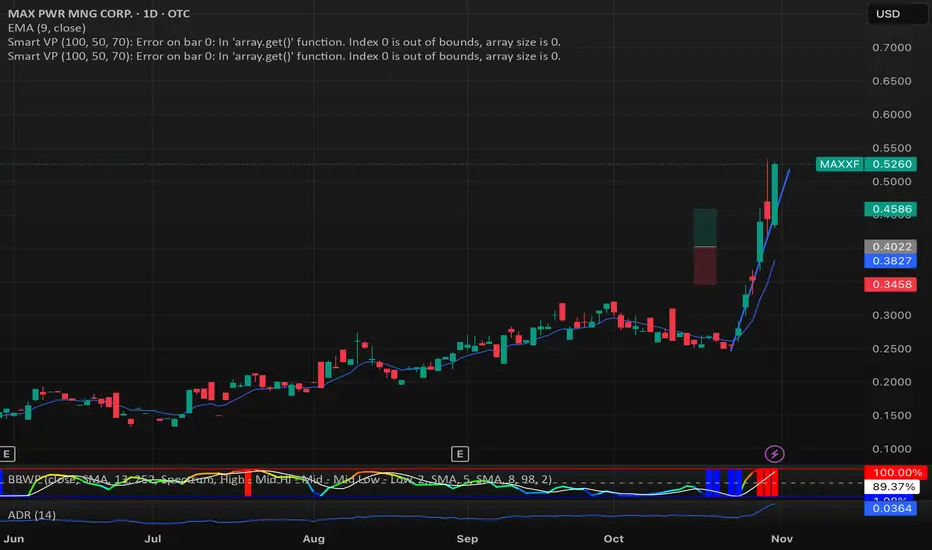
My Smart Volume Profile – Fixed
Title: 🔹 My Smart Volume Profile – Fixed
Description:
Lightweight custom Volume Profile showing POC, VAH, and VAL levels from recent bars. Highlights the value area, marks price touches, and supports optional alerts.
Developer Note:
Created with precision and simplicity by Magnergy

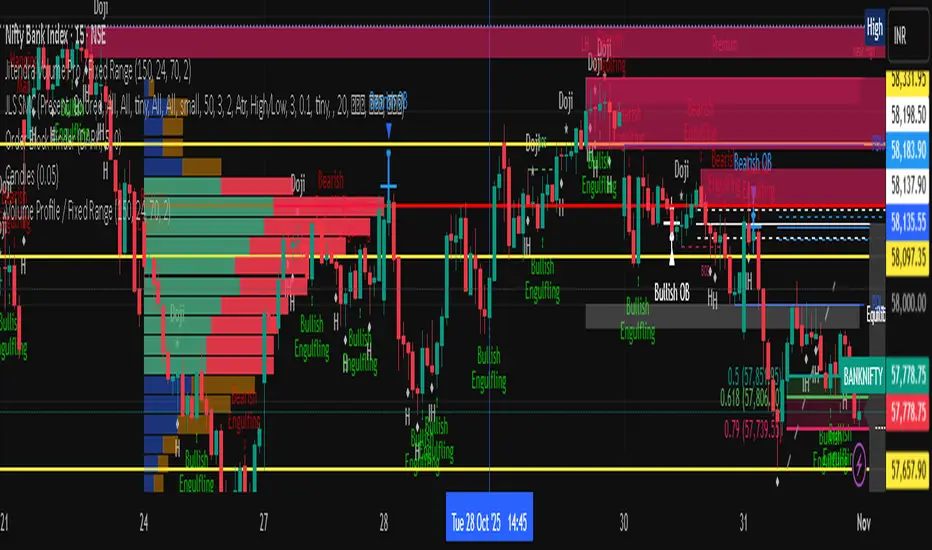
Jitendra Volume Pro / Fixed RangeHello All,
This script calculates and shows Volume Profile for the fixed range. Recently we have box.new() feature in Pine Language and it's used in this script as an example. Thanks to Pine Team and Tradingview!..
Sell/Buy volumes are calculated approximately!.
Options:
"Number of Bars" : Number of the bars that volume profile will be calculated/shown
"Row Size" : Number of the Rows
"Value Area Volume %" : the percent for Value Area
and there are other options for coloring and POC line style
Enjoy!
Jitendra Sankpal
Bull Run Galaxy
2.11.2025
3D Institutional Battlefield [SurgeGuru]Professional Presentation: 3D Institutional Flow Terrain Indicator
Overview
The 3D Institutional Flow Terrain is an advanced trading visualization tool that transforms complex market structure into an intuitive 3D landscape. This indicator synthesizes multiple institutional data points—volume profiles, order blocks, liquidity zones, and voids—into a single comprehensive view, helping you identify high-probability trading opportunities.
Key Features
🎥 Camera & Projection Controls
Yaw & Pitch: Adjust viewing angles (0-90°) for optimal perspective
Scale Controls: Fine-tune X (width), Y (depth), and Z (height) dimensions
Pro Tip: Increase Z-scale to amplify terrain features for better visibility
🌐 Grid & Surface Configuration
Resolution: Adjust X (16-64) and Y (12-48) grid density
Visual Elements: Toggle surface fill, wireframe, and node markers
Optimization: Higher resolution provides more detail but requires more processing power
📊 Data Integration
Lookback Period: 50-500 bars of historical analysis
Multi-Source Data: Combine volume profile, order blocks, liquidity zones, and voids
Weighted Analysis: Each data source contributes proportionally to the terrain height
How to Use the Frontend
💛 Price Line Tracking (Your Primary Focus)
The yellow price line is your most important guide:
Monitor Price Movement: Track how the yellow line interacts with the 3D terrain
Identify Key Levels: Watch for these critical interactions:
Order Blocks (Green/Red Zones):
When yellow price line enters green zones = Bullish order block
When yellow price line enters red zones = Bearish order block
These represent institutional accumulation/distribution areas
Liquidity Voids (Yellow Zones):
When yellow price line enters yellow void areas = Potential acceleration zones
Voids indicate price gaps where minimal trading occurred
Price often moves rapidly through voids toward next liquidity pool
Terrain Reading:
High Terrain Peaks: High volume/interest areas (support/resistance)
Low Terrain Valleys: Low volume areas (potential breakout zones)
Color Coding:
Green terrain = Bullish volume dominance
Red terrain = Bearish volume dominance
Purple = Neutral/transition areas
📈 Volume Profile Integration
POC (Point of Control): Automatically marks highest volume level
Volume Bins: Adjust granularity (10-50 bins)
Height Weight: Control how much volume affects terrain elevation
🏛️ Order Block Detection
Detection Length: 5-50 bar lookback for block identification
Strength Weighting: Recent blocks have greater impact on terrain
Candle Body Option: Use full candles or body-only for block definition
💧 Liquidity Zone Tracking
Multiple Levels: Track 3-10 key liquidity zones
Buy/Sell Side: Different colors for bid/ask liquidity
Strength Decay: Older zones have diminishing terrain impact
🌊 Liquidity Void Identification
Threshold Multiplier: Adjust sensitivity (0.5-2.0)
Height Amplification: Voids create significant terrain depressions
Acceleration Zones: Price typically moves quickly through void areas
Practical Trading Application
Bullish Scenario:
Yellow price line approaches green order block terrain
Price finds support in elevated bullish volume areas
Terrain shows consistent elevation through key levels
Bearish Scenario:
Yellow price line struggles at red order block resistance
Price falls through liquidity voids toward lower terrain
Bearish volume peaks dominate the landscape
Breakout Setup:
Yellow price line consolidates in flat terrain
Minimal resistance (low terrain) in projected direction
Clear path toward distant liquidity zones
Pro Tips
Start Simple: Begin with default settings, then gradually customize
Focus on Yellow Line: Your primary indicator of current price position
Combine Timeframes: Use the same terrain across multiple timeframes for confluence
Volume Confirmation: Ensure terrain peaks align with actual volume spikes
Void Anticipation: When price enters voids, prepare for potential rapid movement
Order Blocks & Voids Architecture
Order Blocks Calculation
Trigger: Price breaks fractal swing points
Bullish OB: When close > swing high → find lowest low in lookback period
Bearish OB: When close < swing low → find highest high in lookback period
Strength: Based on price distance from block extremes
Storage: Global array maintains last 50 blocks with FIFO management
Liquidity Voids Detection
Trigger: Price gaps exceeding ATR threshold
Bull Void: Low - high > (ATR200 × multiplier)
Bear Void: Low - high > (ATR200 × multiplier)
Validation: Close confirms gap direction
Storage: Global array maintains last 30 voids
Key Design Features
Real-time Updates: Calculated every bar, not just on last bar
Global Persistence: Arrays maintain state across executions
FIFO Management: Automatic cleanup of oldest entries
Configurable Sensitivity: Adjustable lookback periods and thresholds
Scientific Testing Framework
Hypothesis Testing
Primary Hypothesis: 3D terrain visualization improves detection of institutional order flow vs traditional 2D charts
Testable Metrics:
Prediction Accuracy: Does terrain structure predict future support/resistance?
Reaction Time: Faster identification of key levels vs conventional methods
False Positive Reduction: Lower rate of failed breakouts/breakdowns
Control Variables
Market Regime: Trending vs ranging conditions
Asset Classes: Forex, equities, cryptocurrencies
Timeframes: M5 to H4 for intraday, D1 for swing
Volume Conditions: High vs low volume environments
Data Collection Protocol
Terrain Features to Quantify:
Slope gradient changes at price inflection points
Volume peak clustering density
Order block terrain elevation vs subsequent price action
Void depth correlation with momentum acceleration
Control Group: Traditional support/resistance + volume profile
Experimental Group: 3D Institutional Flow Terrain
Statistical Measures
Signal-to-Noise Ratio: Terrain features vs random price movements
Lead Time: Terrain formation ahead of price confirmation
Effect Size: Performance difference between groups (Cohen's d)
Statistical Power: Sample size requirements for significance
Validation Methodology
Blind Testing:
Remove price labels from terrain screenshots
Have traders identify key levels from terrain alone
Measure accuracy vs actual price action
Backtesting Framework:
Automated terrain feature extraction
Correlation with future price reversals/breakouts
Monte Carlo simulation for significance testing
Expected Outcomes
If hypothesis valid:
Significant improvement in level prediction accuracy (p < 0.05)
Reduced latency in institutional level identification
Higher risk-reward ratios on terrain-confirmed trades
Research Questions:
Does terrain elevation reliably indicate institutional interest zones?
Are liquidity voids statistically significant momentum predictors?
Does multi-timeframe terrain analysis improve signal quality?
How does terrain persistence correlate with level strength?
LuxAlgo BigBeluga hapharmonic

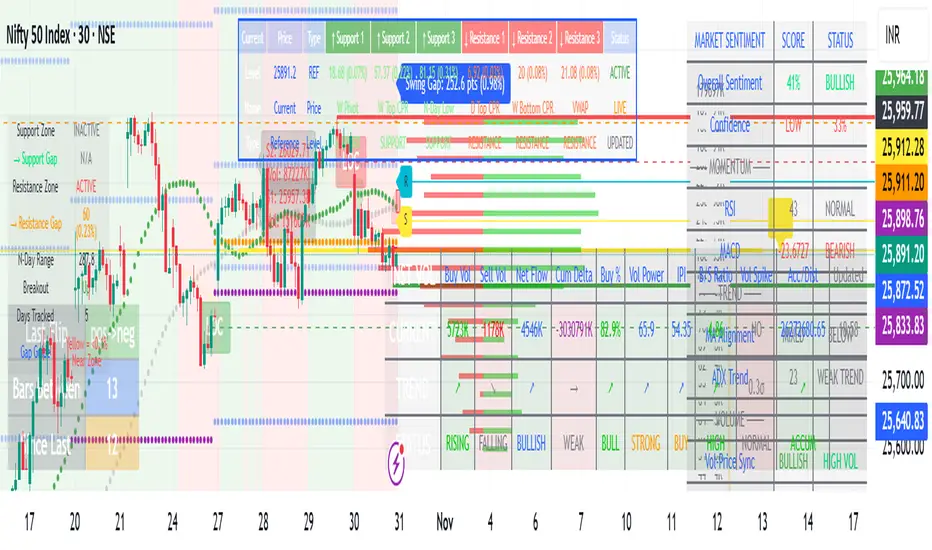
MARKET SCANNER Core Components:
1. Market Structure & Pivot Points
Multi-timeframe Pivots: Daily, Weekly, Monthly pivot points
Central Pivot Range (CPR): For all timeframes
N-Day High/Low Tracking: Dynamic support/resistance based on recent price action
2. Volume Analysis
Institutional Volume Metrics: Buy/Sell pressure, Net flow, Volume Power
Cumulative Delta: Tracks order flow imbalance
Volume Profile: Right-side profile with POC (Point of Control) and Value Area
Volume Strikes: Identifies significant volume absorption/breakout levels
3. Price Action & Patterns
Fibonacci-based Candlestick Recognition: Green/Red candles with specific Fibonacci conditions
Support/Resistance Zones: Dynamic boxes based on Fibonacci retracements
Breakout Detection: Tracks breakouts above N-day high/low with retracement levels
4. Moving Averages & VWAP
VWAP with multiple moving averages (20, 50, 250 periods)
MVWAP Sign Detection: Tracks flips in VWAP momentum
5. Market Sentiment Analysis
Composite Sentiment Score: Combines RSI, MACD, Stochastic, Moving Averages, ADX
Confidence Scoring: Measures signal reliability
Conflict Detection: Identifies when volume and price signals disagree
6. Advanced Features
Dynamic Gap Calculations: Measures distance to support/resistance zones
Swing Analysis: Identifies swing highs/lows with gap measurements
Volume-Price Confirmation: Validates moves with volume
Professional Tables: Multiple tables displaying pivot levels, differences, sentiment, and volume metrics
Key Trading Concepts Implemented:
Institutional Order Flow: Tracks smart money activity
Volume-Weighted Price Levels: Identifies significant price zones
Multi-timeframe Analysis: Correlates daily, weekly, monthly levels
Fibonacci Retracement Strategies: For entries and exits
Market Microstructure: Through volume profile and delta analysis
Visual Outputs:
Dynamic support/resistance boxes
Volume profile histogram
Multiple information tables
Real-time sentiment scoring
Retracement lines and zones
This is essentially a professional-grade trading suite that combines price action, volume analysis, market structure, and sentiment into one comprehensive tool suitable for both discretionary and systematic trading approaches.
Key Levels (PA, MAs, VWAPs, Volume Profile, rVWAPs)This indicator marks all kinds of key levels so that users can keep an overview of their specified levels in a convenient non chart cluttering way. It can highlight levels of confluence or display each level seperately.
The indicator includes markers for the following levels:
Price Action: Opens, Previous High/Low, Monday Range
Moving Averages: H4, D1 and W1 with customisable lengths
VWAPs: Developing and Previous VWAPs with their respective VAL/VAH (1 Standard Deviation)
Rolling VWAPs
Volume Profile: Developing and Previous VAL/VAH/POC
What makes this indicator different is its vast customisation options and big library of levels…
… users can choose to merge all levels that are aligned in a specified % threshold and additionally they can choose to color them the same color to highlight confluence levels.
… users have the choice between Full Label Markers or Abbreviations of those Labels.
… users have the choice of a few presets making level switching fast and convenient (Price Action, Volume Profile, VWAP, Volume or Custom).
… users can specify if they prefer to highlight Simple Moving Averages or Exponential Moving Averages. They have calculations available on three different timeframes and can change the lengths of each.
… users can color all levels the same with one click instead of having to manually change all of them.
… when users choose Volume Profile Levels they can either let the script auto calculate the row size making asset switching simple or they can manually input row size.
With the custom preset users can show and hide whichever levels they want.
(To have them the same every time you freshly load the indicator save your settings as default in the lower left corner of the settings tab).
Purpose
This indicator is designed to serve as a level visualisation tool that has the ability to highlight levels of confluence. It may assist in keeping an overview of where all levels are currently located but does not produce signals or trade recommendations.

Volume Profile - Previous Day Levels The green lines and area represent previous day Value Area. The values are not completely identical to Trading View default levels because of difference in calculation.
The white lines represent the min-max prices during the initial balance (9:30 to 10:30 EST). The diagnoal lines cannot be removed unfortunately.
You can also see same day evolving Valuea area and POC for momentum analysis.

Volume Profile, Pivot Anchored by DGT - reviewedVolume Profile, Pivot Anchored by DGT - reviewed
This indicator, “Volume Profile, Pivot Anchored”, builds a volume profile between swing highs and lows (pivot points) to show where trading activity is concentrated.
It highlights:
Value Area (VAH / VAL) and Point of Control (POC)
Volume distribution by price level
Pivot-based labels showing price, % change, and volume
Optional colored candles based on volume strength relative to the average
Essentially, it visualizes how volume is distributed between market pivots to reveal key price zones and volume imbalances.

RSI VWAP v1 [JopAlgo]RSI VWAP v1.1 made stronger by volume-aware!
We know there's nothing new and the original RSI already does an excellent job. We're just working on small, practical improvements – here's our take: The same basic idea, clearer display, and a single, specially developed rolling line: a VWAP of the RSI that incorporates volume (participation) into the calculation.
Do you prefer the pure classic?
You can still use Wilder or Cutler engines –
but the star here is the VW-RSI + rolling line.
This RSI also offers the possibility of illustrating a possible
POC (Point of Control - or the HAL or VAL) level.
However, the indicator does NOT plot any of these levels itself.
We have included an illustration in the chart for this!
We hope this version makes your decision-making easier.
What you’ll see
The RSI line with a 50 midline and optional bands: either static 70/30 or adaptive μ±k·σ of the Rolling Line.
One smoothing concept only: the Rolling Line (light blue) = VWAP of RSI.
Shadow shading between RSI and the Rolling Line (green when RSI > line, red when RSI < line).
A lighter tint only on the parts of that shadow that sit above the upper band or below the lower band (quick overbought/oversold context).
Simple divergence lines drawn from RSI pivots (green for regular bullish, red for regular bearish). No labels, no buy/sell text—kept deliberately clean.
What’s new, and why it helps
VW-RSI engine (default):
RSI can be computed from volume-weighted up/down moves, so momentum reflects how much traded when price moved—not just the direction.
Rolling Line (VWAP of RSI) with pure VWAP adaptation:
Low volume: blends toward a faster VWAP so early, thin starts aren’t missed.
Volume spikes: blends toward a slower VWAP so a single heavy bar doesn’t whip the curve.
You can reveal the Base Rolling (pre-adaptation) line to see exactly how much adaptation is happening.
Adaptive bands (optional):
Instead of fixed 70/30, use mean ± k·stdev of the Rolling Line over a lookback. Levels breathe with the market—useful in strong trends where static bounds stay pinned.
Minimal, readable panel:
One smoothing, one story. The shadow tells you who’s in control; the lighter highlight shows stretch beyond your lines.
How to read it (fast)
Bias: RSI above 50 (and a rising Rolling Line) → bullish bias; below 50 → bearish bias.
Trigger: RSI crossing the Rolling Line with the bias (e.g., above 50 and crossing up).
Stretch: Near/above the upper band, avoid chasing; near/below the lower band, avoid panic—prefer a cross back through the line.
Divergence lines: Use as context, not as standalone signals. They often help you wait for the next cross or avoid late entries into exhaustion.
Settings that actually matter
RSI Engine: VW-RSI (default), Wilder, or Cutler.
Rolling Line Length: the VWAP length on RSI (higher = calmer, lower = earlier).
Adaptive behavior (pure VWAP):
Speed-up on Low Volume → blends toward fast VWAP (factor of your length).
Dampen Spikes (volume z-score) → blends toward slow VWAP.
Fast/Slow Factors → how far those fast/slow variants sit from the base length.
Bands: choose Static 70/30 or Adaptive μ±k·σ (set the lookback and k).
Visuals: show/hide Base Rolling (ref), main shadow, and highlight beyond bands.
Signal gating: optional “ignore first bars” per day/session if you dislike open noise.
Starter presets
Scalp (1–5m): RSI 9–12, Rolling 12–18, FastFactor ~0.5, SlowFactor ~2.0, Adaptive on.
Intraday (15m–1H): RSI 10–14, Rolling 18–26, Bands k = 1.0–1.4.
Swing (4H–1D): RSI 14–20, Rolling 26–40, Bands k = 1.2–1.8, Adaptive on.
Where it shines (and limits)
Best: liquid markets where volume structure matters (majors, indices, large caps).
Works elsewhere: even with imperfect volume, the shadow + bands remain useful.
Limits: very thin/illiquid assets reduce the benefit of volume-weighting—lengthen settings if needed.
Attribution & License
Based on the concept and baseline implementation of the “Relative Strength Index” by TradingView (Pine v6 built-in).
Released as Open-source (MPL-2.0). Please keep the license header and attribution intact.
Disclaimer
For educational purposes only; not financial advice. Markets carry risk. Test first, use clear levels, and manage risk. This project is independent and not affiliated with or endorsed by TradingView.

Ram HTF Direction & Market ProfileRam HTF Direction & Markey Profile.
I am trying to identify the HTF(Daily) Direction and Market profiles POC,VAL,VAH to trade on 1HR.

EMA / WMA RibbonMomentum Flow Ribbon
Unlock a clear, visual edge in identifying short-term momentum shifts with the Momentum Flow Ribbon.
This indicator was born from a simple yet powerful concept: to visually represent the dynamic relationship between a fast-reacting Exponential Moving Average (EMA) and the smoother, more methodical Wilder's Moving Average (WMA). While both moving averages use the same length, their unique calculation methods cause them to separate and cross, creating a "ribbon" that provides an immediate and intuitive gauge of market momentum.
This tool is designed for the disciplined trader who values clean charts and actionable signals, helping you to execute your strategies with greater confidence and precision.
How It Works
The script plots an EMA and a Wilder's Moving Average (referred to as rma in Pine Script) of the same length. The space between these two lines is then filled with a colored ribbon:
Bullish Green/Teal: The ribbon turns bullish when the faster EMA crosses above the slower Wilder's MA, indicating that short-term momentum is strengthening to the upside.
Bearish Red: The ribbon turns bearish when the EMA crosses below the Wilder's MA, signaling that short-term momentum is shifting to the downside.
The inherent "lag" of the Wilder's MA, a feature designed by J. Welles Wilder Jr. himself, acts as a steady baseline against which the more sensitive EMA can be measured. The result is a simple, zero-lag visual that filters out insignificant noise and highlights meaningful changes in trend direction.
Key Features
Customizable Length and Source: Easily adjust the moving average length and price source (close, hl2, etc.) to fit your specific trading style and the instrument you are trading, from futures like MES and MNQ to cryptocurrencies and forex.
Customizable Colors: Tailor the ribbon's bullish and bearish colors to match your personal chart aesthetic.
Built-in Alerts: The script includes pre-configured alerts for both bullish (EMA crosses above WMA) and bearish (EMA crosses below WMA) signals. Never miss a potential momentum shift again.
Clean & Lightweight: No clutter. Just a simple, effective ribbon that integrates seamlessly into any trading system.
Practical Application for the Discerning Trader
For a futures trader, timing is everything. This ribbon is not just another indicator; it's a tool for confirmation.
Imagine you've identified a key level—a Volume Profile POC, the previous day's low, or a critical accumulation zone. As price approaches this level pre-London session, you're watching for a sign of institutional activity. A flip in the ribbon's color at that precise moment can provide the powerful confirmation you need to enter a trade, trusting that you are aligning with the building liquidity and momentum heading into the New York open.
This is a tool for those who aspire to greatness in their trading—who understand that the edge is found not in complexity, but in the flawless execution of a simple, well-defined plan.
Add the Momentum Flow Ribbon to your chart and start seeing momentum in a clearer light.

Simple TPODisplays price distribution over time using Time Price Opportunities (TPO). Shows Point of Control (POC), Value Area High/Low (VAH/VAL) levels to identify key support/resistance zones and fair value areas. Includes customizable timeframes and price breakout alerts.

Perp Imbalance Zones • Pro (clean)USD Premium (perp vs spot) → (Perp − Spot) / Spot.
Imbalance (z-score of that premium) → how extreme the current premium is relative to its own history over lenPrem bars.
Hysteresis state machine → flips to a SHORT bias when perp-long pressure is extreme; flips to LONG bias when perp-short pressure is extreme. It exits only after the imbalance cools (prevents whipsaw).
Price stretch filter (±σ) → optional Bollinger check so signals only fire when price is already stretched.
HTF confirmation (optional) → require higher-timeframe imbalance to agree with the current-TF bias.
Gradient visuals → line + background tint deepen as |z| grows (more extreme pressure).
What you see on the pane
A single line (z):
Above 0 = perp richer than spot (perp longs pressing).
Below 0 = perp cheaper than spot (perp shorts pressing).
Guides: dotted levels at ±enterZ (entry) and ±exitZ (cool-off/exit).
Background tint:
Red when state = SHORT bias (perp longs heavy).
Blue when state = LONG bias (perp shorts heavy).
Tint intensity scales with |z| (via hotZ).
Labels (optional): prints when bias flips.
Alerts (optional): “Enter SHORT/LONG bias” and “Exit bias”.
How to use it (playbook)
Attach & set symbols
Put the script on your chart.
Set Spot symbol and Perp symbol to the venue you trade (e.g., BINANCE:BTCUSDT + BINANCE:BTCUSDTPERP).
Read the bias
SHORT bias (red background): perp longs over-extended. Look for short entries if price is at resistance, σ-stretched, or your PA system agrees.
LONG bias (blue background): perp shorts over-extended. Look for long entries at support/σ-stretched down.
Entries
Use the bias flip as a context/confirm. Combine with your structure trigger (OB/level sweep, rejection wick, micro-break in market structure, etc.).
If useSigma=true, only trade when price is already ≥ upper band (shorts) or ≤ lower band (longs).
Exits
Bias auto-exits when |z| falls below exitZ.
You can also take profits at your levels or when the line fades back toward 0 while price mean-reverts to the middle band.
Tuning (what each knob does)
enterZ / exitZ (signal strictness + hysteresis)
Higher enterZ → fewer, cleaner signals (e.g., 1.8–2.2).
exitZ should be lower than enterZ (e.g., 0.6–1.0) to prevent flicker.
lenPrem (context window for z)
Larger (50–100) = steadier baseline, fewer signals.
Smaller (20–30) = more reactive, more signals.
smoothLen (EMA on z)
2–3 = snappier; 5–7 = smoother/laggier but cleaner.
useSigma, bbLen, bbK (price-stretch filter)
On filters chop. Try bbLen=100, bbK=1.0–1.5.
Off if you want more frequent signals or you already gate with your own σ/Keltner.
useHTF, htfTF, htfZmin (trend/confirmation)
Turn on to require higher-TF imbalance agreement (e.g., trading 1H → confirm with 4H htfTF=240, htfZmin≈0.6–1.0).
hotZ (visual intensity)
Lower (2.0–2.5) heats up faster; higher (4.0) is more subtle.
Ready-made presets
Conservative swing (fewer, higher-conviction):
enterZ=2.0, exitZ=1.0, lenPrem=60–80, smoothLen=5, useSigma=true, bbK=1.5, useHTF=true (240/0.8).
Balanced intraday (default feel):
enterZ=1.6–1.8, exitZ=0.8–1.0, lenPrem=50, smoothLen=3–4, useSigma=true, bbK=1.0–1.25, useHTF=false/true depending on trendiness.
Aggressive scalping (more signals):
enterZ=1.2–1.4, exitZ=0.6–0.8, lenPrem=20–30, smoothLen=2–3, useSigma=false, useHTF=false.
Practical tips
Don’t trade the line in isolation. Use it to time trades into your levels: VWAP bands, Monday high/low, prior POC/VAH/VAL, order blocks, etc.
Perp-led reversals often snap—be ready to scale out quickly back to mid-bands.
Venue matters. Keep spot & perp from the same exchange family to avoid cross-venue quirks.
Alerts: enable after you’ve tuned thresholds for your timeframe so you only get high-quality pings.
