BullBear with Volume-Percentile TP - Strategy [presentTrading] Happy New Year, everyone! I hope we have a fantastic year ahead.
It's been a while since I published an open script, but it's time to return.
This strategy introduces an indicator called Bull Bear Power, combined with an advanced take-profit system, which is the main innovative and educational aspect of this script. I hope all of you find some useful insights here. Welcome to engage in meaningful exchanges. This is a versatile tool suitable for both novice and experienced traders.
█ Introduction and How it is Different
Unlike traditional strategies that rely solely on price or volume indicators, this approach combines Bull Bear Power (BBP) with volume percentile analysis to identify optimal entry and exit points. It features a dynamic take-profit mechanism based on ATR (Average True Range) multipliers adjusted by volume and percentile factors, ensuring adaptability to diverse market conditions. This multifaceted strategy not only improves signal accuracy but also optimizes risk management, distinguishing it from conventional trading methods.
BTCUSD 6hr performance
Disable the visualization of Bull Bear Power (BBP) to clearly view the Z-Score.
█ Strategy, How it Works: Detailed Explanation
The BBP Strategy with Volume-Percentile TP utilizes several interconnected components to analyze market data and generate trading signals. Here's an overview with essential equations:
🔶 Core Indicators and Calculations
1. Exponential Moving Average (EMA):
- **Purpose:** Smoothens price data to identify trends.
- **Formula:**
EMA_t = (Close_t * (2 / (lengthInput + 1))) + (EMA_(t-1) * (1 - (2 / (lengthInput + 1))))
- Usage: Baseline for Bull and Bear Power.
2. Bull and Bear Power:
- Bull Power: `BullPower = High_t - EMA_t`
- Bear Power: `BearPower = Low_t - EMA_t`
- BBP:** `BBP = BullPower + BearPower`
- Interpretation: Positive BBP indicates bullish strength, negative indicates bearish.
3. Z-Score Calculation:
- Purpose: Normalizes BBP to assess deviation from the mean.
- Formula:
Z-Score = (BBP_t - bbp_mean) / bbp_std
- Components:
- `bbp_mean` = SMA of BBP over `zLength` periods.
- `bbp_std` = Standard deviation of BBP over `zLength` periods.
- Usage: Identifies overbought or oversold conditions based on thresholds.
🔶 Volume Analysis
1. Volume Moving Average (`vol_sma`):
vol_sma = (Volume_1 + Volume_2 + ... + Volume_vol_period) / vol_period
2. Volume Multiplier (`vol_mult`):
vol_mult = Current Volume / vol_sma
- Thresholds:
- High Volume: `vol_mult > 2.0`
- Medium Volume: `1.5 < vol_mult ≤ 2.0`
- Low Volume: `1.0 < vol_mult ≤ 1.5`
🔶 Percentile Analysis
1. Percentile Calculation (`calcPercentile`):
Percentile = (Number of values ≤ Current Value / perc_period) * 100
2. Thresholds:
- High Percentile: >90%
- Medium Percentile: >80%
- Low Percentile: >70%
🔶 Dynamic Take-Profit Mechanism
1. ATR-Based Targets:
TP1 Price = Entry Price ± (ATR * atrMult1 * TP_Factor)
TP2 Price = Entry Price ± (ATR * atrMult2 * TP_Factor)
TP3 Price = Entry Price ± (ATR * atrMult3 * TP_Factor)
- ATR Calculation:
ATR_t = (True Range_1 + True Range_2 + ... + True Range_baseAtrLength) / baseAtrLength
2. Adjustment Factors:
TP_Factor = (vol_score + price_score) / 2
- **vol_score** and **price_score** are based on current volume and price percentiles.
Local performance
🔶 Entry and Exit Logic
1. Long Entry: If Z-Score crosses above 1.618, then Enter Long.
2. Short Entry: If Z-Score crosses below -1.618, then Enter Short.
3. Exiting Positions:
If Long and Z-Score crosses below 0:
Exit Long
If Short and Z-Score crosses above 0:
Exit Short
4. Take-Profit Execution:
- Set multiple exit orders at dynamically calculated TP levels based on ATR and adjusted by `TP_Factor`.
█ Trade Direction
The strategy determines trade direction using the Z-Score from the BBP indicator:
- Long Positions:
- Condition: Z-Score crosses above 1.618.
- Short Positions:
- Condition: Z-Score crosses below -1.618.
- Exiting Trades:
- Long Exit: Z-Score drops below 0.
- Short Exit: Z-Score rises above 0.
This approach aligns trades with prevailing market trends, increasing the likelihood of successful outcomes.
█ Usage
Implementing the BBP Strategy with Volume-Percentile TP in TradingView involves:
1. Adding the Strategy:
- Copy the Pine Script code.
- Paste it into TradingView's Pine Editor.
- Save and apply the strategy to your chart.
2. Configuring Settings:
- Adjust parameters like EMA length, Z-Score thresholds, ATR multipliers, volume periods, and percentile settings to match your trading preferences and asset behavior.
3. Backtesting:
- Use TradingView’s backtesting tools to evaluate historical performance.
- Analyze metrics such as profit factor, drawdown, and win rate.
4. Optimization:
- Fine-tune parameters based on backtesting results.
- Test across different assets and timeframes to enhance adaptability.
5. Deployment:
- Apply the strategy in a live trading environment.
- Continuously monitor and adjust settings as market conditions change.
█ Default Settings
The BBP Strategy with Volume-Percentile TP includes default parameters designed for balanced performance across various markets. Understanding these settings and their impact is essential for optimizing strategy performance:
Bull Bear Power Settings:
- EMA Length (`lengthInput`): 21
- **Effect:** Balances sensitivity and trend identification; shorter lengths respond quicker but may generate false signals.
- Z-Score Length (`zLength`): 252
- **Effect:** Long period for stable mean and standard deviation, reducing false signals but less responsive to recent changes.
- Z-Score Threshold (`zThreshold`): 1.618
- **Effect:** Higher threshold filters out weaker signals, focusing on significant market moves.
Take Profit Settings:
- Use Take Profit (`useTP`): Enabled (`true`)
- **Effect:** Activates dynamic profit-taking, enhancing profitability and risk management.
- ATR Period (`baseAtrLength`): 20
- **Effect:** Shorter period for sensitive volatility measurement, allowing tighter profit targets.
- ATR Multipliers:
- **Effect:** Define conservative to aggressive profit targets based on volatility.
- Position Sizes:
- **Effect:** Diversifies profit-taking across multiple levels, balancing risk and reward.
Volume Analysis Settings:
- Volume MA Period (`vol_period`): 100
- **Effect:** Longer period for stable volume average, reducing the impact of short-term spikes.
- Volume Multipliers:
- **Effect:** Determines volume conditions affecting take-profit adjustments.
- Volume Factors:
- **Effect:** Adjusts ATR multipliers based on volume strength.
Percentile Analysis Settings:
- Percentile Period (`perc_period`): 100
- **Effect:** Balances historical context with responsiveness to recent data.
- Percentile Thresholds:
- **Effect:** Defines price and volume percentile levels influencing take-profit adjustments.
- Percentile Factors:
- **Effect:** Modulates ATR multipliers based on price percentile strength.
Impact on Performance:
- EMA Length: Shorter EMAs increase sensitivity but may cause more false signals; longer EMAs provide stability but react slower to market changes.
- Z-Score Parameters:*Longer Z-Score periods create more stable signals, while higher thresholds reduce trade frequency but increase signal reliability.
- ATR Multipliers and Position Sizes: Higher multipliers allow for larger profit targets with increased risk, while diversified position sizes help in securing profits at multiple levels.
- Volume and Percentile Settings: These adjustments ensure that take-profit targets adapt to current market conditions, enhancing flexibility and performance across different volatility environments.
- Commission and Slippage: Accurate settings prevent overestimation of profitability and ensure the strategy remains viable after accounting for trading costs.
Conclusion
The BBP Strategy with Volume-Percentile TP offers a robust framework by combining BBP indicators with volume and percentile analyses. Its dynamic take-profit mechanism, tailored through ATR adjustments, ensures that traders can effectively capture profits while managing risks in varying market conditions.
在腳本中搜尋"profit"

Liquitive Buy/Sell Dollar AveragerLiquitive Buy/Sell Dollar Averager Indicator
The "Liquitive Buy/Sell Dollar Averager" is a versatile trading tool designed for intraday and multi-timeframe analysis, combining advanced range-bound calculations, RSI normalization, volume spikes, and candle pattern recognition to identify optimal buy and sell conditions. This indicator is particularly suitable for traders employing strategies that focus on dollar-cost averaging, position scaling, and systematic buy/sell decision-making.
Key Features:
Adaptive RSI-Based Levels:
Dynamically calculates inner bounds (IB) and outer bounds (OB) using RSI and price ranges, helping to identify overbought and oversold conditions relative to the price action.
Normalizes RSI values to the price range for seamless visualization overlaid on the chart.
Volume and Candle Analysis:
Detects significant volume spikes relative to a moving average, signaling increased market activity.
Identifies spiking green/red candles to capture momentum-driven price movements.
Dynamic Support and Resistance:
Calculates and plots support and resistance levels based on recent swing highs and lows.
Median and boundary lines help visualize key price levels for decision-making.
Profitability Check:
Buy and Sell Signals:
Checks profitability thresholds based on percentage gains/losses.
Incorporates logic for "time to buy" and "time to sell" using target profit margins.
Implements average move percentage to define realistic thresholds for buy/sell actions.
Time-Based Trading Restrictions:
Configures trading logic to disallow trades after a specific time (e.g., 3:40 PM for intraday sessions).
Ensures logical entry and exit decisions are only made within active trading hours.
Color-Coded Visualization:
Background colors dynamically shift between green (bullish), red (bearish), and neutral, depending on RSI and price position relative to the inner bounds.
Opacity of the background adjusts based on normalized RSI differences to provide a visual cue of market strength.
Customizable Parameters:
Allows user input for key settings like lookback periods, RSI length, percent ranges, volume thresholds, and transparency levels, enabling flexible configuration tailored to individual strategies.
Actionable Alerts and Signals:
Plots "Open Position", "Add to Position", and "Close Position" markers directly on the chart, making it easy to follow systematic trading rules.
How It Works:
Buy Signals:
Triggered when price conditions, volume spikes, and RSI-based thresholds align with profitability metrics.
Designed for dollar-cost averaging, identifying opportunities to add to long positions or open new positions.
Sell Signals:
Evaluates profitability conditions to identify when to close or scale out of positions.
Incorporates real-time evaluation of market momentum and profitability.

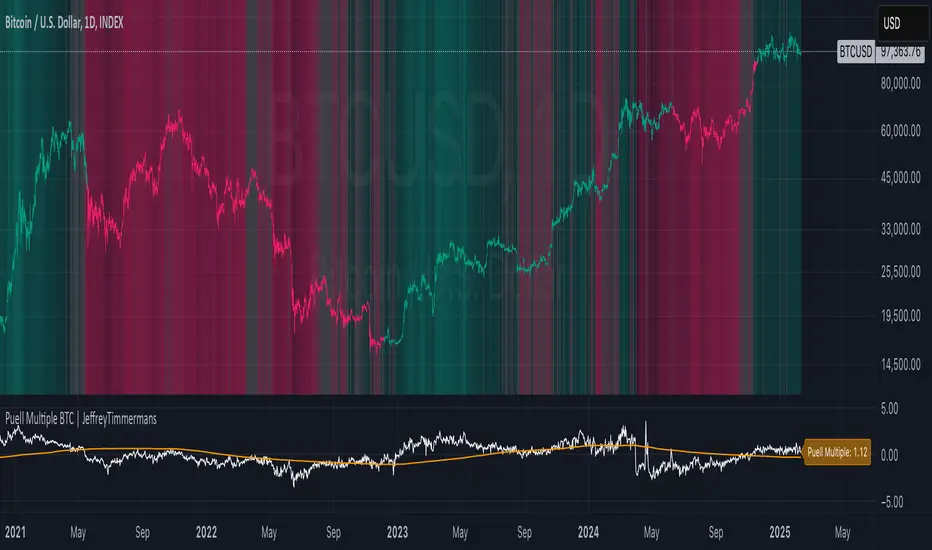
Puell Multiple BTC | JeffreyTimmermansThe Puell Multiple is a metric that assesses the relationship between mining profitability and market cycles. It is calculated by comparing the daily value of newly issued coins (USD) to the 365-day moving average of daily coin issuance (USD).
This indicator works best on the 1D BTC Chart. When interpreting the Puell Multiple, it can generally be understood as follows:
High values indicate that miner profitability is significantly higher than the yearly average. This may lead to an increased incentive for miners to sell off their holdings, putting additional selling pressure on the market.
Low values suggest that miner profitability is lower than the yearly average. In this case, miners might experience financial strain, causing some to reduce their hash power by shutting down mining rigs. This, in turn, can reduce the number of coins being sold into the market, as remaining miners need to liquidate fewer coins to maintain operations, thereby decreasing the impact on the liquid supply.
The Puell Multiple is a metric used primarily in the cryptocurrency space, specifically for Bitcoin, to assess whether Bitcoin is overvalued or undervalued in relation to its mining rewards. It helps to gauge the profitability of miners and, by extension, to assess market conditions.
Use:
This Puell Multiple is invented for Long-Term, Trend Following Systems.
The Puell Multiple trend can be visualized through the color of the bars, which represents the direction of the trend, while the background indicates the strength of that trend.
Bar Color: The color of the bars typically changes to reflect whether the trend is bullish or bearish. For example, green bars may indicate a strong bullish trend, while red bars signal a bearish or declining trend. The color coding helps to quickly interpret the market's overall movement in relation to mining profitability.
Background Color: The background of the chart is used to reflect the strength of the trend. A darker or more intense background may signify a stronger trend, indicating that the market conditions are more pronounced, while a lighter background can suggest a weaker or more uncertain trend, showing less certainty in the market’s direction.
Together, the combination of bar color and background provides a clearer picture of both the trend's direction and its strength, making it easier to assess potential market behavior based on miner profitability and market cycles.
Puell Multiple and Moving Average: They can be used as an extra tool to confirm the bullish or bearish trend. When the Puell Multiple is above the Moving Average, this will suggest and confirm that the trend is bullish.
How you score this for your own systems is up to you.
-Jeffrey

Custom Dual EMA Crossover Strategy with Configurable LogicThis strategy is designed to assist traders in identifying and capitalizing on bullish market trends through a systematic and data-driven approach. It incorporates detailed trend analysis, volatility filtering, and percentage-based thresholds to provide actionable insights and high-confidence trade setups. It leverages the Exponential Moving Average and combines it with custom logic to detect volatility, maximum allowed price movements over last bars and trend confirmation.
Key Features:
- Buy orders follow several conditions, including but not limited to:
a. EMA Crossover: specifically designed to capture immediate market shifts rather than medium- or long-term trends, ensuring responsiveness to rapidly changing conditions but requiring additional confirmations to avoid false signals (see below).
b. Thresholds in Price Changes: Ensures recent price fluctuations remain within specific thresholds, allowing trades to be entered at optimal times and avoiding delayed or unsustainable short-term bullish trends.
c. Adequate Market Volatility: Requires sufficient market activity to avoid false signals stemming from low volatility conditions.
d. Bullish Medium-Term Trend: Validates a bullish medium-term trend using an EMA crossover to avoid trading during bearish market conditions and minimize risk.
- Leverages Take profit and Stop loss levels
- Implements an optional mechanism to automatically close trades after a predefined number of bars, supporting disciplined trade management.
The script does not rely on any public scripts or indicators. Apart the EMA, all the underlying logic, including the volatility thresholds and filtering mechanisms, has been custom developed to ensure originality and precision. The strategy's conditions are all configurable by the user in the TradingView pop-up, allowing it to adapt to different assets and timeframes. For example, users can set the EMA lengths to align with long-term trends for cryptocurrencies or adjust volatility thresholds to account for the specific price movement behavior of stocks or forex pairs.
---
Recommendations:
- Identify a crypto asset with potential
- Before live trading, rigorously backtest your strategy on the chosen asset and interval over a period of at least one year*, analyzing results, refining parameters' value and eventually changing timeframe and / or asset.
- Refine your approach until you achieve consistent profitability with a high win rate. Balance the two — a high win rate is great, but only if your profits outweigh your losses in the long term.
- Once successful, remain disciplined and adhere to the parameters that yield the best results. Set up TradingView alerts to trigger real-time actions via your preferred trading bot. Alerts can be set up on the Indicator, which mirrors the strategy's logic and enables users to execute real-time actions effectively. I will provide you access to the Indicator, as well as the Strategy.
* Alternatively, you can apply the strategy to a shorter period for tactical use. While this approach may increase short-term opportunities (e.g. strong bullish short term movements), it also comes with heightened risks.
Use Cases:
- Suitable for traders focusing on bullish or range-bound markets.
- Ideal for short to medium-term trading horizons.
Access and Configuration Support:
This is an invite-only script. For access, please reach out directly for subscription details. I also provide guidance on configuring the strategy with real-world examples to optimize its use for various assets, intervals and timeframes.
---
Disclaimer:
This script is a tool to support trading decisions and does not guarantee profitability. Past performance does not indicate future results. Trading carries inherent risks; always trade responsibly and manage risk accordingly.
MACD Aggressive Scalp SimpleComment on the Script
Purpose and Structure:
The script is a scalping strategy based on the MACD indicator combined with EMA (50) as a trend filter.
It uses the MACD histogram's crossover/crossunder of zero to trigger entries and exits, allowing the trader to capitalize on short-term momentum shifts.
The use of strategy.close ensures that positions are closed when specified conditions are met, although adjustments were made to align with Pine Script version 6.
Strengths:
Simplicity and Clarity: The logic is straightforward and focuses on essential scalping principles (momentum-based entries and exits).
Visual Indicators: The plotted MACD line, signal line, and histogram columns provide clear visual feedback for the strategy's operation.
Trend Confirmation: Incorporating the EMA(50) as a trend filter helps avoid trades that go against the prevailing trend, reducing the likelihood of false signals.
Dynamic Exit Conditions: The conditional logic for closing positions based on weakening momentum (via MACD histogram change) is a good way to protect profits or minimize losses.
Potential Improvements:
Parameter Inputs:
Make the MACD (12, 26, 9) and EMA(50) values adjustable by the user through input statements for better customization during backtesting.
Example:
pine
Copy code
macdFast = input(12, title="MACD Fast Length")
macdSlow = input(26, title="MACD Slow Length")
macdSignal = input(9, title="MACD Signal Line Length")
emaLength = input(50, title="EMA Length")
Stop Loss and Take Profit:
The strategy currently lacks explicit stop-loss or take-profit levels, which are critical in a scalping strategy to manage risk and lock in profits.
ATR-based or fixed-percentage exits could be added for better control.
Position Size and Risk Management:
While the script uses 50% of equity per trade, additional options (e.g., fixed position sizes or risk-adjusted sizes) would be beneficial for flexibility.
Avoid Overlapping Signals:
Add logic to prevent overlapping signals (e.g., opening a new position immediately after closing one on the same bar).
Backtesting Optimization:
Consider adding labels or markers (label.new or plotshape) to visualize entry and exit points on the chart for better debugging and analysis.
The inclusion of performance metrics like max drawdown, Sharpe ratio, or profit factor would help assess the strategy's robustness during backtesting.
Compatibility with Live Trading:
The strategy could be further enhanced with alert conditions using alertcondition to notify the trader of buy/sell signals in real-time.

LETF Leveraged Edge Strategy v1.5Overview
The strategy is based on Stochastics to detect trends and then makes Buys and Sell based on custom entry and exit criteria as described below in the Execution Logic Rules section. It will NOT work with standard Stochastics.
This is not a standard Stochastics implementation. It has been customized and modified, and does not match any widely known Stochastics variations (like Fast, Slow, or Full Stochastics) in its smoothing and iterative calculation process with:
• A unique smoothing mechanism.
• Iterative calculations.
• Additional conditional logic for strategy execution.
This strategy is designed to focus on volatile, liquid leveraged ETFs to capture gains equal to or better than Buy and Hold, and mitigate the risk of trading with a goal of reducing drawdown to a lot less than Buy and Hold. It has had successful backtest performance to varying degrees with TQQQ, SOXL, FNGU, TECL, FAS, UPRO, NAIL and SPXL. Results have not been good on other LETFs that have been backtested.
Performance
In this backtest the Net Profit shows to be $4,561 or 45.61%. Considering the initial order size was $1,000 I have to wonder if the Strategy Tester is calculating this correctly. The Strategy Tester Performance Summary shows the Buy and Hold Return at $61,165 or 611.7%. Based on calculating the price of the last shares sold, less the price paid, times the number of initial shares purchased, my math shows the Buy and Hold Gain at $4,572 or about equal with the strategy performance in this case. The Performance Summary also states the strategy had a Max DD of 3.46% which I believe is incorrect. Based on other backtests I’ve done, I believe the strategy drawdown here was closer to 28.4% and the Buy and Hold Drawdown at 82.7%. I manually calculated the Buy and Hold drawdown.
How it Works
The author provides training and support resource materials for this at his website. The strategy execution logic is driven by these rules:
Execution Logic Rules
Buy the LETF When:
BR #1a) The Daily Fast Line (FL) crosses above the Daily Slow Line (SL) and the FL is between the Low (L*) and High (H*) Range set (often referred to as Oversold and Overbought Lines). This can execute (Buy) any trading day of the week.
BR #1b) Re-Buy the next day after any Stop or Take Profit Sell if the Buy Rule condition is true (FL is above SL), if not, remain in cash and wait for the next Buy Signal.
Sell the LETF When:
SR #1a) The Daily Fast Line (FL) crosses below Daily Slow Line (SL) within the Low (L*) and High (H*) Range (often referred to as Oversold and Overbought Lines). “Crossunder Range Exit” This can execute (Sell) any trading day of the week.
SR #1b) If the (FL) crosses Below the SL above the Exit Level*, wait. Only Sell if the FL drops down below the Exit Level* “Crossunder Level Exit” This can execute (Sell) any trading day of the week.
SR #2a) Sell at the open any day the gap-down price is at or below the 1-Day Stop%*, based on previous day’s closing price (Execute on the day it happens.)
SR #2b) Sell intraday any day the price is at or below the 1-Day Stop %*, based on previous day’s closing price (Execute on the day it happens.)
SR #3a) Sell at the open any day the price is at or below the Trailing Stop %*, based on highest intraday price since Buy date (Execute on the day it happens.)
SR #3b) Sell intraday any day the price is at or below the Trailing Stop%*, based on highest intraday price since Buy date (Execute on the day it happens.)
SR #4) Sell any day when the opening price exceeds, or intraday price meets the Profit Target % price* (Execute on the day it happens.)
SR #5) After each Sell go to Rule BR #1b to determine if a Re-Buy should occur the next day, or stay in cash until next Buy Signal
Settings:
Properties Tab – Initial Capital has been set to $10,000 and order size 10% of Equity, 0.1% commission and 3 Ticks for slippage. Net order size is $1,000
Input Tab:
Stochastic
Timeframe is selected to Daily or Weekly based on preference. Daily has more trades, but on average higher profitability.
Type: Proprietary (best selection for most LETFs, but a few will work better with the Full selection
%k Length 20, %K Smoothing 14, %D Smoothing (many LETFs work better with a specific Stoch setting, often each different) A List of these is provided for your starting point.
Trade Settings
Direction: Longs (This strategy only works on the Long side)
Stop Type: Trailing is recommended, but Fixed is an option.
Stop % (based on user risk tolerance)
PD Stop % (Suggest start at 5%. Based on volatility of LETF and is a stop percentage from prior day’s close. Designed to protect against sudden market volatility. Will need to balance between strategy performance and user risk tolerance)
Profit Target: User preference. (I can help with suggestions based on historical performance)
Entry/Exit Conditions
Enter on Tie: Default Checked – if a Fast line crosses a Slow line for a Buy signal, but doesn’t do so in the range set, this will trigger if it crosses at a tie.
Renter – Default Checked – If stopped out of a position, this tells the strategy to re-buy the position the next day if the conditions are still positive.
Exit Level: This is a exit level for a Fast cross below a Slow line that takes place above the Sell Range, but only happens if the Fast continues down to the level set. These usually don’t happen often, but can have a significant impact on performance. Unfortunately, it’s a trial and error process starting with 90 and working down to see if there’s any positive impact.
Trade Range
Buy Range: Start at typical 20 to 80. Expand the low end down first to check on performance impact. Normally a wide buying range is better for performance.
Sell Range: Start at 20 to 80 and tighten gradually to see performance impact. In some cases a very tight sell range does better. I have worked on our primary LETFs for many months to determine ranges for each that typically produce better results.
External Indicator: Some additional indicators have a positive impact on the strategy performance by increasing P/l, reducing drawdown and reducing the number of trades. This is not always the case and each LETF and time period for the LETF will have a bearing on whether the secondary indicator will help or not. Two that have helped are the MACD Histogram, and the Sloe-Velocity Indicator by Kamleshkumar43. Sometimes a couple of different indicators will have a positive impact, then it’s a personal preference which you pick to use with the strategy.
Since this strategy is focused on a very narrow selection of liquid LETFs, I have a lot of experience experimenting with the settings for the primary ones and can suggest things that will help. Additional training on the rules, working with the settings, and mitigating some of the negative trades during choppy markets is available at the website.
Chart
The strategy can be selected to use either a Daily or Weekly version of stochastic. This is important because the characteristics are different while still generating very good gains and minimal drawdowns. Generally, the daily stochastic will have a greater number of, and certainly more frequent, trades than the weekly stochastic. However, on average the daily version of the stochastic will generates greater profitability.
The Settings tabs have tooltip icons that will assist in inputting values that correspond to the written rules for the strategy, and some include specific rule detail.
Buying
The strategy generates Buy signals with the Fast line crossing over the Slow line within a “Buy Range” which is adjusted based on volatility of the leveraged ETF. This is unique in that a default is set for these entries to occur if the values are tied and doesn’t need to be within the high and low range if that occurs. The trader can select in the strategy for this to occur the same day, if he’s selected a Daily Stochastic timeframe, or at the end of the trading week if he’s selected a Weekly stochastic timeframe. The volatility of a leveraged ETF will sometimes cause a shake-out exit, a trailing stop can be hit, or there can be an exit based on taking a profit. A big part of the timing challenge was how to handle these. The strategy normally (set as a default) will immediately re-buy the next day only if the original buy conditions are still true. This helps capture gains when conditions are still favorable but keeps the trader out when they’re not.
Selling
Exits are handled in several ways. The strategy will exit if there is a fast line cross below a slow line within the “range”. The range is adjusted based on volatility of the leveraged ETF. The exit occurs at the close of the day if the trader has selected to use a Daily stochastic setting. The exit will occur at the end of the trading week if the trader has chosen a weekly stochastic strategy. The trader will set a level based on the instrument and volatility for another exit type. The level will sometimes coincide with the range exit high level but does not need to. If a fast line crosses down through a slow line above the level set, and then comes down to that level, the strategy will exit the position.
Another unique aspect of the strategy is the PD Stop setting. This is short for “Prior Day”, Rather than a normal stop based on the price paid for a position, the PD Stop is based on a percentage drop from the previous day’s closing price. This helps account for the volatility of the leveraged ETF and will cause an exit quickly if there’s a market, or index moving event. This helps capture gains and reduce risk should there be continued pullback.
Exits will also occur based on setting a trailing stop level and profit taking level. These are adjusted based on the leveraged ETFs volatility and historical performance.
Limitations
Choppy, or sideways markets are the most prone to poor performance and potential for being stopped out multiple times. If stopped out two consecutive times, make sure you’re monitoring market health and there are clear signs of a new uptrend such as a 10D and 21D MA in proper alignment and moving up. If you get a Buy signal from the strategy and you’re not confident yet about market and price direction then it’s fine to wait a day, or several days, to enter after the Buy signal when you have greater confidence about market direction. The author can help with a short list of tactical rules developed for these sideways or choppy markets.
This strategy has proven successful backtest results with a very limited set of LETFs as discussed earlier. The author does not know if it will prove successful with any others, or other types of ETFs such as 2X or plain ETFs. A lot more testing needs to be done.
The strategy buys and sells , excluding stops or take profit, at the market close. It can be very challenging to enter an order at market close.
Disclaimer
Please remember that past performance may not be indicative of future results.
Due to various factors, including changing market conditions, the strategy may no longer perform as well as in historical backtesting. This post and the script do not provide any financial advice and are for educational and entertainment purposes only.

Liquid Pours XtremeStrategy Description: Liquid Pours Xtreme
The Liquid Pours Xtreme is an innovative trading strategy that combines the analysis of specific time-based patterns with price comparisons to identify potential opportunities in the forex market. Designed for traders seeking a structured methodology based on clear rules, this strategy offers integration with Telegram for real-time alerts and provides visual tools to enhance trade management.
Key Features:
Analysis of Specific Time Patterns: The strategy captures and compares closing prices at two key moments during the trading day, identifying recurring patterns that may indicate future market movements.
Dynamic SL and TP Levels Implementation: Utilizes tick-based calculations to set Stop-Loss and Take-Profit levels, adapting to the current market volatility.
Advanced Telegram Integration: Provides detailed alerts including information such as the asset, signal time, entry price, and SL/TP levels, facilitating real-time decision-making.
Complete Customization: Allows users to adjust key parameters, including operation schedules, weekdays, and visual settings, adapting to different trading styles.
Enhanced Chart Visualization: Includes visual elements like candle color changes based on signal state, event markers, and halos to highlight important moments.
Default Strategy Properties: Specific configuration for optimal risk management and simulation.
How the Strategy Works
Capturing Prices at Key Moments:
- The strategy records the closing price at two user-defined specific times. These times typically correspond to periods of high market volatility, such as the opening of the European session and the US pre-market.
- Rationale: Volatility and trading volume usually increase during these times, presenting opportunities for significant price movements.
Generating Signals Based on Price Comparison:
- Buy Signal: If the second closing price is lower than the first, it indicates possible accumulation and is interpreted as a bullish signal.
- Sell Signal: If the second closing price is higher than the first, it suggests possible distribution and is interpreted as a bearish signal.
- Signals are only generated on selected trading days, allowing you to avoid days with lower liquidity or higher risk.
Calculating Dynamic SL and TP Levels:
- Stop-Loss (SL) and Take-Profit (TP) levels are calculated based on the entry price and a user-defined number of ticks, adapting to market volatility.
- The strategy offers the option to base these levels on the close of the signal candle or the open of the next candle, providing flexibility according to the trader's preference.
- SL and TP boxes are drawn on the chart for visual reference, facilitating trade management.
Automatic Execution and Alerts:
- Upon signal generation, the strategy automatically executes a market order (buy or sell).
- Sends a detailed alert to your Telegram channel, including essential information for quick decision-making.
Visual Elements:
- Colors candles based on the signal state: buy, sell, or neutral, allowing for quick trend identification.
- Provides a smooth color transition between signal states and uses markers and halos to highlight important events and signals on the chart.
Trade Management:
- Manages open trades with automatic exit conditions based on the established SL and TP levels.
- Includes mechanisms to prevent exceeding TradingView's limitations on boxes and labels, ensuring optimal script performance.
Originality and utility:
- This strategy incorporates a unique approach focusing on specific time patterns and their relationship to institutional activity in the market.
How to Use the Strategy
Add the Script to the Chart:
- Go to the indicators menu in TradingView.
- Search for " Liquid Pours Xtreme " and add it to your chart.
Set Up Telegram Alerts:
- Enter your Telegram Chat ID in the script parameters to receive alerts.
- Customize the Buy and Sell alert messages as desired.
Configure Time Patterns:
- Set the hours and minutes for the two times you want to compare closing prices, aligning them with relevant market sessions or events.
Set SL and TP Parameters:
- Define the number of ticks for the Stop-Loss and Take-Profit levels, adapting them to the asset you're trading and your risk tolerance.
- Choose the basis for SL and TP calculation (close of the signal candle or open of the next candle).
Select Trading Days:
- Enable or disable trading on specific days of the week, allowing you to avoid days with lower activity or unexpected volatility.
Customize Visual Elements:
- Adjust the colors and styles of visual elements to enhance readability and suit your personal preferences.
Monitor the Strategy:
- Observe the chart for signals and use Telegram alerts to stay informed of new opportunities, even when you're not at your terminal.
Testing and Optimization:
- Use TradingView's backtesting features to evaluate the historical performance of the strategy with different parameters.
- Adjust and optimize the parameters based on the results and your own analysis.
Adjust the Strategy Properties:
- Ensure that the strategy properties (order size, commission, slippage) are aligned with your trading account and platform to obtain realistic results.
Strategy Properties (Important)
This script backtest is conducted on M30 EURUSD , using the following backtesting properties:
Initial Capital: $10,000
Order Size: 50,000 Contracts (equivalent to 0.5% of the capital)
Commission: $0.20 per order
Slippage: 1 tick
Pyramiding: 1 order
Verify Price for Limit Orders: 0 ticks
Recalculate on Order Execution: Enabled
Recalculate on Every Tick: Enabled
Recalculate After Order Filled: Enabled
Bar Magnifier for Backtesting Precision: Enabled
We use these properties to ensure a realistic preview of the backtesting system. Note that default properties may vary for different reasons:
- Order Size: It is essential to calculate the contract size according to the traded asset and desired risk level.
- Commission and Slippage: These costs can vary depending on the market and instrument; there is no default value that might return realistic results.
We strongly recommend all users adjust the Properties within the script settings to align with their accounts and trading platforms to ensure the results from the strategies are realistic.
Backtesting Results:
- Net Profit: $4,037.50 (40.37%)
- Total Closed Trades : 292
- Profitability Percentage: 26.71%
- Profit Factor: 1.369
- Max Drawdown: $769.30 (6.28%)
- Average Trade: $13.83 (0.03%)
- Average Bars in Trades: 11
These results were obtained under the mentioned conditions and properties, providing an overview of the strategy's historical performance.
Interpreting Results:
- The strategy has demonstrated profitability in the analyzed period, although with a win rate of 26.71%, indicating that success relies on a favorable risk-reward ratio.
- The profit factor of 1.369 suggests that total gains exceed total losses by that proportion.
- It is crucial to consider the maximum drawdown of 6.28% when evaluating the strategy's suitability to your risk tolerance.
Risk Warning:
Trading leveraged financial instruments carries a high level of risk and may not be suitable for all investors. Before deciding to trade, you should carefully consider your investment objectives, level of experience, and risk tolerance. Past performance does not guarantee future results. It is essential to conduct additional testing and adjust the strategy according to your needs.
---
What Makes This Strategy Original?
Time-Based Pattern Approach: Unlike conventional strategies, this strategy focuses on identifying time patterns that reflect institutional activity and macroeconomic events that can influence the market.
Advanced Technological Integration: The combination of automatic execution and customized alerts via Telegram provides an efficient and modern tool for active traders.
Customization and Adaptability: The wide range of adjustable parameters allows the strategy to be tailored to different assets, time zones, and trading styles.
Enhanced Visual Tools: Incorporated visual elements facilitate quick market interpretation and informed decision-making.
Additional Considerations
Continuous Testing and Optimization: Users are encouraged to perform additional backtesting and optimize parameters according to their own observations and requirements.
Complementary Analysis: Use this strategy in conjunction with other indicators and fundamental analysis to reinforce decision-making.
Rigorous Risk Management: Ensure that SL and TP levels, as well as position sizing, align with your risk management plan.
Updates and Support: I am committed to providing updates and improvements based on community feedback. For inquiries or suggestions, feel free to contact me.
---
Example Configuration
Assuming you want to use the strategy with the following parameters:
Telegram Chat ID: Your unique Telegram Chat ID
First Time (Hour:Minute): 6:30
Second Time (Hour:Minute): 7:30
SL Ticks: 100
TP Ticks: 400
SL and TP Basis: Close of the Signal Candle
Trading Days: Tuesday, Wednesday, Thursday
Simulated Initial Capital: $10,000
Risk per Trade in Simulation: $50 (-0.5% of capital)
Slippage and Commissions in Simulation: 1 tick of slippage and $0.20 commission per trade
---
Conclusion
The Liquid Pours Xtreme strategy offers an innovative approach by combining specific time analysis with robust risk management and modern technological tools. Its original and adaptable design makes it valuable for traders looking to diversify their methods and capitalize on opportunities based on less conventional patterns.
Ready for immediate implementation in TradingView, this strategy can enrich your trading arsenal and contribute to a more informed and structured approach to your operations.
---
Final Disclaimer:
Financial markets are volatile and can present significant risks. This strategy should be used as part of a comprehensive trading approach and does not guarantee positive results. It is always advisable to consult with a professional financial advisor before making investment decisions.
---

Skeleton Key LiteSkeleton Key Lite Strategy
Note : Every input, except for the API Alerts, depends on an external indicator to provide the necessary values for the strategy to function.
Definitions
Strategy Direction: The trading direction (long or short) as determined by an external source, such as an indicator.
Threshold Conditions:
- Enter Condition: Defines the condition for entering a trade.
- Exit Condition: Defines the condition for exiting a trade.
Stop Loss (SL):
- Trail SL: A trailing stop loss, dynamically updated during the trade.
- Basic SL: A static stop loss level.
- Emergency SL (ER SL): A fallback stop loss for extreme conditions.
- Max SL: The maximum risk tolerance in stop loss.
- Limit SL: A predefined stop loss that is executed as a limit order.
Take Profit (TP):
- Max TP: The maximum profit target for a trade.
- Limit TP: A predefined take profit level executed as a limit order.
API Alerts:
- API Entry: JSON-based configuration for sending entry signals.
- API Exit: JSON-based configuration for sending exit signals.
Broad Concept
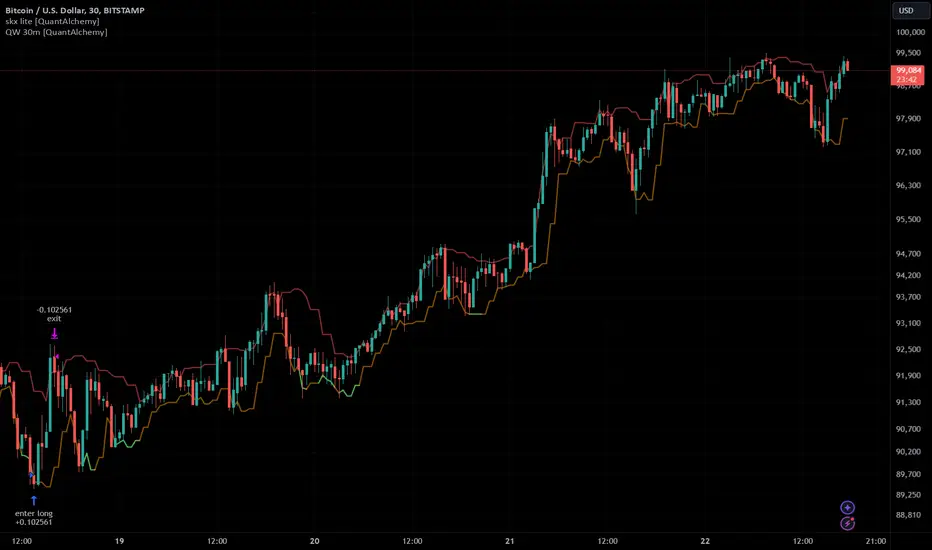
The Skeleton Key Lite strategy script is designed to provide a generalized framework for orchestrating trade execution based on external indicators. It allows QuantAlchemy and others to encapsulate strategies into indicators, which can then be backtested and automated using this strategy script.
Inputs
Note : All inputs are dependent on external indicators for values except for the API Alerts.
Strategy Direction:
- Source: Direction signal from an external indicator.
- Options: `LONG` (`1`), `SHORT` (`-1`).
Trade Conditions:
- Enter: Source input, trigger for entry condition.
- Exit: Source input, trigger for exit condition.
Stops and Take Profits:
- Trail SL: Enable/disable dynamic trailing stop loss.
- Basic SL: Enable/disable static stop loss.
- Emergency SL: Enable/disable emergency stop loss.
- Max SL: Enable/disable maximum risk stop loss.
- Max TP: Enable/disable maximum take profit.
- Limit SL: Enable/disable predefined stop loss executed as a limit order.
- Limit TP: Enable/disable predefined take profit executed as a limit order.
Alerts:
- API Entry: Configurable JSON message for entry signals.
- API Exit: Configurable JSON message for exit signals.
How It Works
Trade Logic:
- Conditions for entering and exiting trades are evaluated based on the selected input sources.
Stop Loss and Take Profit Management:
- Multiple stop loss types (trailing, basic, emergency, etc.) and take profit levels are calculated dynamically during the trade entry. Trailing stop loss is updated during the trade based on the selected input.
API Alerts:
- Alerts are triggered using customizable JSON messages, which can be integrated with external trading systems or APIs.
Trade Execution:
- Enter: Initiates a new trade if entry conditions are met and there is no open position.
- Exit: Closes all trades if exit conditions are met or stop loss/take profit thresholds are hit.
Key Features
Customizable: Fully configurable entry and exit conditions based on external indicators.
Encapsulation: Integrates seamlessly with indicators, allowing strategies to be developed as indicator-based signals.
Comprehensive Risk Management:
- Multiple stop loss and take profit options.
- Emergency stop loss for unexpected conditions.
API Integration: Alerts are designed to interface with external systems for automation and monitoring.
Plots
The script plots key variables on the chart for better visualization:
Enter and Exit Signals:
- `enter`: Displays when the entry condition is triggered.
- `exit`: Displays when the exit condition is triggered.
Risk Management Levels:
- `trailSL`: Current trailing stop loss level.
- `basicSL`: Static stop loss level.
- `erSL`: Emergency stop loss level.
- `maxSL`: Maximum risk stop loss level.
Profit Management Levels:
- `maxTP`: Maximum take profit level.
- `limitTP`: Limit-based take profit level.
Limit Orders:
- `limitSL`: Limit-based stop loss level.
- `limitTP`: Limit-based take profit level.
Proposed Interpretations
Entry and Exit Points:
- Use the plotted signals (`enter`, `exit`) to analyze the trade entry and exit points visually.
Risk and Profit Levels:
- Monitor the stop loss (`SL`) and take profit (`TP`) levels to assess trade performance.
Dynamic Trail SL:
- Observe the `trailSL` to evaluate how the trailing stop adapts during the trade.
Limitations
Dependence on Indicators:
- This script relies on external indicators to provide signals for strategy execution.
No Indicator Included:
- Users must integrate an appropriate indicator for source inputs.
Back-Test Constraints:
- Back-testing results depend on the accuracy and design of the integrated indicators.
Final Thoughts
The Skeleton Key Lite strategy by QuantAlchemy provides a robust framework for automated trading by leveraging indicator-based signals. Its flexibility and comprehensive risk management make it a valuable tool for traders seeking to implement and backtest custom strategies.
Disclaimer
This script is for educational purposes only. Trading involves risk, and past performance does not guarantee future results. Use at your own discretion and risk.
XAUUSD Trend Strategy### Description of the XAUUSD Trading Strategy with Pine Script
This strategy is designed to trade gold (**XAUUSD**) using proven technical analysis principles. It combines key indicators such as **Exponential Moving Averages (EMA)**, the **Relative Strength Index (RSI)**, and **Bollinger Bands** to identify trading opportunities in trending market conditions.
---
#### Objective:
To maximize profits by identifying trend-aligned entry points while minimizing risks through well-defined Stop Loss and Take Profit levels.
---
### How It Works
1. **Indicators Used:**
- **Exponential Moving Averages (EMA):** Tracks short-term and long-term trends to confirm market direction.
- **Relative Strength Index (RSI):** Detects overbought or oversold conditions for potential reversals or trend continuation.
- **Bollinger Bands:** Measures volatility to identify breakout or reversion points.
2. **Entry Rules:**
- **Long (Buy):** Triggered when:
- The short-term EMA crosses above the long-term EMA (bullish trend confirmation).
- RSI exits oversold territory (<30), signaling buying momentum.
- The price breaks above the upper Bollinger Band, indicating a strong trend.
- **Short (Sell):** Triggered when:
- The short-term EMA crosses below the long-term EMA (bearish trend confirmation).
- RSI exits overbought territory (>70), signaling selling momentum.
- The price breaks below the lower Bollinger Band, indicating a strong downtrend.
3. **Risk Management:**
- **Stop Loss:** Automatically calculated based on a percentage of equity risk (customizable via inputs).
- **Take Profit:** Defined using a risk-to-reward ratio, ensuring consistent profitability when trades succeed.
4. **Visualization:**
- The chart displays the EMAs, Bollinger Bands, and entry/exit points for clear analysis.
---
### Key Features:
- **Customizable Parameters:** You can adjust EMAs, RSI thresholds, Bollinger Band settings, and risk levels to suit your trading style.
- **Alerts:** Automatic alerts for potential trade setups.
- **Backtesting-Ready:** Easily test historical performance on TradingView.
---
This strategy is ideal for gold traders looking for a systematic, rule-based approach to trading trends with minimal emotional interference.

Multi Fibonacci Supertrend with Signals【FIbonacciFlux】Multi Fibonacci Supertrend with Signals (MFSS)
Overview
The Multi Fibonacci Supertrend with Signals (MFSS) is an advanced technical analysis tool that combines multiple Supertrend indicators using Fibonacci ratios to identify trend directions and potential trading opportunities.
Key Features
1. Fibonacci-Based Supertrend Levels
* Factor 1 (Weak) : 0.618 - The golden ratio
* Factor 2 (Medium) : 1.618 - The Fibonacci ratio
* Factor 3 (Strong) : 2.618 - The extension ratio
2. Visual Components
* Multi-layered Trend Lines
* Different line weights for easy identification
* Progressive transparency from Factor 1 to Factor 3
* Color-coded trend directions (Green for bullish, Red for bearish)
* Dynamic Fill Areas
* Gradient fills between price and trend lines
* Visual representation of trend strength
* Automatic color adjustment based on trend direction
* Signal Indicators
* Clear BUY/SELL labels on chart
* Position-adaptive signal placement
* High-visibility color scheme
3. Signal Generation Logic
The system generates signals based on two key conditions:
* Primary Condition :
* BUY : Price crossunder Supertrend2 (Factor 1.618)
* SELL : Price crossover Supertrend2 (Factor 1.618)
* Confirmation Filter :
* Signals only trigger when Supertrend3 confirms the trend direction
* Reduces false signals in volatile markets
Technical Details
Input Parameters
* ATR Period : 10 (default)
* Customizable for different market conditions
* Affects sensitivity of all Supertrend levels
* Factor Settings :
* All factors are customizable
* Default values based on Fibonacci sequence
* Minimum value: 0.01
* Step size: 0.01
Alert System
* Built-in alert conditions
* Customizable alert messages
* Real-time notification support
Use Cases
* Trend Trading
* Identify strong trend directions
* Filter out weak signals
* Confirm trend continuations
* Risk Management
* Multiple trend levels for stop-loss placement
* Clear entry and exit signals
* Trend strength visualization
* Market Analysis
* Multi-timeframe analysis capability
* Trend strength assessment
* Market structure identification
Benefits
* Reliability
* Based on proven Supertrend algorithm
* Enhanced with Fibonacci mathematics
* Multiple confirmation levels
* Clarity
* Clear visual signals
* Easy-to-interpret interface
* Reduced noise in signal generation
* Flexibility
* Customizable parameters
* Adaptable to different markets
* Suitable for various trading styles
Performance Considerations
* Optimized code structure
* Efficient calculation methods
* Minimal resource usage
Installation and Usage
Setup
* Add indicator to chart
* Adjust parameters if needed
* Enable alerts as required
Best Practices
* Use with other confirmation tools
* Adjust factors based on market volatility
* Consider timeframe appropriateness
Backtesting Results and Strategy Performance
This indicator is specifically designed for pullback trading with optimized risk-reward ratios in trend-following strategies. Below are the detailed backtesting results from our proprietary strategy implementation:
BTCUSDT Performance (Binance)
* Test Period: Approximately 7 years
* Risk-Reward Ratio: 2:1
* Take Profit: 8%
* Stop Loss: 4%
Key Metrics (BTCUSDT):
* Net Profit: +2,579%
* Total Trades: 551
* Win Rate: 44.8%
* Profit Factor: 1.278
* Maximum Drawdown: 42.86%
ETHUSD Performance (Binance)
* Risk-Reward Ratio: 4.33:1
* Take Profit: 13%
* Stop Loss: 3%
Key Metrics (ETHUSD):
* Net Profit: +8,563%
* Total Trades: 581
* Win Rate: 32%
* Profit Factor: 1.32
* Maximum Drawdown: 55%
Strategy Highlights:
* Optimized for pullback trading in strong trends
* Focus on high risk-reward ratios
* Proven effectiveness in major cryptocurrency pairs
* Consistent performance across different market conditions
* Robust profit factor despite moderate win rates
Note: These results are from our proprietary strategy implementation and should be used as reference only. Individual results may vary based on market conditions and implementation.
Important Considerations:
* The strategy demonstrates strong profitability despite lower win rates, emphasizing the importance of proper risk-reward ratios
* Higher drawdowns are compensated by significant overall returns
* The system shows adaptability across different cryptocurrencies with consistent profit factors
* Results suggest optimal performance in volatile crypto markets
Real Trading Examples
BTCUSDT 4-Hour Chart Analysis
Example of pullback strategy implementation on Bitcoin, showing clear trend definition and entry points
ETHUSDT 4-Hour Chart Analysis
Ethereum chart demonstrating effective signal generation during strong trends
BTCUSDT Detailed Signal Example (15-Minute Scalping)
Close-up view of signal generation and trend confirmation process on 15-minute timeframe, demonstrating the indicator's effectiveness for scalping operations
Chart Analysis Notes:
* Green and red zones clearly indicate trend direction
* Multiple timeframe confirmation visible through different Supertrend levels
* Clear entry signals during pullbacks in established trends
* Precise stop-loss placement opportunities below support levels
Implementation Guidelines:
* Wait for main trend confirmation from Factor 3 (2.618)
* Enter trades on pullbacks to Factor 2 (1.618)
* Use Factor 1 (0.618) for fine-tuning entry points
* Place stops below the relevant Supertrend level
Footnotes:
* Charts provided are from Binance exchange, using both 4-hour and 15-minute timeframes
* Trading view screenshots captured during actual market conditions
* Indicators shown: Multi Fibonacci Supertrend with all three factors
* Time period: Recent market activity showing various market conditions
Important Notice:
These charts are for educational purposes only. Past performance does not guarantee future results. Always conduct your own analysis and risk management.
Disclaimer
This indicator is for informational purposes only. Past performance is not indicative of future results. Always conduct proper risk management and due diligence.
License
Open source under MIT License
Author's Note
Contributions and suggestions for improvement are welcome. Please feel free to fork and enhance.

- Trading Bot – TopBot Anomaly Robot Strategy -- Introduction -
This strategy is based on a search for abnormal market price movements relative to a time-shifted main moving average. Different variations of the main moving average are created and shifted proportionally rather than linearly, giving the strategy greater reactivity and serving as position entry points. What's more ? This strategy stands out with a major innovation, allowing position exits to be set on variations in the moving average (and not on the moving average itself, like all strategies that close positions on return to the moving average), which greatly improves actual results.
- Detailed operation of the strategy -
It defines a function that calculates various moving averages (depending on the type of moving average defined by the user) and the chosen length. The function takes into account different types of moving averages: SMA, PCMA, EMA, WMA, DEMA, ZLEMA and HMA, and is offset in time so that it can be an entry or exit condition in real time (otherwise you'd have to wait for the next candle for the moving average to be calculated).
It calculates shifted variants (semi-parallel) as a percentage of this main moving average, high and low, to define position entry points (depending on user settings, up to 10 shifted levels for ten position entries for each direction). By calculating shifts as percentages rather than fixed values, the resulting deviations are not parallel to the main moving average, but can be used to detect sudden price contractions. By adjusting these deviations proportionally, we can observe variations relative to the main moving average more clearly, enabling us to detect dynamic support and resistance zones that adapt to market fluctuations. The fact that they are not strictly parallel avoids too rigid an interpretation and gives a more nuanced reading of trends, capturing small divergences that could indicate more subtle changes in market dynamics.
The most distinctive feature of this strategy concerns position exits: the script calculates two new moving averages shifted in proportion to the main moving average (adjustable) to define position exit price levels.
The strategy enters position when one of the deviations from the position entry moving average is crossed, and exits position when the deviation from the position exit moving average is crossed.
Position entry can be single or up to ten entry levels per direction to smooth trades. Differentiated settings are available for Longs and Shorts.
In this type of strategy, the return to the moving average is generally used as the position exit point, but this strategy incorporates a unique feature: the position exit can be made on a deviation from the moving average, adjustable and differentiated for Long and Short positions.
This is a major change compared to other strategies using a moving-average position exit, since the result is thatchanging the position exit point considerably improves the strategy's results .
Backtest with a classic exit back to the moving average :
Backtest with an exit back on an (adjustable) derivative of the moving average :
- “Ready to use” and user-adjustable parameters -
The strategy interface has been optimized for easy creation of trading robots, with all settings underlying the calculations and numerous options for optimization. Here are the contents of the strategy parameters interface:
In addition, important information about strategy settings and results is displayed directly on the chart. The percentage profit displayed may differ slightly from that of the backtest, as it includes potential profits from open trades (strategy.openprofit) in its calculation.
- Conditions, options and settings for graph and backtest presentation -
Here are the conditions and settings for the graph presented on the screen:
The strategy is set for 10 possible LONG and SHORT entries
10% of capital in x2 leverage is invested at each position entry (i.e. 20% of capital under backtest conditions)
The backtest runs for 14 months: from 08/17/2023 to 08/19/2024
It is carried out on PENDLEUSDT.P on BitGet Swap in 4H
LONGS strategy settings: 0.18 - 0.19 - 0.2 - 0.21 - 0.22 - 0.23 - 0.24 - 0.25 - 0.26 - 0.275 - LONGS output deviation: 0.03 (3%)
Strategy settings for SHORTS: 0.21 - 0.22 - 0.23 - 0.24 - 0.25 - 0.26 - 0.27 - 0.28 - 0.29 - 0.3 - LONGS output deviation: 0.032 (3.2%)
All other settings are strategy defaults - Broker fees + spread are set at 0.13% per trade
We can see several interesting points:
The strategy has very high winrate if set to this objective
The settings here have not been “over-optimized”, i.e. all 10 entries are unused, leaving room for larger-than-expected market movements in the future. In this particular case, it is set to favor safety over profitability optimization, but other approaches are possible to maximize profitability.
The result is 277.75% , thanks to the strategy's adjustment of position exit levels. With a conventional exit at the moving average, results are only 204.47%, a significant difference.
- How to adjust and apply the strategy? -
Generally speaking, the strategy works well on a large proportion of cryptocurrencies, especially for LONG positions. The recommended timeframes are: 30M-45M-1H-2H-3H-4H and the most appropriate timeframe will vary according to the cryptocurrency. It is also possible, with certain assets, to run the strategy on shorter timeframes such as 5M or 15M with success.
The strategy can be used with a single position entry level, maximizing capital utilization on each trade and/or having several strategies active on a single account at the same time
It can also be used in a “safe” way, using up to ten successive entries to smooth out unforeseen market movements and minimize risk as much as possible. In this case, enter positions with 1/10 of the capital each time, for a setting of ten entries, and give preference to a single active bot per account so that all positions can be covered (a fixed dollar amount, not a percentage, is then recommended)
The recommended leverage is x1 or x2 for controlled long-term trading, especially with ten entry levels, although sometimes higher leverage could be considered with controlled risk.
Here's how to set up the strategy:
Start by finding a cryptocurrency displaying a nice curve with the default settings
Then try out the default settings on all timeframes, and select the timeframe with the best curve or the best result
Deactivate shorts
Set the first long triggerlevel to the value that gives the best result
(optional): Change the moving average type, period and data source to find the most optimized setting before proceeding to the next step
Set the 10thlong inputlevel to the last value modifying the result
Set the 8 intermediate input levels, distributing them as evenly as possible
Then adjust the output level of the longs, which can greatly improve the results
Temporarily deactivate the longs, activate the shorts and follow the same process
Reactivate longs and shorts
- How to program robots for automated trading using this strategy -
If you want to use this strategy for automated trading, it's very simple. All you need is an account with a cryptocurrency broker that allows APIs, and an intermediary between TradinView and your broker who will manage your orders.
Here's how it works:
On your intermediary, create a bot that will manage the details of your orders (amount, single or multiple entries, exit conditions). This bot is linked to the broker via an API and will be able to place real orders. Each bot has four different signals that enable it to be activated via a webhook. When one of the signals is received, it executes the orders for you.
On TradingView, set the strategy to a suitable asset and timeframe. Once set, enter in the strategy parameters the signals specific to the bot you've created. Confirm and close the parameters.
Still on TradingView, create an alarm based on your set strategy (on the strategy tester). Give the alarm the name of your choice and in “Message” enter only{{strategy.order.comment}}.
In alarm notifications, activate the webhook and enter the webhook of your trading intermediary. Confirm the alarm.
As long as the alarm is activated in TradingView, the strategy will monitor the market and send an order to enter or exit a position as soon as the conditions are met. Your bot will receive the instruction and place orders with your broker. Subsequent changes to the strategy settings do not change those stored in the alarm. If you wish to change the settings for one of your bots, simply delete the old alarm and create a new one.
Note: In your bot settings, on your intermediary, make sure to allow: - Multiple inputs - A single output signal to close all positions - Stoploss disabled (if necessary, use the strategy one)

Unlock the Power of Seasonality: Monthly Performance StrategyThe Monthly Performance Strategy leverages the power of seasonality—those cyclical patterns that emerge in financial markets at specific times of the year. From tax deadlines to industry-specific events and global holidays, historical data shows that certain months can offer strong opportunities for trading. This strategy was designed to help traders capture those opportunities and take advantage of recurring market patterns through an automated and highly customizable approach.
The Inspiration Behind the Strategy:
This strategy began with the idea that market performance is often influenced by seasonal factors. Historically, certain months outperform others due to a variety of reasons, like earnings reports, holiday shopping, or fiscal year-end events. By identifying these periods, traders can better time their market entries and exits, giving them an advantage over those who solely rely on technical indicators or news events.
The Monthly Performance Strategy was built to take this concept and automate it. Instead of manually analyzing market data for each month, this strategy enables you to select which months you want to focus on and then executes trades based on predefined rules, saving you time and optimizing the performance of your trades.
Key Features:
Customizable Month Selection: The strategy allows traders to choose specific months to test or trade on. You can select any combination of months—for example, January, July, and December—to focus on based on historical trends. Whether you’re targeting the historically strong months like December (often driven by the 'Santa Rally') or analyzing quieter months for low volatility trades, this strategy gives you full control.
Automated Monthly Entries and Exits: The strategy automatically enters a long position on the first day of your selected month(s) and exits the trade at the beginning of the next month. This makes it perfect for traders who want to benefit from seasonal patterns without manually monitoring the market. It ensures precision in entering and exiting trades based on pre-set timeframes.
Re-entry on Stop Loss or Take Profit: One of the standout features of this strategy is its ability to re-enter a trade if a position hits the stop loss (SL) or take profit (TP) level during the selected month. If your trade reaches either a SL or TP before the month ends, the strategy will automatically re-enter a new trade the next trading day. This feature ensures that you capture multiple trading opportunities within the same month, instead of exiting entirely after a successful or unsuccessful trade. Essentially, it keeps your capital working for you throughout the entire month, not just when conditions align perfectly at the beginning.
Built-in Risk Management: Risk management is a vital part of this strategy. It incorporates an Average True Range (ATR)-based stop loss and take profit system. The ATR helps set dynamic levels based on the market’s volatility, ensuring that your stops and targets adjust to changing market conditions. This not only helps limit potential losses but also maximizes profit potential by adapting to market behavior.
Historical Performance Testing: You can backtest this strategy on any period by setting the start year. This allows traders to analyze past market data and optimize their strategy based on historical performance. You can fine-tune which months to trade based on years of data, helping you identify trends and patterns that provide the best trading results.
Versatility Across Asset Classes: While this strategy can be particularly effective for stock market indices and sector rotation, it’s versatile enough to apply to other asset classes like forex, commodities, and even cryptocurrencies. Each asset class may exhibit different seasonal behaviors, allowing you to explore opportunities across various markets with this strategy.
How It Works:
The trader selects which months to test or trade, for example, January, April, and October.
The strategy will automatically open a long position on the first trading day of each selected month.
If the trade hits either the take profit or stop loss within the month, the strategy will close the current position and re-enter a new trade on the next trading day, provided the month has not yet ended. This ensures that the strategy continues to capture any potential gains throughout the month, rather than stopping after one successful trade.
At the start of the next month, the position is closed, and if the next month is also selected, a new trade is initiated following the same process.
Risk Management and Dynamic Adjustments:
Incorporating risk management with this strategy is as easy as turning on the ATR-based system. The strategy will automatically calculate stop loss and take profit levels based on the market’s current volatility, adjusting dynamically to the conditions. This ensures that the risk is controlled while allowing for flexibility in capturing profits during both high and low volatility periods.
Maximizing the Seasonal Edge:
By automating entries and exits based on specific months and combining that with dynamic risk management, the Ultimate Monthly Performance Strategy takes advantage of seasonal patterns without requiring constant monitoring. The added re-entry feature after hitting a stop loss or take profit ensures that you are always in the game, maximizing your chances to capture profitable trades during favorable seasonal periods.
Who Can Benefit from This Strategy?
This strategy is perfect for traders who:
Want to exploit the predictable, recurring patterns that occur during specific months of the year.
Prefer a hands-off, automated trading approach that allows them to focus on other aspects of their portfolio or life.
Seek to manage risk effectively with ATR-based stop losses and take profits that adjust to market conditions.
Appreciate the ability to re-enter trades when a take profit or stop loss is hit within the month, ensuring that they don't miss out on multiple opportunities during a favorable period.
In summary, the Ultimate Monthly Performance Strategy provides traders with a comprehensive tool to capitalize on seasonal trends, optimize their trading opportunities throughout the year, and manage risk effectively. The built-in re-entry system ensures you continue to benefit from the market even after hitting targets within the same month, making it a robust strategy for traders looking to maximize their edge in any market.
Risk Disclaimer:
Trading financial markets involves significant risk and may not be suitable for all investors. The Monthly Performance Strategy is designed to help traders identify seasonal trends, but past performance does not guarantee future results. It is important to carefully consider your risk tolerance, financial situation, and trading goals before using any strategy. Always use appropriate risk management and consult with a professional financial advisor if necessary. The use of this strategy does not eliminate the risk of losses, and traders should be prepared for the possibility of losing their entire investment. Be sure to test the strategy on a demo account before applying it in live markets.

Triangular Arbitrage [Starbots]Triangular arbitrage in crypto refers to a trading strategy that exploits price discrepancies between three different cryptocurrencies or currency pairs on the same exchange.
The idea is to make a series of trades that ultimately result in a profit without the risk typically involved in trading. It works by taking advantage of the inefficiencies in the pricing of cryptocurrency pairs.
Here’s how it works:
Identify the Discrepancy: A trader finds a pricing mismatch between three cryptocurrencies. For example, they identify that the exchange rates between BTC/ETH, ETH/USDT, and BTC/USDT pairs are not aligned in a way that satisfies arbitrage-free conditions.
Three Trades:
Trade 1: Start with one cryptocurrency, say USDT (Tether).
Trade 2: Use USDT to buy ETH.
Trade 3: Use ETH to buy BTC.
Final Trade: Finally, convert the BTC back into USDT.
Profit: If the exchange rates between these pairs are out of sync, the trader can end up with more USDT (or the initial cryptocurrency) than they started with. This is because the temporary price inefficiency allowed them to buy low and sell high across different pairs.
Example:
Initial position: You have 10,000 USDT.
Step 1: You buy ETH with USDT (at a rate of 1 ETH = 2000 USDT), getting 5 ETH.
Step 2: You buy BTC with ETH (at a rate of 1 BTC = 2.5 ETH), getting 2 BTC.
Step 3: You sell BTC back for USDT (at a rate of 1 BTC = 5200 USDT), getting 10,400 USDT.
This results in a profit of 400 USDT after completing the cycle, assuming no fees or slippage.
Key Points:
Risk-Free (In Theory): In theory, triangular arbitrage is risk-free because you’re taking advantage of price discrepancies and not market trends.
High Speed Required: Since the inefficiencies in the crypto market are usually very short-lived, this strategy often requires bots or automated systems to execute trades quickly.
Fees and Slippage: In reality, exchange fees, trading volume, and slippage (the difference between the expected price and the actual execution price) can eat into profits and should be carefully considered.
Triangular arbitrage opportunities arise in crypto markets due to the high volatility and fragmentation across different trading pairs and exchanges.
________________________________________________________________
Recommended Binance pairs: DOGE/BTC, TRX/BTC, LINK/BTC, RUNE/BTC, FET/BTC, WIF/BTC,.. Make sure they have big daily volume when you swap them.
You typically have 30 seconds to 2 minutes to complete all three orders, but the main challenge is slippage, especially if the trading volume is low.
<>How to use indicator?
For example, open the DOGE/BTC chart on Binance and set the timeframe to 30 seconds or 1 minute.
In the first input, enter DOGE/USDT, the symbol that's on the left of your slash (DOGE/BTC), and in the second, enter BTC/USDT, the symbol that's on the right of your slash (DOGE/BTC).
Next, select the investment and commissions option.
Indicator will automatically calculate the discrepancies between these three different cryptocurrency pairs and show you when it's profitable to trade it on the chart.
Follow the indicator's suggested orders and capitalize on the price discrepancies between the three cryptocurrencies on the same exchange. This is how Triangular Arbitrage work.
EV Calculator [CHE]EV Calculator with Adjustable Boxes and Custom Colors for TradingView
Introduction:
As a trader, one of the key metrics you need to evaluate is the Expected Value (EV) of your trading strategy. Understanding EV helps you gauge whether your trades will be profitable in the long run. This TradingView script allows you to visualize your EV alongside customizable win rates and risk-to-reward ratios. With adjustable visual components, you can quickly determine whether your trading strategy has a positive or negative EV, and make informed decisions.
Features of the Script:
1. Customizable Inputs:
- Win Rate: Set your win probability (0.0 to 1.0), which represents how often your strategy is successful.
- Risk and Reward: Define how much you're risking and the potential reward for each trade.
2. Visual Representation:
- The script creates colored boxes representing different EV scenarios:
- Green Box: Indicates a good EV (>2), suggesting a highly profitable strategy.
- Yellow Box: Represents a neutral EV (between 0 and 2), where the strategy could work but is not optimal.
- Red Box: Shows a negative EV (<0), signaling that the strategy may lead to losses.
3. Adjustable Box Size:
- You can modify the width and height of the boxes to fit your chart display preferences, giving you better visual clarity based on your screen or chart style.
4. Dynamic Labels:
- Each bar in the chart includes dynamic labels showing:
- Win Rate: Displays the percentage chance of success.
- EV Value: Shows the calculated expected value based on the win rate and risk-reward ratio.
- Guide: Explains what each colored box means so that you can easily interpret the chart.
5. Scalability and Flexibility:
- The script only keeps a maximum of 20 recent entries, ensuring that your chart stays clean and organized.
- Both the number of labels and boxes adjust automatically to match your preferred settings, enhancing usability.
How the EV Calculation Works:
The formula for EV is based on a standard risk-to-reward model:
EV = (Win\ Rate \times Reward) - (Loss\ Probability \times Risk)
For example:
- If your win rate is 60% and your risk-to-reward ratio is 1:3, the script will calculate whether this strategy is expected to yield positive returns or result in long-term losses.
Example Use Case:
Let's say you are trading with a 60% win rate, risking 1 unit to gain 3 units. The script calculates that your EV is positive and represents this with a Green Box, showing you that your strategy has a high likelihood of being profitable. If your strategy slips and the win rate drops, the EV calculation will adjust, and you may see Yellow or Red Boxes, signaling a need for adjustment.
Final Thoughts:
This script is designed for traders who want to take their analysis beyond the basics. By providing real-time visualization of your EV, you can better assess whether your strategy is sound and make adjustments as needed.
How to Use:
- Adjust the input parameters for Win Rate, Risk, and Reward to match your trading strategy.
- Observe the colored boxes and labels to quickly understand if your current strategy is in a healthy EV zone.
- Use this visual feedback to refine your approach and stay on track towards profitability.
This tool simplifies the complex calculations behind EV and turns it into an intuitive and powerful decision-making aid for traders.
Now you're ready to integrate the EV Calculator with Adjustable Boxes and Custom Colors into your trading routine and start optimizing your strategies for long-term success!
Happy Trading and best regards Chervolino