[RS]Detrended Percent Price Over Average on RangeExperimental:
Detrended Price oscillator from price against the average inside the range.
在腳本中搜尋"range"

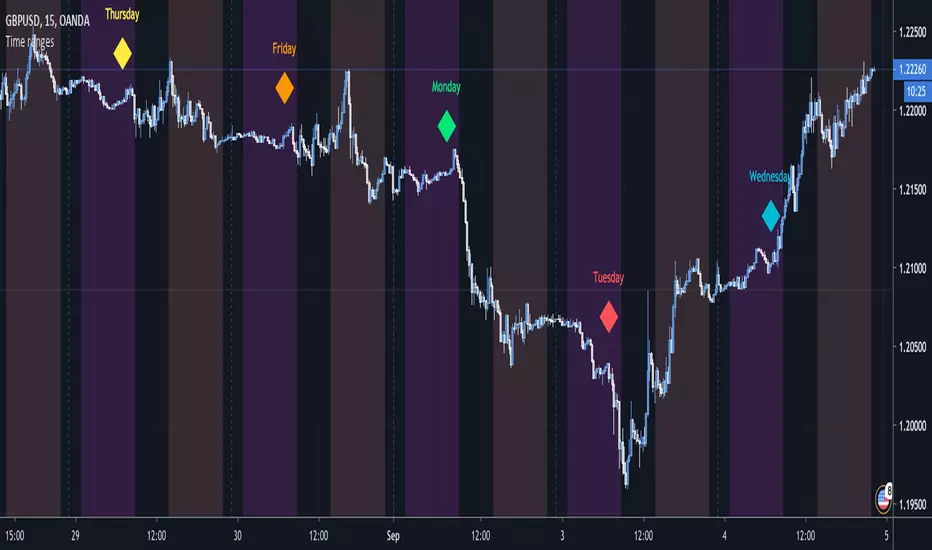
Time rangesThis script visualizes the different time sessions during the day.
The time ranges are set to the default Frankfurt, London, NY, Sydney and Tokyo, but can be
freely modified and turned off (I personally use to display only Tokyo and NY).
If you are a day trader, e.g. you trade with the Market Makers, this tool is a "must have".
It also displays the day of the week, which can be set off as well.
vitelot/yanez/Vts Sept 2019
PS I chose this script to belong to the "volatility" category since it can be used to highlight the Asian session,
and there was no suitable category available.
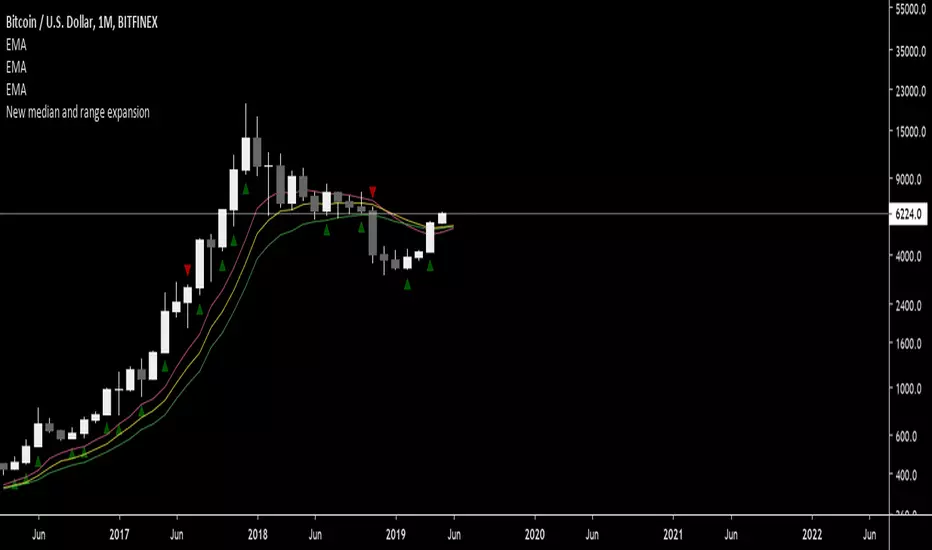
New median and range expansionIndicator for starting chasing the trend early.
Indicates new higher or lower candle median in conjunction with greater range.
Average True Range (ATR %) Stop Loss CalculatorThis indicator takes the average of a series of ATR to calculate what I would consider an optimum stop loss placement represented in percentage (read below for full overview).
While the data is plotted what is most helpful are the actual numbers presented and for my charts I remove most of the plotting.
This indicator is most helpful on the daily timeframe but can be used for all timeframes such as the 4HR, 1HR or even 15M.
This indicator should not be used alone. It should be used in conjunction with proper price action analysis. It’s also a great indicator if you chart using Value Channels. Ideally you want your stop placement to be below at least one core Value Channel boundary range. In addition to standard support and resistance and some key moving averages the market respects. This also works best when trading with the prevailing BIAS of the instrument (bull or bear).
Cryptos: Generally, that means you’re buying on retracements that fit the end of a structured move. The other option is using this in a clear up trending market where the pull backs are clearly being supported with buying.
FOREX: I built another indicator for FOREX search: ATRPIPS with SL
WTI: Helpful but I have different rules for when I trade WTI. I rely upon VCs and diagnal VCs much more when trading this.
Equities: Helpful but with the increase of volatility as well as uncertainty of Bias of the market-- this should be used as more of a guide than
What is most important is the actual percentage numbers but I've found graphing 1-3 of the actual ATRs is helpful. The rest just uncheck the checkbox in the options.
Indicator Overview:
Value 1 - 3 Period ATR (maroon)
Value 2 - 7 Period ATR (green)
Value 3 - 30 Period ATR (blue)
Value 4 - 90 Period ATR (blue, bold)
Value 5 - 1 Period ATR (green)
Value 6 - 1 Period ATR (red)
Value 6 – Prime Stop Loss Placement (maroon). This is the average of all above ATRs multiplied by 1.5
Value 7 - Move Left (red). Experimental value. This is the difference between (prime stop loss) and 1 day period move. Two ways to use this value. Use as a tighter stop loss placement. The other option is to use as a retrace target for purchase and using the Prime Stop Placement value as you’re stop loss.
All ATRs use the LOW price of the period. After testing both the low and close I’ve settled on the low to capture the most volatility you will typically experience.
Once again, this indicator should be used in conjunction with your proven trade system.
Also, by knowing what the values are within the indicator you could just eye ball what would be the best stop placement depending on the ATR or 1 or 2 ATRs you find most represent the volatility of what you are trading.
I will be expanding on this indicator by bringing in average measured moves as well as volume analysis and most likely with color changes and modifications.
Background:
While using and refining my trade system I've noticed that most moves happen in 3 periods. So we start there. The 7 period is good for a 24 hour market such as crypto (although weekend trading can be a hit or miss) and to some extent FOREX. The longer periods of 30 & 90 are to smooth out the data set. The final value of the 1 period is to bring a little more recency to the calculation.
Why multiply the average by 1.5? I've found in my own trading and system I built to be the best placement (in conjunction with VCs) to ensure you're stop isn't to close and is within the instrument you are trading volatility .
I'm looking at making this more intelligent as well as take into account volume and structured moves.

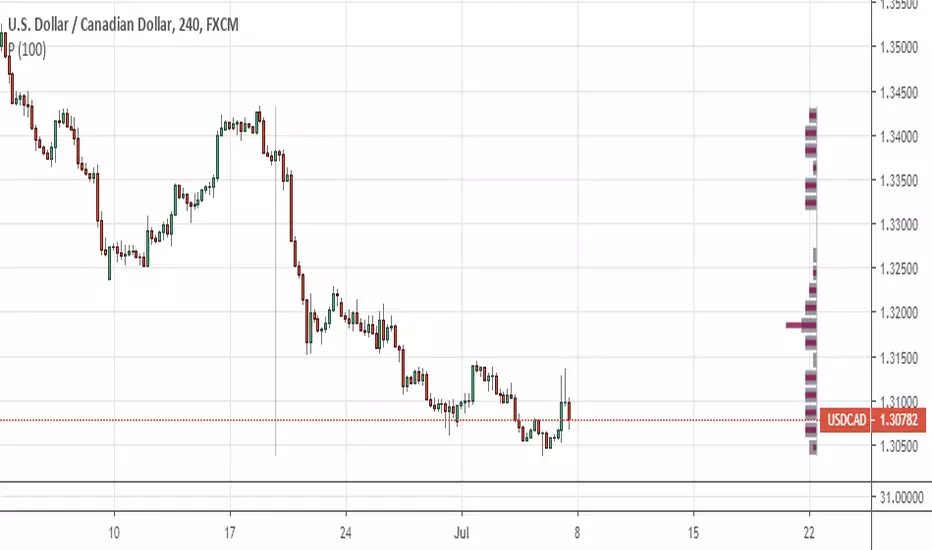
ATR 0.5 & 0.7 rangesIt good to look to ATR on intraday trading.
According to our team research only 4.8% of days security goes out of their ATR.
So we developed ATR indicator which shows Daily ATR ranges on smaller time frames.
When price crosses 70% of previous day ATR is good to look for signal to trade backward.

Breakout Scalper (Session)This is a twist on my on my Breakout Scalper strategy that limits trading to a user-configurable session
Find the original "Continuous" version of the scalper here:
The breakout scalper is based on "slow" and "fast" donchian periods. In this version, the "slow" donchian is in fact the Day's high/low. This important difference means that we will always be entering our trades at the day's high or low, so you are exposed to the price making new highs/lows but not to oscillations within the day's range.
Furthermore, the scalper is modified to only enter trades after the start of the user-configured session. Any open trades are closed at the end of the user-configured session. The default session is set to 10:00 AM to 3:30 PM because that's when I like to trade.

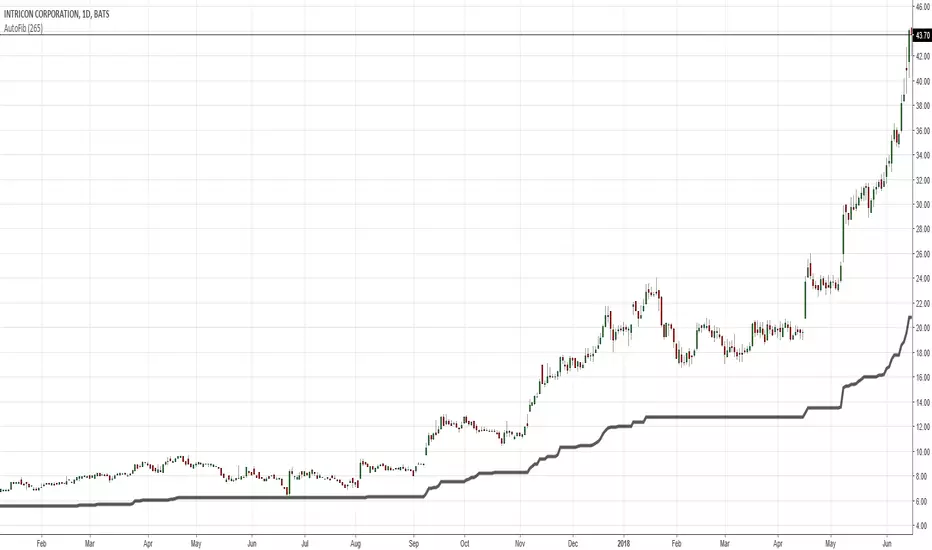
0.382 Fibonacci Line of Trailing 1-year Price RangeYou may try adding this Line to your daily charts. It represents the 0.382 Fibonacci level of the trailing 1-year Price Range.
If price is above this line, then it is in Bullish Territory and long entries can be looked for.
According to backtesting I've done, price being above the 0.382 Fibonacci and/or the 200d sma are the 2 best determinants of
qualifying an equity to be in Bullish Territory on the daily chart.

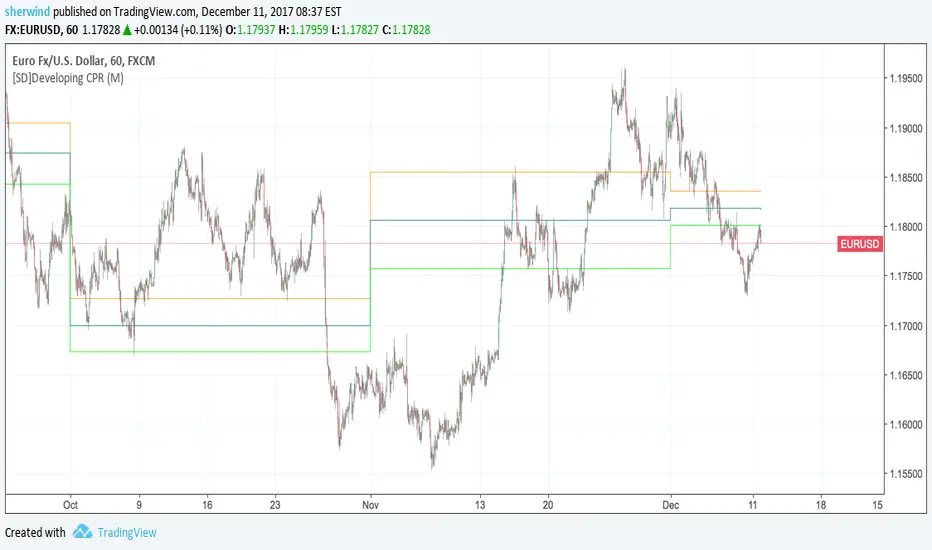
SD - Developing Central Pivot RangeThis script implements a developing version of Central Pivot Range.
Inputs:
Developing 'CPR' resolution - Either D (Daily), W (Weekly), M (Monthly) or 12M (Yearly). The default value is M.


ATR Structure Trail Pro & Range Filter (v6)📌 ATR Structure Trail Pro & Range Filter (v6)
Multi-purpose trend-following and consolidation detection tool
🔍 Overview
This indicator combines structure pivots, an ATR-based trailing stop, range detection, and clean visual signals to identify trend shifts and potential trade zones.
It is designed for traders who want simple, clean structure reading without unnecessary chart noise.
This indicator does not guarantee profit and is intended for educational and analytical purposes only, serving as a visual aid for reading price action.
⚙️ Main Components
1️⃣ Structure Pivot Flip (Trend Change Detection)
The indicator uses Pivot High / Pivot Low structure to detect when price creates:
Higher High → BUY bias
Lower Low → SELL bias
When a structural flip occurs:
a green arrow appears (potential bullish setup)
or a red arrow appears (potential bearish setup)
These arrows are not trade signals, but visual markers highlighting a shift in market context.
2️⃣ ATR Trail Stop (Adaptive Trend Line)
The ATR trail line automatically adapts to market volatility:
green during bullish phases
red during bearish phases
The ATR multiplier determines how far the dynamic trail is placed relative to price.
The trail line is not a guaranteed exit level — it acts as a dynamic structural reference.
3️⃣ Range/Box Zones (Consolidation Filter)
When the indicator detects that price is entering a tight consolidation range based on ATR and recent volatility, it draws a box zone:
blue in bullish context
purple in bearish context
Range zones indicate low-risk/no-trade areas where entries are typically avoided according to price action logic.
🎯 Trading Logic (Non-Signaling)
This indicator is not a trading system.
It visually highlights:
✔ structure
✔ trend
✔ volatility
✔ consolidation
✔ potential reversals
Users make trading decisions independently of these visual elements.
🧩 Inputs & Customization
You can fully customize:
ATR length & multiplier
Pivot sensitivity
Box fill and border colors
ATR trail color, width, and style (solid/dashed/dotted)
Visibility of all components individually
The indicator works across all timeframes and instruments.
💡 How to Use
Use arrows as informational markers of structure change
Use the ATR trail as a dynamic guide for current trend
Use range boxes to avoid entries during consolidation
Combine it with your own price action analysis, EMA/Kijun lines, session opens, or volume levels
⚠️ Important Notes
This indicator provides no performance guarantees
Not financial advice or a trading signal
Users are responsible for their own testing and application
Intended strictly for educational and analytical use in compliance with TradingView’s rules
📬 Author Notes
If you find this indicator useful, feel free to leave a comment or suggestion for future improvements.
All inputs are open for expansion and further development.

NQ Implied Range GovernorThis Pine Script v6 indicator, “NQ Implied Range (VIX ÷ √N) Governor”, builds a real-time implied range framework for Nasdaq futures by importing a volatility index (default CBOE:VXN) on a user-selected timeframe and smoothing it with an EMA. It converts the annualized vol reading into a daily 1σ percentage move via oneSigmaPct = (VIX ÷ √252)/100, then maps that into a point-based implied move from a session “anchor” price. The anchor is locked at RTH session start (0930–1600 ET by default) based on your chosen mode (RTH Open, prior bar close, or daily open). A band mode selector controls how sigma is interpreted: an “Intraday Range” mode uses √(2/π) (~0.798) as a proxy for expected max excursion, while close-to-close modes use ±1σ or ±2σ envelopes; a separate calibration multiplier lets you widen/tighten the bands beyond theory.
Once the implied move is computed, the script plots the upper/lower 1.0 bands, the anchor midline, and optional fills above/below the anchor. It then derives symmetric Fibonacci retracement levels between the anchor and each band (.236, .382, .500, .618, .786) and optional extensions (1.272, 1.618), with right-edge price labels for quick reading. In parallel, it tracks realized RTH range (session high–low) and compares it to the implied total range to produce a “range spent” ratio, dynamically color-coded from green → yellow → orange → red as the session consumes volatility budget. That ratio drives a session-end summary label (realized vs implied, bands, % spent), a configurable dashboard table showing model inputs/outputs (smoothed vol, raw σ%, anchor, ± bands, total range, realized, remaining, distance to bands), and a set of alert conditions for key events: crossing spent thresholds (70/100/120%), touching outer bands, touching key fib levels, extension hits, and session start/end.

Stocks: QQQ Daily ATR% + Premarket Range (% of ATR)## Stocks/ETFs: QQQ Premarket Range (% of Daily ATR) — ORB Trading Guide
### What this indicator does
This indicator is built for **stocks and ETFs** like **QQQ** and is meant to support **Opening Range Breakout (ORB)** trading.
It measures the **Premarket Range** from **04:00 to 09:30** (exchange time), then compares that move to QQQ’s **typical full-day movement** using **Daily ATR(14)**.
The goal is simple:
> **Before the open, decide whether the day is more likely to behave like a “chop day” or an “expansion day,” and then choose the ORB style that matches.**
---
## Key terms (plain English)
### Daily ATR(14)
ATR stands for **Average True Range**.
On the **daily** timeframe, ATR(14) estimates QQQ’s **typical daily movement** over the last 14 trading days.
Think of it as:
> “On a normal day, QQQ tends to move about *X* dollars.”
---
### ATR% (vs Daily Close)
This converts ATR into a percent of price so you can compare volatility over time:
Think of it as:
> “QQQ’s typical daily move is about *X%* of its price.”
---
### Premarket Range (04:00–09:30)
This is the distance between the **premarket high** and **premarket low** during the session window:
**04:00 → 09:30**
Think of it as:
> “How much QQQ already moved before the bell.”
---
### Premarket Range % of ATR
This is the core measurement:
It answers:
> “How much of a normal day’s movement already happened before the open?”
Examples:
* **20%** = quiet premarket (small move)
* **60%** = active premarket (big move already happened)
---
## How to interpret the Regime label
This script classifies the day into one of three “regimes”:
### **CHOP-LEANING** (Premarket Range < 25% of Daily ATR)
Premarket was quiet. The open is more likely to be:
* range-bound
* full of fakeouts
* slower follow-through
### **NEUTRAL** (25%–50%)
Normal premarket activity. Either outcome is possible:
* trend or chop
* you must let the open confirm it
### **EXPANSION-LEANING** (Premarket Range > 50%)
Premarket was very active. The open is more likely to:
* move faster
* expand range quickly
* have stronger directional pushes (or sharp swings)
**Important:** Expansion does not guarantee a clean trend. It means **movement is more likely**.
---
# How I use this indicator with ORB (my rules)
This indicator is not a buy/sell signal by itself.
I use it to decide **which ORB style to trade**.
## Step 1 — Check the “Regime” before the open
* If the indicator reads **EXPANSION-LEANING**, I treat it like a momentum environment.
* If the indicator reads **CHOP-LEANING**, I treat it like a confirmation environment.
* If it reads **NEUTRAL**, I stay selective and let price action confirm.
---
## Step 2 — ORB Execution Rules
### ✅ If **EXPANSION-LEANING** (momentum day)
**Goal:** Catch the move early and avoid missing the breakout.
**My ORB plan:**
* Build my opening range using the **5-minute ORB**
* Enter on a **break of the ORB level**
* Use the **1-minute timeframe** for the actual entry trigger
**How I confirm the break:**
* I want a clean break through the ORB level (not just a wick touch)
* If price snaps immediately back inside the ORB, I avoid chasing
This approach fits expansion days because QQQ can move fast after the open and waiting for perfect retests can cause you to miss the push.
---
### ✅ If **CHOP-LEANING** (confirmation day)
**Goal:** Avoid fakeouts and only enter when the break proves itself.
**My ORB plan:**
* Build my opening range using a **15-minute ORB**
* I do **not** enter on the first break
* I wait for a **break and retest**
* Then I use the **5-minute timeframe** to confirm the retest holds before entry
This fits chop days because breaks fail more often, so I require confirmation before committing.
---
### ✅ If **NEUTRAL**
**Goal:** Reduce low-quality trades.
**My ORB plan:**
* Treat it as “wait and see”
* Only take the break if price shows strong conviction (hold outside ORB)
* If price is whipping in and out of the range, I skip the trade
---
## Best practices
* Works best on **1m / 5m / 15m charts** so the premarket high/low is captured accurately.
* Premarket session time uses the symbol’s **exchange time**.
* Use proper risk management—QQQ can move fast, especially on expansion days.
---
## Disclaimer
This script is for educational purposes only and is not financial advice. Trading involves risk. Always use risk management and test any approach before trading live.

Futures: NQ Overnight Range (% of Daily ATR)## Futures: NQ Overnight Range (% of Daily ATR) — ORB Trading Guide
### What this indicator does
This indicator is built for **NQ / MNQ futures** and is meant to support **Opening Range Breakout (ORB)** trading.
Because futures trade nearly 24 hours, a lot of important movement happens during **Asia + London**. This script measures the **Overnight Range** from **18:00 to 09:30** (exchange time), then compares it to the market’s **typical full-day movement** using **Daily ATR(14)**.
The goal is simple:
> **Before the open, decide whether the day is more likely to behave like a “chop day” or an “expansion day,” and then choose the ORB style that matches.**
---
## Key terms (plain English)
### Daily ATR(14)
ATR is the average daily movement over the last 14 days.
Think of it as:
> “On a normal day, NQ tends to move about *X* points.”
---
### Overnight Range (18:00–09:30)
This is the distance between the **overnight high** and **overnight low** from 18:00 to 09:30.
Think of it as:
> “How much NQ already moved before the cash open.”
---
### Overnight Range % of ATR
This is the “volatility meter” for the day:
It answers:
> “How much of a normal day’s movement already happened overnight?”
---
## How to interpret the Regime label
This script classifies the day into one of three “regimes”:
### **CHOP-LEANING** (Overnight Range < 25% of Daily ATR)
Overnight was quiet. The open is more likely to be:
* range-bound
* full of fakeouts
* slower follow-through
### **NEUTRAL** (25%–50%)
Normal overnight activity. Either outcome is possible:
* trend or chop
* you must let the open confirm it
### **EXPANSION-LEANING** (Overnight Range > 50%)
Overnight was very active. The open is more likely to:
* move faster
* expand range quickly
* have stronger directional pushes (or sharp swings)
**Important:** Expansion does not guarantee a clean trend. It means **movement is more likely**.
---
# How I use this indicator with ORB (my rules)
This indicator is not a buy/sell signal by itself.
I use it to decide **which ORB style to trade**.
## Step 1 — Check the “Regime” before the open
* If the indicator reads **EXPANSION-LEANING**, I treat it like a momentum environment.
* If the indicator reads **CHOP-LEANING**, I treat it like a confirmation environment.
* If it reads **NEUTRAL**, I stay selective and let price action confirm.
---
## Step 2 — ORB Execution Rules
### ✅ If **EXPANSION-LEANING** (momentum day)
**Goal:** Catch the move early and avoid missing the breakout.
**My ORB plan:**
* Build my opening range using the **5-minute ORB**
* Enter on a **break of the ORB level**
* Use the **1-minute timeframe** for the actual entry trigger
**How I confirm the break:**
* I want a clean break through the ORB level (not just a wick touch)
* If price snaps immediately back inside the ORB, I avoid chasing
This approach fits expansion days because the market can move quickly and waiting for perfect retests can cause you to miss the push.
---
### ✅ If **CHOP-LEANING** (confirmation day)
**Goal:** Avoid fakeouts and only enter when the break proves itself.
**My ORB plan:**
* Build my opening range using a **15-minute ORB**
* I do **not** enter on the first break
* I wait for a **break and retest**
* Then I use the **5-minute timeframe** to confirm the retest holds before entry
This fits chop days because breaks fail more often, so I require confirmation before committing.
---
### ✅ If **NEUTRAL**
**Goal:** Reduce low-quality trades.
**My ORB plan:**
* Treat it as “wait and see”
* Only take the break if price shows strong conviction (hold outside ORB)
* If price is whipping in and out of the range, I skip the trade
---
## Best practices
* This indicator works best on **1m / 5m / 15m charts** so the overnight high/low is captured accurately.
* Times are based on the symbol’s **exchange time**.
* Use proper risk management—futures can move fast, especially on expansion days.
---
## Disclaimer
This script is for educational purposes only and is not financial advice. Futures trading carries significant risk. Always use risk management and test any approach before trading live.
---

True Range Smoothed SuperTrendTrue Range Smoothed SuperTrend (TRS SuperTrend | MisinkoMaster)
The True Range Smoothed SuperTrend is an innovative trend analysis indicator designed to identify clear market trends while minimizing noise. By combining a smoothed price source weighted by true range values with an ATR-based volatility multiplier, this tool delivers reliable trend signals adaptable to a wide variety of asset classes and timeframes.
It’s particularly useful for traders seeking a versatile trend-following system that balances sensitivity and stability.
🔍 Concept & Idea
The indicator enhances the classic SuperTrend concept by using a true range–weighted smoothing of price data instead of raw price or simple moving averages. This weighting helps focus on periods with higher volatility, improving the relevance of trend detection.
Along with smoothing, the indicator applies an ATR-based volatility multiplier to dynamically adjust the upper and lower trend bands, adapting to current market volatility conditions.
⚙️ How It Works
True Range Weighted Smoothing:
The source price (default: low) is multiplied by the true range values over the lookback period.
These weighted values are summed and normalized by the total true range sum.
The result is further smoothed using an Exponential Moving Average (EMA) with a length proportional to the square root of the input length, reducing noise while preserving trend responsiveness.
ATR-based Bands:
The Average True Range (ATR) is calculated with the same length as the smoothing period.
The ATR is multiplied by a user-defined multiplier to establish dynamic upper and lower bands around the smoothed price.
Trend Determination:
When the source price crosses above the upper band, a bullish trend is signaled.
Conversely, crossing below the lower band signals a bearish trend.
These crossings update the trend state, which controls plotted bands and trend labels.
🧩 Inputs Overview
Length – Controls the lookback period for true range weighting, ATR calculation, and smoothing. Affects sensitivity and smoothness (default 37).
Source – Price source used for calculation, defaulting to low.
Multiplier – Scales the ATR bands to adjust volatility sensitivity (default 1.45).
📌 Usage Notes
The TRS SuperTrend works well across various asset classes and timeframes.
The true range weighting improves trend detection in volatile markets by emphasizing price moves during active periods.
Adjust the length and multiplier inputs to balance between noise reduction and responsiveness for your specific market and strategy.
Trend changes are visually marked with “𝓛𝓸𝓷𝓰” and “𝓢𝓱𝓸𝓻𝓽” labels directly on the chart.
Background fills between bands and price improve visual clarity.
Combine with other confirmation tools and risk management practices for best results.
Not a standalone trading system; always validate and backtest prior to live trading.
⚠️ Disclaimer
This script is provided for educational and informational purposes only and does not constitute financial advice. Trading involves risk and users should perform their own analysis before making trading decisions.
Enjoy smoother and clearer trend analysis with the True Range Smoothed SuperTrend!

SilverHawk Range BoxSilverHawk Range Box
This indicator detects volatility compression (ranging markets) using standard deviation, variance, and ATR thresholds, then draws a dynamic range box with trend line.
Features:
- Range detection when volatility is low (compressed std/var/ATR)
- Range box with mid bands and gradient fills
- Trend line inside range (bullish/bearish color)
- Bottom-left warning note when range is active
- Alert on range start
Settings:
- Range Period: lookback length (default 10)
- Range Multiplier: band width (default 1.8)
- StdDev/Variance/ATR Multipliers: compression thresholds (default 0.8/0.8/0.9)
- Show Trend Line / Range Bands: toggle visuals
- Enable Alerts: toggle range start alert
Best used on H1 to H4 timeframes in Forex or indices to avoid choppy ranging markets. Use with proper risk management and confirmation.
Educational tool only. Not financial advice. Trading involves risk.

DAX 9-10 Breakout Strategy IndicatorOpening Hour Breakout (ORB) indicator for intraday trading.
WHAT IT DOES:
• Identifies the price range of a specific hour (default: 9:00-10:00)
• Detects breakout direction (Long/Short) when price breaks above HIGH or below LOW
• Automatically calculates Take Profit and Stop Loss zones based on range size
• Tracks trade outcome (Win/Lose) when TP or SL is hit
HOW TO USE:
1. Set the session hour according to your chart's timezone
2. Wait for the session range to form (yellow box)
3. Enter on breakout above HIGH (Long) or below LOW (Short)
4. TP and SL levels are automatically calculated
DEFAULT SETTINGS:
• TP Multiplier: 1.41x range (Risk:Reward ≈ 1:2.7)
• SL Multiplier: 0.52x range
FEATURES:
• Works on any timeframe (H1, M15, M30, etc.)
• Visual zones for session range, TP, and SL
• Price labels for all key levels
• Entry arrows and direction letters (L/S)
• Win/Lose markers (W/X) when trade closes
• Fully customizable - show/hide any element
• Info panel with live status and R:R ratio
• Alert conditions for Entry, TP hit, SL hit
BEST USED ON:
• DAX (Germany 40)
• Other indices: US30, US500, NAS100
• Forex majors during London/NY open
NOTE: This is an indicator for visual analysis. Use the Strategy version for backtesting.

BULLISH!! Low High Range Options HelperThis indicator is designed for range-based options trading, where price tends to rotate between a defined low and high rather than trend continuously. Its purpose is not to tell you what to trade, but to provide context for timing, specifically answering the question: if price is at a discount here, how much time should an option realistically have?
The script identifies a recent price range and plots three key levels. The range high represents the upper boundary of recent price action and often acts as a take-profit or resistance area. The range mid is the 50 percent equilibrium of the range and is intended as a confirmation level rather than an entry signal. The range low represents the discount zone, where risk is best defined for bullish options trades. This is the only area where options guidance is displayed.
When price touches the range low, the indicator calculates how long similar range rotations have taken in the past, adjusts that timing to the current chart timeframe, and applies a safety factor to reduce the risk of under-timing an options position. It then displays a suggested days-to-expiration label, such as 3 DTE, 4 DTE, 5 DTE, 6 DTE, 7 DTE, 10 DTE, or 14 plus. Shorter DTE values reflect faster expected rotations, while longer DTE values reflect slower, choppier, or more uncertain conditions. The goal is to help avoid the common mistake of buying options that do not have enough time to work.
A typical way to use this tool is to identify a clearly defined range, wait for price to reach the range low, note the DTE guidance shown on the chart, then wait for confirmation such as a reclaim of the range midpoint before considering a trade. Risk can then be managed with the range structure in mind, often targeting the range high in rotational environments. The indicator is most effective in sideways or mean-reverting markets rather than strong trends.
This script does not place trades, predict direction, or guarantee outcomes. It does not account for news events, earnings, implied volatility changes, or broader macro conditions. It is intended as a contextual tool to support disciplined decision-making, not as a standalone trading system.
Always trade smart. Manage position size, define risk before entering a trade, and avoid over-leveraging short-dated options. The objective is not to predict the market, but to consistently align price structure with realistic time expectations.

Candle Closing Range %Measuring strength of the daily closing candle after a gap up or strong open.
This indicator calculates where price closed within the day’s range and expresses it as a percentage. It is designed to give immediate context on whether buyers or sellers controlled the session — and is especially useful when analyzing gap days or trend continuation setups on intraday charts.
The indicator always references the most recent closed daily candle.
Formula:
Closing Range = (Close – Low) / (High – Low) × 100
Range interpretation:
• Closing range > 60% → Buyers dominated
• Closing range 40–60% → Neutral (directional bias unclear)
• Closing range < 40% → Sellers dominated
Style options:
• Background color
• Text Size
• Text Color
