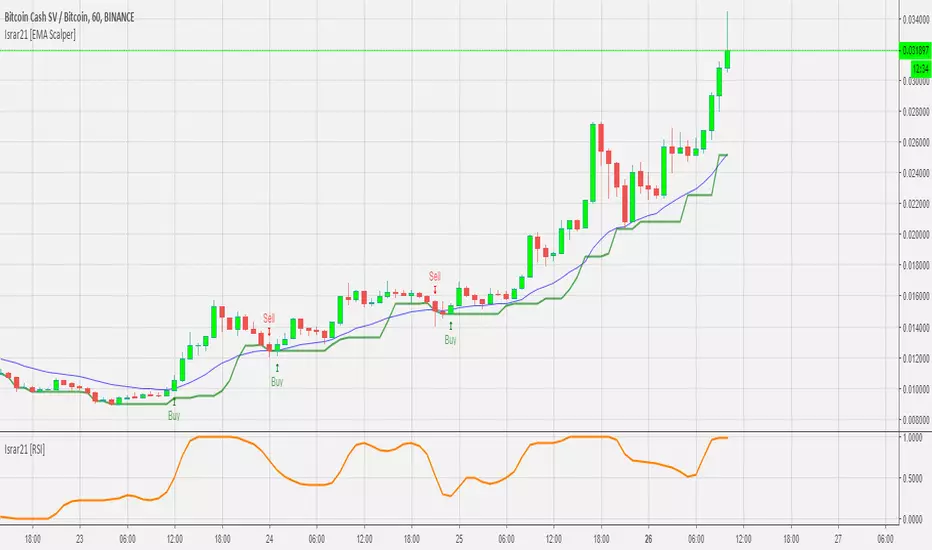
Contrarian Scalping Counter Trend Bb Envelope Adx and StochasticContrarian Scalping is an trading strategy designed to take advanted of a counter-trend.
The advantage of these strrategies types is that they have a good profitability but with do not great gain (in relation at the time frame).
Indicators used:
Bollinger
Envelope
ADX
Stochastic
Rules for entry
For short: close of the price is above upper band from bb and envelope, adx is below 30 and stochastic is above 50
For long: close of the price is below lower band from bb and envelope, adx is below 30 and stochastic is below 50
Rules for exit
For short: either close of the candle is below lower band of bb or enveloper or stochastic is below 50
For long: either close o the candle is above upper band of bb or envelope or stochastic is above 50
If there are any questions let me know !
在腳本中搜尋"scalp"

5min MACD scalp by JoelThis strategy is inspired by a youtuber called Joel on Crypto. He trades this using Ema, MACD indicators and his own experience. For more information, check out his Best Crypto Scalping Strategy for the 5 Min Time Frame video. I have tried to automate this a little.
Long or Short trades are determined with a crossing of the fast Ema over the slow Ema for Long and the opposite for Short. Trades should only happen close to the crossovers. Then for Long we use the MACD indicator with a 1min TF (I had better results using the 5min) where we look for high peaks in negative values for Long and vice versa for Shorts. These should be significantly higher than other peaks (or if you will lower peaks for a Long).
Hence, the key is to detect high peaks on the histogram, which I try to achieve by checking if the last 2 values were higher than X bars back. If you want to make it even more specific, then you can turn on the additional checkbox which compares the current value to the average value of X bars back, and if it is greater than, say, 50% the value of the average (= 1.5x the average), then it's ok for the trade.
I also noticed that the strategy often bought at the top or bottom, so I added a check that compares whether the last evaluated bar is the first rising bar (for Long) or falling bar (for Short). This can be turned on or off.
Target profit 0,5% and stop loss 0,4% are based on his recommendation. The strategy is set to take only 1 trade at a time , and you can have a back tester table on.
I'm still a pine script beginner, so the strategy is certainly not perfect and could be improved. If you have any tips on how to improve it further, please let me know. I will try to update it when I have time.
I would also like to thank Joel on Crypto for sharing the strategy and @ZenAndTheArtOfTrading for his great library and code (thanks to him we have a back tester table in here), but especially his educational videos on youtube, which taught me a lot about pine script.
GG ES Scalp IBTT Momentum Strategy v1.0Script for Scalping the ES. Apply it to a 15 second chart. The Momentum Multiplier is a float input and the lower the number the less conservative the strategy is. It doesn't fire signals everyday but its pretty accurate. Send me a message to get access.
CME_MINI:ES1!

AltTrader Scalp & SwingPLEASE READ THIS DESCRIPTION TO SAVE TIME AND UNDERSTAND WHAT THIS INDICATOR DOES
Hello Tradingview World!
It is us, AltSignals, and we're back after many months of working on a new indicator script for anyone to try! Just message us and we will add you to test it out, all feedback is highly appreciated as we're always trying to improve the script.
This script was designed for Cryptocurrency pairs as we know how much you guys love crypto! However it will work on other markets. The AltTrader script uses various indicators in conjunction with each other but the most prominent one is ATR! ATR is truly a secret indicator that many people do not incorporate into their trading strategy, but I have found it to be a great tool for finding trends and predicting tops!
I have made sure to include Take profit 1, Take profit 2 and Stop loss options for AltTrader, this means you can adjust the settings based on percent, make sure to use the measure tool in TradingView if you need to find out the percentage gap of a move. Generally with Crypto pairs the percent moves will be more so 1-5% and with forex much smaller 0.1-0.5% for example.
I have also added in a Power setting which allows you to increase or decrease the number of alerts, the default is set at 100, but you can do it as low as 1 and as high as 500 or more. But remember too many alerts is a curse and over trading may be detrimental to a users performance!
This indicator was designed to work in both small and high timeframe scenarios allowing you to catch small scalp moves and large trend moves, my personal favourite timeframes 15m and 1hr for lower timeframes and 4hr to 1D for higher timeframes. I know it can be tempting to use a low timeframe like 1 minute but there will be a lot of choppy indirection. You don't want to be sitting there all day trading, jumping in and out of every move there is.
I hope this has cleared up some questions for the indicator and I will be happy to answer more over Tradingview Private Messenger if needed. Please message me if you would like a trial as I am looking for feedback as well.
Thank you
AltS Team

L&S PROFIT SCALP Indicator for scalp trades for TF 1-15 minutes. 1-4 signals per day depending on the currency pair. Suitable for all crypto exchanges, Forex, binary options. Signals+ take profit Levels.

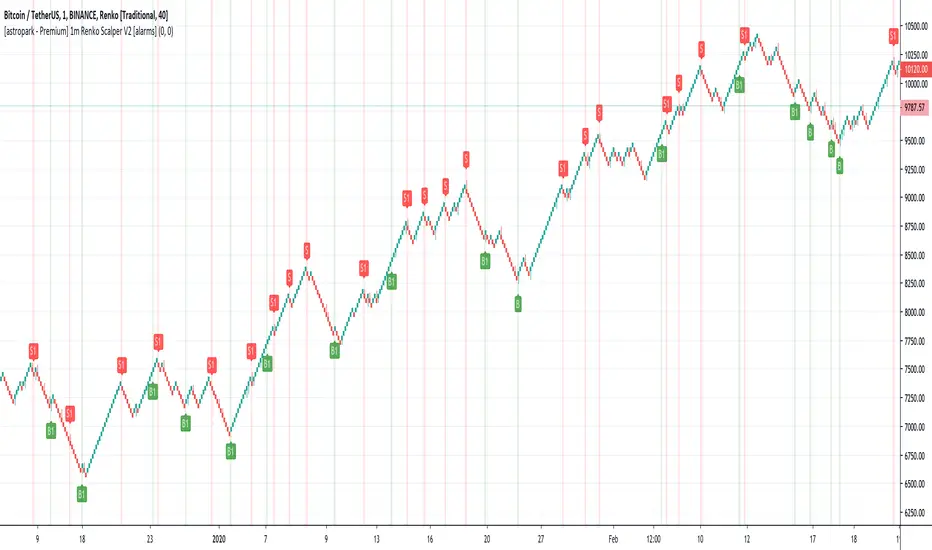
[astropark - Premium] 1m Renko Scalper V2 [alarms]Dear Followers,
today a new Scalper Tool , which works great on 1 minute timeframe , which is the best and more secure timeframe to use on a Renko chart, besides it works great up to 15m (I don't suggest to use a renko chart over 15m timeframe)!
It is an upgraded version of Bitmex Renko Scalper that you can find in my tradingview script page.
This tool has some cool features:
it works on 1 minute timeframe : so you can enjoy high-frequency trading by using a 24/7 running bot;
wait bricks optional mode : you may like to make script wait for triggering a new signal by waiting 1 or 2 more confirmation bricks
trailing stop : you can set a trailing stop in trade, so script will alert you if it will be reached in chart
This strategy can trigger till 5 buy or 5 sell signals in a row before reverting, so use a proper money management .
Strategy results are calculated on the timeframe from july to now, so on about 4 months, using 10000$ as initial capital and working at 3x leverage (very safe leverage!).
The user who wants to use this strategy, especially via an automated bot, must always set a stoploss at 5% from entry point or use a proper risk management strategy .
This is not the "Holy Grail", so use it with caution.
This script will let you set all notifications you may need in order to be alerted on each triggered signals.
The backtesting script version of this indicator, which will let you backtest this script and find best settings for your preferred market, can be found here below:
On Bitmex XBTUSD chart best settings is Traditional Renko chart with 10$ box size.
This is a premium indicator , so send me a private message in order to get access to this script .
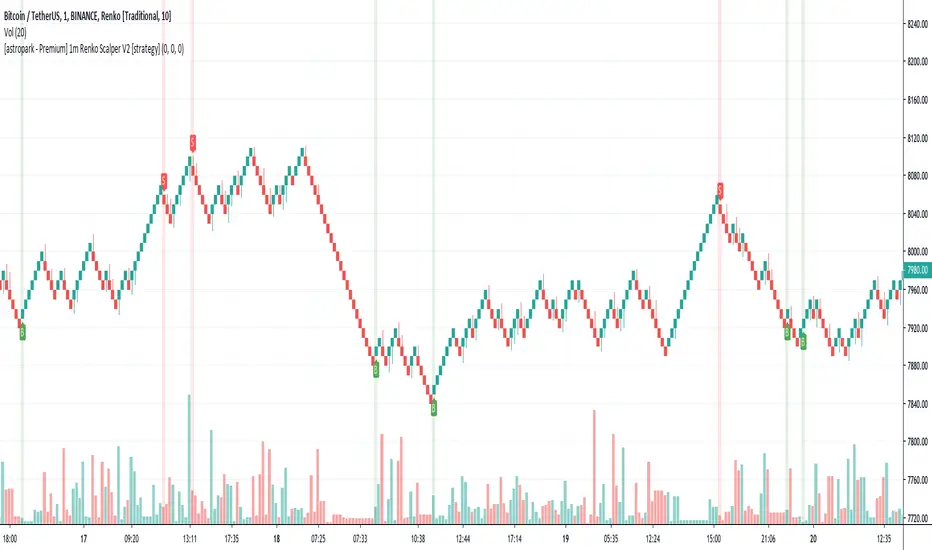
[astropark - Premium] 1m Renko Scalper V2 [strategy]Dear Followers,
today a new Scalper Tool , which works great on 1 minute timeframe , which is the best and more secure timeframe to use on a Renko chart, besides it works great up to 15m (I don't suggest to use a renko chart over 15m timeframe)!
It is an upgraded version of Bitmex Renko Scalper that you can find in my tradingview script page.
This tool has some cool features:
it works on 1 minute timeframe : so you can enjoy high-frequency trading by using a 24/7 running bot;
wait bricks optional mode : you may like to make script wait for triggering a new signal by waiting 1 or 2 more confirmation bricks
trailing stop : you can set a trailing stop in trade, so script will alert you if it will be reached in chart
This strategy can trigger till 5 buy or 5 sell signals in a row before reverting, so use a proper money management .
Strategy results are calculated on the timeframe from july to now, so on about 4 months, using 10000$ as initial capital and working at 3x leverage (very safe leverage!).
The user who wants to use this strategy, especially via an automated bot, must always set a stoploss at 5% from entry point or use a proper risk management strategy .
This is not the "Holy Grail", so use it with caution.
This script will let you backtest this script and find best settings for your preferred market. On Bitmex XBTUSD chart best settings is Traditional Renko chart with 10$ box size.
The alarms version of this indicator, which will let you set all notifications you may need in order to be alerted on each triggered signals, can be found by searching for "1m Renko Scalper V2".
This is a premium indicator , so send me a private message in order to get access to this script .
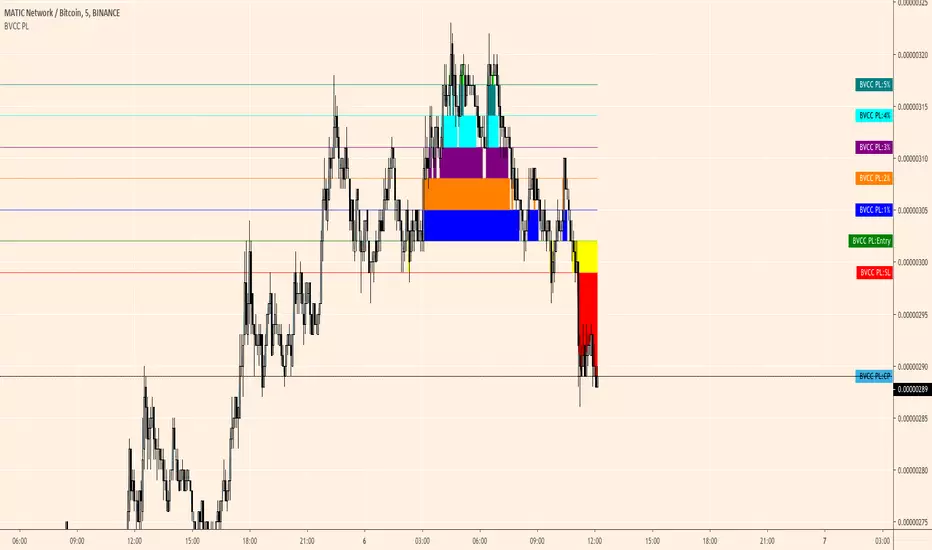
Percent Ladder Scalp Helper [BVCC]This is a simple proof of concept model for a tool that allows you to overlay a percent reference anchored on a specific price point. It projects a ladder of horizontal lines at percent levels 1%, 2%, 3%, 4%, and 5%. It will then begin filling in target zones when price closes above these targets. Above 5% all fills will be lime green, below entry, fill will be yellow as a warning and below SL, red to remind you GTFO of the trade.
this tool is intended for use in quick trade setups where the trader is looking to scalp for small percentages and will help save time in determining % based targets. The colored alarms are a bit fancy but simply serve as a graphical feedback system that can perhaps be developed into something more useful in the future.
User may input entry price and preferred SL in the format dialogue.
If 'auto calculate sat value' is checked, then the user can enter whole numbers for their entry. For instance if your entry is at .00000585 sats, you can just enter 585. If you are working with something besides btc or prefer to enter full sat input, simply uncheck this option.
ABV Scalper - Free Bitcoin Scalper IndicatorExcited to bring you this totally free to use indicator to be used as a scalper for Bitcoin!
You are required to use the following:
Use with Bitfinex charts
Use Heiken Ashi candles
Use the 30m timeframe
UTC time setting
This indicator does not take new entries on weekends given lower volatility in the market. However, if it enters a trade it will manage the position over the weekend for Stop Loss and Take Profit logic.
This indicator is setup to be fully automated!
If you love this indicator and the work we put behind it - please give it a like and share it with your network!


TTM Scalper Indicator v2.0 TTM scalper indicator of John Carter’s Scalper Buys and Sells. The methodology
is a close approximation of the one described in his book Mastering the Trade.
The book is highly recommended. Note the squares are not real-time but will
show up once the third bar has confirmed a reversal.

TTM Scalper Indicator TTM scalper indicator of John Carter’s Scalper Buys and Sells. The methodology
is a close approximation of the one described in his book Mastering the Trade.
The book is highly recommended. Note the squares are not real-time but will
show up once the third bar has confirmed a reversal.

MACD Scalper AnalysisThis is a scalper analysis movement designed around MACD and 200 EMA
The rules are simple:
For long we check if the close of the candle is above the ema200 and we have a crossover between macd and signal
Once this happens we analyse the next candle, if its close higher than open , we can consider it a win and if its close lower than open we consider a lose.
For short we check if the close of the candle is below the ema200 and we have a crossunder between macd and signal
Once this happens we analyse the next candle, if its close higher than open , we can consider it a loss and if its close lower than open we consider a win.
Once we have all of this we analyse the average percentage movement and establish if the specific asset or timeframe is worthy for us.
At the same time it can give a good idea if we can go with a divergence strategy, like for example we have a short entry, but we will actually go long and viceversa.
If you have any questions let me know !

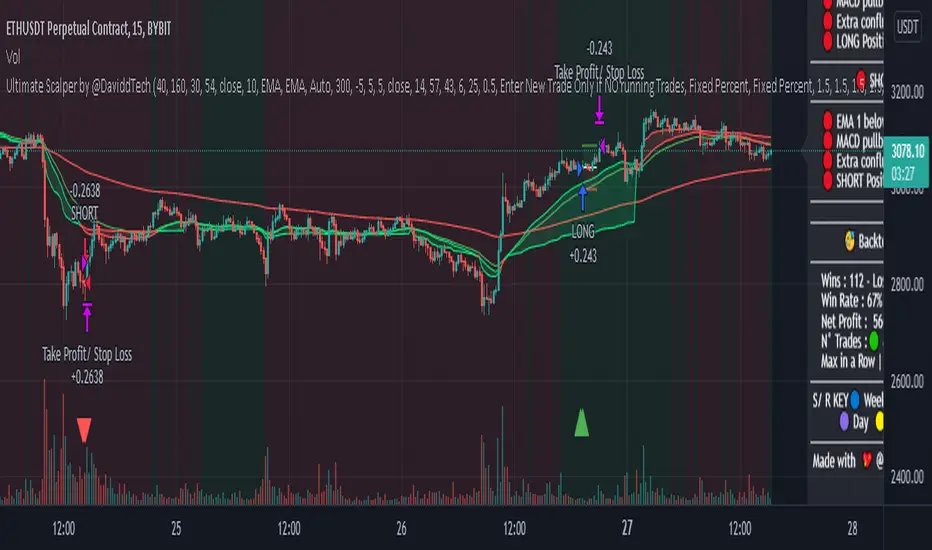
Ultimate Scalper 1.2 @DaviddTechThis script turns out to be a great scalper for Crypto.
Long
* Looks for a pullback in MACD
* EMA 50 over EMA 200
Short
* Looks for a pullback in MACD
* EMA 50 below EMA 200
I use also the ADX for filtering flat markets.
ATR, VWAP and RSI can be used for confluence.
WARNING:
- For purpose educate only - My mission is to debunk fake strategies with code to find THE ONE.
- Plots EMAs and other values on chart.
- This script to change bars colours.
Release Notes: Change the description tabs

Ultimate Scalper by @DaviddTechThis script turns out to be a great scalper for Crypto.
Long
* Looks for a pullback in MACD
* EMA 50 over EMA 200
Short
* Looks for a pullback in MACD
* EMA 50 below EMA 200
VWAP and RSI can be used for confluence.
WARNING:
- For purpose educate only - My mission is to debunk fake strategies with code to find THE ONE.
- Plots EMAs and other values on chart.
- This script to change bars colours.
Release Notes: Change the description tabs
Aggresive Scalper/Swing Crypto StrategyThis is a simple yet very efficient scalper long strategy adapted for low timeframes for crypto. Can also be used with bigger timeframes as a swinger.
Its main components are:
Price oscillator swing
Vortex
Risk management for TP/SL
Rules for entry
We calculate the difference between the oscillator from the lowest low and the highest high. If the difference is positive, its a long potential. If its negative we exit from the long trade.
At the same time we check that the we have a crossover between the VIP vortex with the VIM vortex part.
Lastly we check that the current candle is bigger the second previous high.
Rules for exit
If we reach the take profit or the stop loss.
If we have a negative difference betwee LL and HH and VIP vortex crossunder with VIM vortex .
In this example I aimed for a 1:10 risk reward ratio, meaing that for every dollar lost, we will gain 10 when we win. Thus having a 10% minimum win rate will give us a profit over many trades.
If you have any questions, let me know !

Simple BTC scalper 1minThis is a simple but effiecient 1 min scalper for BTC pairs
Its made of EMA 200 and Stochastic RSI.
Rules are simple :
For long we check that close is above the EMA and that stochastic crosses on the 20 level.
For short we check that close is below the EMA and that stochastic crosses above the 80 level.
We exit long when we enter short, and viceversa for short.
If there are any questions, please let me know !

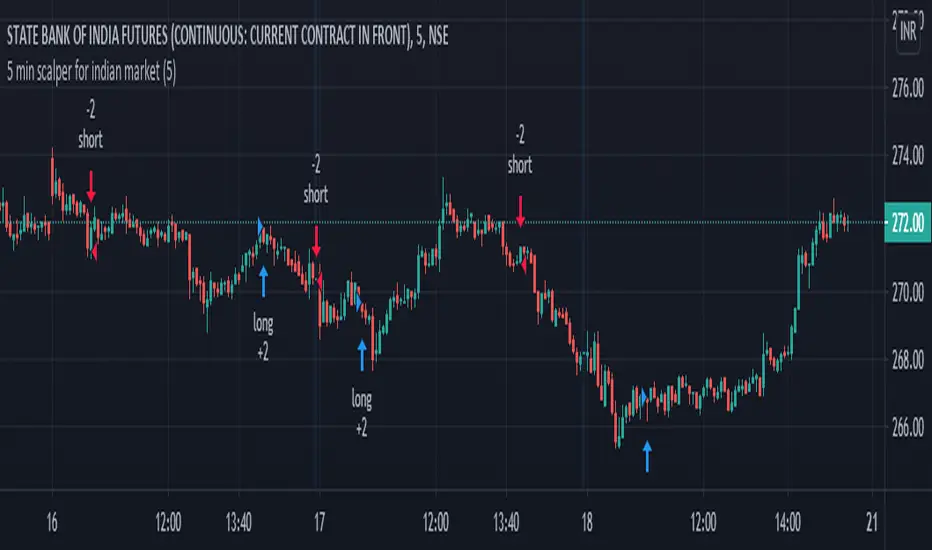
5 min scalper for indian marketHi friends....publishing 5 min scalper for indian market... which shows the movement of price over time and how strong those movements are/will be, regardless of the direction the price moves, up, or down. Indicator specifically useful, as it helps traders and analysts spot points where the market can and will reverse by providing signals long (buy) and short (sell). Show the relative strength of price movements but leave out the directionality of the price movements, best utilized in combination with other technical indicators – such as trend lines and moving averages – which show price trends and directions. Having an alert feature to make aware market players from signals provided by strategy.
It analyz underlying volume and shows buy and sell signal...
U also can modify algo length ..
some tips for new traders to become successful trader
1: always follow risk management...
2: every stock/ forex / crypto has it own cycle.. So pls dont jump from one stock / forex pair to another when u hear some stock / crypto has
made new high or low... Bcs after that consolidation period starts.. During consolidation we can not make more profit as in trending market.. So be patient when u had made some position or tarde in one stock/ pair...
3 : we dont require to trade in every stocks / forex/crypto.. Just one stock and pair trading daily make u profitable beyond ur expection.. Bcs
trading in one stock / forex pair.. make u very comfortable and u may always know its movement... And u also trade in every cycle of this
stock/ pair.. So u also trdae its trend days which made highest profit. We dont know when is trend of any stock... Compare with it
business... Trading is business not one day rich game... Its business... It takes time and u have to do same thing agian and again to become
sucessfull trader for this u can use tradingview alerts. .for that u dont need to seat infrot of ur terminal screen.. u can also do algo trading
by using tradingview alerts
4 : By following risk management and incerase lot size as profit increased... This is the key 🔑 of sucess in stocks / forex / crypto market.
I thinks this tips may help new trader. U can modified according to ur trading style..
You can personal message me if u want to use this strategy
******************if u want to use this indicator u can personal message me********************************************************
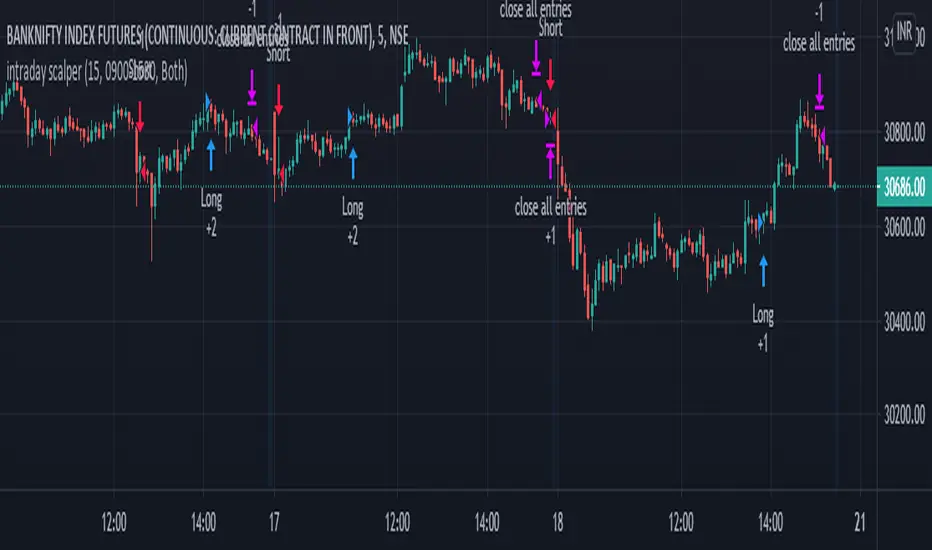
intraday scalper with stopHi friends....publishing intraday scalper which shows the movement of price over time and how strong those movements are/will be, regardless of the direction the price moves, up, or down. Indicator specifically useful, as it helps traders and analysts spot points where the market can and will reverse by providing signals long (buy) and short (sell). Show the relative strength of price movements but leave out the directionality of the price movements, best utilized in combination with other technical indicators – such as trend lines and moving averages – which show price trends and directions. Having an alert feature to make aware market players from signals provided by the indicator.
u can start and close your trades at your define period. Use full for stockmarkets, mcx and forex because all movement occur in new York session....u can set your time to start trading and also for closing. you can also hold position if u want...by changing just close hours at 24..this way u can hold your trade untill next buy/sell signal come..
hope it will help intraday traders
and best of luck to all..
****you can use it any stocks ,forex and crypto**********
some tips for new traders to become sucessful trader
1: always follow risk management...
2: every stock/ forex / crypto has it own cycle.. So pls dont jump from one stock / forex pair to another when u hear some stock / crypto has
made new high or low... Bcs after that consolidation period starts.. During consolidation we can not make more profit as in trending market.. So be patient when u had made some position or tarde in one stock/ pair...
3 : we dont require to trade in every stocks / forex/crypto.. Just one stock and pair trading daily make u profitable beyond ur expection.. Bcs
trading in one stock / forex pair.. make u very comfortable and u may always know its movement... And u also trade in every cycle of this
stock/ pair.. So u also trdae its trend days which made highest profit. We dont know when is trend of any stock... Compare with it
business... Trading is business not one day rich game... Its business... It takes time and u have to do same thing agian and again to become
sucessfull trader for this u can use tradingview alerts. .for that u dont need to seat infrot of ur terminal screen.. u can also do algo trading
by using tradingview alerts
4 : By following risk management and incerase lot size as profit increased... This is the key 🔑 of sucess in stocks / forex / crypto market.
I thinks this tips may help new trader. U can modified according to ur trading style..
You can personal message me if u want to use this strategy
[TrustedSignals] Doji ScalperTrustedSignals Dojji Scalper is our most basic trading algorithm. It is based on Candle Patterns that show potential market reversal points.
The script has 3 different types of signals, which can be individually turned on and off:
- Doji signals, based entirely on the Doji candle pattern and 2 Strong and Weak candle reversal patters
As a bonus, we have included RSI based Support and Resistance bands that, if used correctly can further confirm all the entry signals
All chart signals can be set up as live alerts!

FTU Pivot Scalper Strategy By Ganesh This indicator is suited for intraday trader or swing trader or scalper and BTST trader AND BIG THING IS FOR TECHNOFUNDA INVESTOR
time frame to use: best suitable time frame is 5min and 15 min if ur swing trader then use hourly
intraday rule: buy when arrow suggested with buy with SL below trailing super trend
BTST rule: buy when arrow triggered buy or sell after 3:15 with sl of some tick high above trailing super trend
TECHNOFUNDA investor: buy fundamentally good script check weekly charts buy when weekly close arrow suggest buying with sl of weeks low hold till trailing sl not hit