MYX Malaysia Bursa Futures Derivatives Auto DetectThis indicator intended for Malaysia Market only for auto detect Futures Market Derivatives refer to Bursa Malaysia
Indikator ini adalah untuk pasaran Malaysia sahaja untuk automatik mengenalpasti Derivatif Pasaran Hadapan rujuk kepada Bursa Malaysia
Indicator features :
1. Able to detect futures market.
2. List similar symbol or counter including total.
3. Font size small for mobile app and font size normal for desktop.
4. Show date updated by Bursa Malaysia.
Kemampuan indikator :
1. Boleh mengenal pasti pasaran hadapan.
2. Senarai simbol atau kaunter yang terlibat termasuk jumlah.
3. Saiz font kecil untuk mobile app dan saiz size normal untuk desktop.
4. Memaparkan tarikh kemaskini oleh Bursa Malaysia.
FAQ
1. Credits / Kredit
LucF & PineCoders
2. Code Usage / Penggunaan Kod
Free to use for personal usage.
Bebas untuk kegunaan peribadi.
3. Why table overlap with chart ? To avoid this, click indicator > Visual Order > Send to Front.
Kenapa table bertindih dengan carta ? Untuk mengatasi ini, klik indikator > Visual Order > Send to Front.
4. Some symbols not display such as Commodities Derivatives (OCPO and OPOL) and Equity Derivatives (OKLI).
These symbol are offcially displayed at Bursa Malaysia but not available in Trading View under prefix MYX.
And also Futures Market are not available in Trading View.
Beberapa simbol tidak dapat dipaparkan Derivatif Komoditi (OCPO and OPOL) and Derivatif Equiti (OKLI).
Simbol berikut dipaparkan secara rasmi di Bursa Malaysia tetapi tiada di Trading View di bawah prefix MYX.
Dan Pasaran Hadapan juga tiada di Stock Screener.
All Setting enabled.
Semua seting diaktifkan.
Example of recommended usage.
Contoh penggunaan yang disarankan.
Example of other derivatives. Similar derivatives can be shown.
Contoh derivatif lain. Derivatif yang sama boleh dipaparkan
在腳本中搜尋"screener"

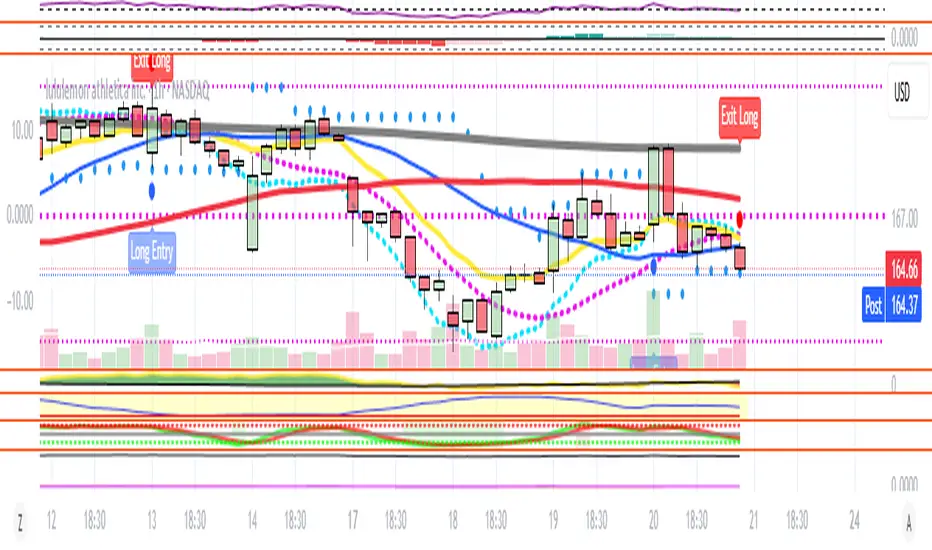
Technical Ratings on Multi-frames / Assets█ OVERVIEW
This indicator is a modified version of TECHNICAL RATING v1.0 available in the public library to provide a quick overview of consolidated technical ratings performed on 12 assets in 3 timeframes.The purpose of the indicator is to provide a quick overview of the current status of the custom 12 (24) assets and to help focus on the appropriate asset.
█ MODIFICATIONS
- Markers, visualizations and alerts have been deleted
- Due to the limitation on maximum number of security (40), the results of 12 assets evaluated in 3 different time frames can be shown at the same time.
- An additional 12 assets can be configured in the settings so that you do not have to choose each ticker one by one to facilitate a quick change, but can switch between the 12 -12 assets with a single click on "Second sets?".
- The position, colors and parameters of the table can be widely customized in the settings.
- The 12 assets can be arranged in rows 3, 4, 6 and 12 with Table Rows options, which can also be used to create a simple mobile view.
- The default gradient color setting has been changed to red/yellow/green traffic lights
ORIGINAL DESCRIPTION ABOUT TECHNICAL RATING v1.0
█ OVERVIEW
This indicator calculates TradingView's well-known "Strong Buy", "Buy", "Neutral", "Sell" or "Strong Sell" states using the aggregate biases of 26 different technical indicators.
█ WARNING
This version is similar, but not identical, to our recently published "Technical Ratings" built-in, which reproduces our "Technicals" ratings displayed as a gauge in the right panel of charts, or in the "Rating" indicator available in the TradingView Screener. This is a fork and refactoring of the code base used in the "Technical Ratings" built-in. Its calculations will not always match those of the built-in, but it provides options not available in the built-in. Up to you to decide which one you prefer to use.
█ FEATURES
Differences with the built-in version
• The built-in version produces values matching the states displayed in the "Technicals" ratings gauge; this one does not always.
• A strategy version is also available as a built-in; this script is an indicator—not a strategy.
• This indicator will show a slightly different vertical scale, as it does not use a fixed scale like the built-in.
• This version allows control over repainting of the signal when you do not use a higher timeframe. Higher timeframe (HTF) information from this version does not repaint.
• You can adjust the weight of the Oscillators and MAs components of the rating here.
• You can configure markers on signal breaches of configurable levels, or on advances declines of the signal.
The indicator's settings allow you to:
• Choose the timeframe you want calculations to be made on.
• When not using a HTF, you can select a repainting or non-repainting signal.
• When using both MAs and Oscillators groups to calculate the rating, you can vary the weight of each group in the calculation. The default is 50/50.
Because the MAs group uses longer periods for some of its components, its value is not as jumpy as the Oscillators value.
Increasing the weight of the MAs group will thus have a calming effect on the signal.
• Alerts can be created on the indicator using the conditions configured to control the display of markers.
Display
The calculated rating is displayed as columns, but you can change the style in the inputs. The color of the signal can be one of three colors: bull, bear, or neutral. You can choose from a few presets, or check one and edit its color. The color is determined from the rating's value. Between 0.1 and -0.1 it is in the neutral color. Above/below 0.1/-0.1 it will appear in the bull/bear color. The intensity of the bull/bear color is determined by cumulative advances/declines in the rating. It is capped to 5, so there are five intensities for each of the bull/bear colors.
The "Strong Buy", "Buy", "Neutral", "Sell" or "Strong Sell" state of the last calculated value is displayed to the right of the last bar for each of the three groups: All, MAs and Oscillators. The first value always reflects your selection in the "Rating uses" field and is the one used to display the signal. A "Strong Buy" or "Strong Sell" state appears when the signal is above/below the 0.5/-0.5 level. A "Buy" or "Sell" state appears when the signal is above/below the 0.1/-0.1 level. The "Neutral" state appears when the signal is between 0.1 and -0.1 inclusively.
Five levels are always displayed: 0.5 and 0.1 in the bull color, zero in the neutral color, and -0.1 and - 0.5 in the bull color.
█ CALCULATIONS
The indicator calculates the aggregate value of two groups of indicators: moving averages and oscillators.
The "MAs" group is comprised of 15 different components:
• Six Simple Moving Averages of periods 10, 20, 30, 50, 100 and 200
• Six Exponential Moving Averages of the same periods
• A Hull Moving Average of period 9
• A Volume-weighed Moving Average of period 20
• Ichimoku
The "Oscillators" group includes 11 components:
• RSI
• Stochastic
• CCI
• ADX
• Awesome Oscillator
• Momentum
• MACD
• Stochastic RSI
• Wiliams %R
• Bull Bear Power
• Ultimate Oscillator

Auto AVWAP (Anchored-VWAP) with Breakout Screener_v2Updated indicator for AWAP breakout. The indicator identified the candle that breaks out of AVWAP

Industry SRS-ARS StrengthThis script show the Relative strength of the script vs selected Industry.
Simply us the Compare Index drop down list to select the Industry you want to compare your symbol with and it will plot a line chart.
The index of the industries have been created based on the highest to lowest Market Cap of the first 10 companies from that industry.
You also have option to choose Static RS period and Adaptive RS date.
####Please note that some industry index may not show a full length back data and the reason may be some companies from that Index may have been listed recently.
I Do it this way.
Step 1 : Check the custom industry index outperformance to the benchmark
Step 2 : Search the companies from that industry. Screener.in is a useful site for this search.
Step 3: Plot this indicator on TradingView and compare the performance of the stock to is industry Index.
This way you can find the best sector/industry outperforming the benchmarck index and then you can short list the outperforming companies from that industry.

Quality Detector (Buffett Style) + Beta [Solid]This indicator acts as an on-chart fundamental screener, designed to instantly evaluate the quality and financial health of a company directly on your price chart.
The concept is inspired by "Buffettology" principles: looking for large, profitable companies with low debt. Additionally, it includes a Beta calculation to assess market volatility risk.
The tool displays a panel in the bottom-right corner featuring four key metrics and a final verdict.
How it Works & Metrics Used
The script retrieves quarterly fundamental data ("FQ") and performs calculations to verify if the asset meets specific criteria.
1. Market Cap (Size)
What it is: The total market value of the company's outstanding shares.
Goal: To identify established, large-cap companies.
Default Threshold: Must be greater than $10 Billion.
2. ROE - Return on Equity (Quality)
What it is: A measure of financial performance calculated by dividing net income by shareholders' equity.
Goal: To find companies that are efficient at generating profits from shareholders' capital.
Default Threshold: Must be higher than 15%.
3. Total Debt to Equity (Health)
What it is: A ratio indicating the relative proportion of shareholders' equity and debt used to finance a company's assets.
Calculation: This script manually calculates this ratio by fetching TOTAL_DEBT and dividing it by TOTAL_EQUITY from fundamental data to ensure robustness across different symbols.
Goal: To ensure the company is not overly leveraged.
Default Threshold: Must be lower than 1.5.
4. Beta (Risk/Volatility)
What it is: A measure of a stock's volatility in relation to the overall market (S&P 500).
Calculation: It is calculated by comparing the asset's returns against SPY (S&P 500 ETF) returns over a 252-day period (approx. 1 trading year).
Goal: To understand if the stock is more volatile (Beta > 1) or less volatile (Beta < 1) than the market.
Note: Beta does not affect the final "Quality" score but serves as an extra risk indicator, highlighting in orange if Beta > 1.
The Verdict (Scoring System)
The indicator assigns a score from 0 to 3 based on the first three fundamental metrics (Size, ROE, and Debt/Equity).
If a metric passes the threshold, it gets a green background and +1 point.
If it fails, it gets a red background.
Final Verdict:
💎 QUALITY GEM: The company passed all 3 fundamental checks (Score = 3/3).
⚠️ DISCARD: The company failed one or more fundamental checks.
Settings
You can customize the thresholds to fit your own investment strategy in the indicator settings:
Minimum Market Cap (in Billions).
Minimum ROE (%).
Maximum Debt/Equity Ratio.
Disclaimer: This tool is for informational and educational purposes only. It relies on third-party fundamental data which may sometimes be delayed or unavailable. Do not base investment decisions solely on this indicator.

Divergence+This powerful, highly customizable divergence detector helps traders spot high-probability reversal and continuation signals with exceptional clarity and precision.
Built on robust zigzag pivot analysis, the indicator identifies classic and hidden divergences between price action and your chosen oscillator (RSI, CCI, Stochastic, MFI, and more — or any external oscillator). It draws clean connecting lines and marks pivots with simple "D" (regular divergence) or "H" (hidden divergence) text labels, making potential trend changes or continuations instantly visible.
Key Features That Make It a Trader's Essential Tool:
Dual-Pane Visualization: Always displays divergences clearly in the oscillator pane, with optional overlay on the main price chart (candles) for context without clutter.
Fully Independent Controls: Toggle lines and labels separately on the price chart — show text-only markers for a minimalist setup, or full lines + labels when needed.
Complete Visual Customization: Adjust colors for every element (oscillator line, divergence lines, and label text) directly from settings. Resize labels independently for the oscillator pane and price chart (tiny for subtlety or large for emphasis).
Smart Alerts: Configurable alerts for bullish/bearish regular and hidden divergences — never miss a setup.
Repainting Option: Choose real-time repainting for faster signals or confirmed pivots for delayed but rock-solid entries.
Flexible Trend Detection: Use zigzag-based, moving average, or external trend signals to accurately classify regular vs. hidden divergences.
Clean & Minimal Design: Text-only labels (no bulky shapes) keep your chart uncluttered while highlighting key pivots.
Whether you're hunting reversals in ranging markets, confirming trend continuations, or fine-tuning entries on higher timeframes, this screener delivers professional-grade divergence analysis with unmatched flexibility. Perfect for day traders, swing traders, and anyone who wants precise, actionable signals without overwhelming visuals.
A must-have tool for elevating your technical analysis game.

TrendlinesDowntrend lines are one of the most important tools in technical analysis. A downtrend line is created by connecting a series of lower highs which forms a clear visual line where price repeatedly finds resistance. Traders use these lines to understand trend direction, time entries, plan exits, and quickly recognize when momentum is shifting.
This indicator automatically finds and maintains the strongest downtrend lines on any timeframe. It removes the guesswork and inconsistency that comes with manually drawing trendlines.
Unlike most other trendline indicators that just draw lines from swing highs to the current high, this indicator actively scans for new pivot highs, tests each potential line against live price action and only promotes a line to valid status once it has proven itself as a true trendline by price touching or respecting the line a user defined number of times, with the default set to three. This filters out noise and leaves only the most meaningful and reliable trendlines on your chart.
When price eventually breaks a respected downtrend line the indicator highlights the breakout immediately. Traders often use these moments for entries confirmation signals or to prepare for a potential shift in market behavior. The breakout alert is built directly into the indicator so you never miss an important move.
This indicator also works with the Pine Screener to find tickers with current valid trendlines.
How are trendlines determined?
The indicator begins by anchoring to the most recent pivot high. From there it draws a temporary line to the current bar and evaluates every bar between the two points.
Each time a high comes within a user selected buffer zone around that line it is counted as a touch. Once the required number of touches is confirmed and price has never exceeded the buffer to the upside the trendline becomes valid and is displayed on the chart as an active downtrend line.

STRAT Private Beta v2.0 – OPTIMIZED (FROZEN)Name: STRAT Private Beta v2.0 – OPTIMIZED (FROZEN)
Timeframe: Weekly only (runs every Friday after US close)
What it does in one sentence:
Scans 200+ liquid stocks, ETFs, indices, and cryptos every Friday night and instantly shows only the highest-conviction STRAT weekly setups that pass Rob Smith’s exact rules (true 2-2 continuations + Rev Strats, FTC ≥ 80 %, no broadening, no earnings weeks, 3:1 minimum R:R).
What you see every Friday after 4 pm ET:
0–12 tickers (usually 4–8) with a big green “L” (long) or red “S” (short)
Exact entry, stop, and 3R target printed on the chart and in alerts
FTC percentage (80–100 %) so you know conviction level
Nothing else – if there’s no clean setup, it stays silent
How to use it (testers only):
Click the invite link → add script to TradingView
Open the regular Stock Screener → select watchlist “STRAT Universe”
Load saved layout “STRAT Weekly Live” (or add the 4 columns)
Every Friday after close: refresh → see the short list → place 1 % risk bracket orders → done until next Friday.
Zero daily monitoring. Zero discretion. Pure frozen STRAT rules.

Market Movers TrackerMarket Movers Tracker — Live Big-Move + Volume + Gap Screener (2025)
The cleanest, fastest, most beautiful real-time scanner for stocks, crypto, forex — instantly tells you:
• Daily / Session / Weekly % change
• HUGE moves (5%+) and BIG moves (3%+) with glowing background
• Volume spikes (2x+ average) with orange bar highlights
• Gap-up / Gap-down detection with arrows
• Live stats table (movable to any corner)
• “HUGE” / “BIG” / “Normal” status with emoji
• Built-in alerts for huge moves, volume spikes & gaps
Perfect for:
→ Day traders hunting momentum
→ Swing traders catching breakouts
→ Scalpers riding volume explosions
→ Anyone who wants to see the hottest movers at a glance
Works on ANY symbol, ANY timeframe.
Zero lag. Zero repainting. Pure price + volume truth.
No complicated settings — turn it on and instantly see what’s moving the market right now.
Not financial advice. Just the sharpest scanner on TradingView.
Made with love for the degens, apes, and momentum chads & volume junkies.

Relative Strength Heatmap [BackQuant]Relative Strength Heatmap
A multi-horizon RSI matrix that compresses 20 different lookbacks into a single panel, turning raw momentum into a visual “pressure gauge” for overbought and oversold clustering, trend exhaustion, and breadth of participation across time horizons.
What this is
This indicator builds a strip-style heatmap of 20 RSIs, each with a different length, and stacks them vertically as colored tiles in a single pane. Every tile is colored by its RSI value using your chosen palette, so you can see at a glance:
How many “fast” versus “slow” RSIs are overbought or oversold.
Whether momentum is concentrated in the short lookbacks or spread across the whole curve.
When momentum extremes cluster, signalling strong market pressure or exhaustion.
On top of the tiles, the script plots two simple breadth lines:
A white line that counts how many RSIs are above 70 (overbought cluster).
A black line that counts how many RSIs are below 30 (oversold cluster).
This turns a single symbol’s RSI ladder into a compact “market pressure gauge” that shows not only whether RSI is overbought or oversold, but how many different horizons agree at the same time.
Core idea
A single RSI looks at one length and one timescale. Markets, however, are driven by flows that operate on multiple horizons at once. By computing RSI over a ladder of lengths, you approximate a “term structure” of strength:
Short lengths react to immediate swings and very recent impulses.
Medium lengths reflect swing behaviour and local trends.
Long lengths reflect structural bias and higher timeframe regime.
When many lengths agree, for example 10 or more RSIs all above 70, it suggests broad participation and strong directional pressure. When only a few fast lengths stretch to extremes while longer ones stay neutral, the move is more fragile and more likely to mean-revert.
This script makes that structure visible as a heatmap instead of forcing you to run many separate RSI panes.
How it works
1) Generating RSI lengths
You control three parameters in the calculation settings:
RS Period – the base RSI length used for the shortest strip.
RSI Step – the amount added to each successive RSI length.
RSI Multiplier – a global scaling factor applied after the step.
Each of the 20 RSIs uses:
RSI length = round((base_length + step × index) × multiplier) , where the index goes from 0 to 19.
That means:
RSI 1 uses (len + step × 0) × mult.
RSI 2 uses (len + step × 1) × mult.
…
RSI 20 uses (len + step × 19) × mult.
You can keep the ladder dense (small step and multiplier) or stretch it across much longer horizons.
2) Heatmap layout and grouping
Each RSI is plotted as an “area” strip at a fixed vertical level using histbase to stack them:
RSI 1–5 form Group 1.
RSI 6–10 form Group 2.
RSI 11–15 form Group 3.
RSI 16–20 form Group 4.
Each group has a toggle:
Show only Group 1 and 2 if you care mainly about fast and medium horizons.
Show all groups for a full spectrum from very short to very long.
Hide any group that feels redundant for your workflow.
The actual numeric RSI values are not plotted as lines. Instead, each strip is drawn as a horizontal band whose fill color represents the current RSI regime.
3) Palette-based coloring
Each tile’s color is driven by the RSI value and your chosen palette. The script includes several palettes:
Viridis – smooth green to yellow, good for subtle reading.
Jet – strong blue to red sequence with high contrast.
Plasma – purple through orange to yellow.
Custom Heat – cool blues to neutral grey to hot reds.
Gray – grayscale from white to black for minimalistic layouts.
Cividis, Inferno, Magma, Turbo, Rainbow – additional scientific and rainbow-style maps.
Internally, RSI values are bucketed into ranges (for example, below 10, 10–20, …, 90–100). Each bucket maps to a unique colour for that palette. In all schemes, low RSI values are mapped to the “cold” or darker side and high RSI values to the “hot” or brighter side.
The result is a true momentum heatmap:
Cold or dark tiles show low RSI and oversold or compressed conditions.
Mid tones show neutral or mid-range RSI.
Warm or bright tiles show high RSI and overbought or stretched conditions.
4) Bull and bear breadth counts
All 20 RSI values are collected into an array each bar. Two counters are then calculated:
Bull count – how many RSIs are above 70.
Bear count – how many RSIs are below 30.
These are plotted as:
A white line (“RSI > 70 Count”) for the overbought cluster.
A black line (“RSI < 30 Count”) for the oversold cluster.
If you enable the “Show Bull and Bear Count” option, you get an immediate reading of how many of the 20 horizons are stretched at any moment.
5) Cluster alerts and background tagging
Two alert conditions monitor “strong cluster” regimes:
RSI Heatmap Strong Bull – triggers when at least 10 RSIs are above 70.
RSI Heatmap Strong Bear – triggers when at least 10 RSIs are below 30.
When one of these conditions is true, the indicator can tint the background of the chart using a soft version of the current palette. This visually marks stretches where momentum is extreme across many lengths at once, not just on a single RSI.
What it plots
In one oscillator window, the indicator provides:
Up to 20 horizontal RSI strips, each representing a different RSI length.
Color-coded tiles reflecting the current RSI value for each length.
Group toggles to show or hide each block of five RSIs.
An optional white line that counts how many RSIs are above 70.
An optional black line that counts how many RSIs are below 30.
Optional background highlights when the number of overbought or oversold RSIs passes the strong-cluster threshold.
How it measures breadth and pressure
Single-symbol breadth
Breadth is usually defined across a basket of symbols, such as how many stocks advance versus decline. This indicator uses the same concept across time horizons for a single symbol. The question becomes:
“How many different RSI lengths are stretched in the same direction at once?”
Examples:
If only 2 or 3 of the shortest RSIs are above 70, bull count stays low. The move is fast and local, but not yet broadly supported.
If 12 or more RSIs across short, medium and long lengths are above 70, the bull count spikes. The move has broad momentum and strong upside pressure.
If 10 or more RSIs are below 30, bear count spikes and you are in a broad oversold regime.
This is breadth of momentum within one market.
Market pressure gauge
The combination of heatmap tiles and breadth lines acts as a pressure gauge:
High bull count with warm colors across most strips indicates strong upside pressure and crowded long positioning.
High bear count with cold colors across most strips indicates strong downside pressure and capitulation or forced selling.
Low counts with a mixed heatmap indicate neutral pressure, fragmented flows, or range-bound conditions.
You can treat the strong-cluster alerts as “extreme pressure” signals. When they fire, the market is heavily skewed in one direction across many horizons.
How to read the heatmap
Horizontal patterns (through time)
Look along the time axis and watch how the colors evolve:
Persistent hot tiles across many strips show sustained bullish pressure and trend strength.
Persistent cold tiles across many strips show sustained bearish pressure and weak demand.
Frequent flipping between hot and cold colours indicates a choppy or mean-reverting environment.
Vertical structure (across lengths at one bar)
Focus on a single bar and read the column of tiles from top to bottom:
Short RSIs hot, long RSIs neutral or cool: early trend or short-term fomo. Price has moved fast, longer horizons have not caught up.
Short and long RSIs all hot: mature, entrenched uptrend. Broad participation, high pressure, greater risk of blow-off or late-entry vulnerability.
Short RSIs cold but long RSIs mid to high: pullback in a higher timeframe uptrend. Dip-buy and continuation setups are often found here.
Short RSIs high but long RSIs low: countertrend rallies within a broader downtrend. Good hunting ground for fades and short entries after a bounce.
Bull and bear breadth lines
Use the two lines as simple, numeric breadth indicators:
A rising white line shows more RSIs pushing above 70, so bullish pressure is expanding in breadth.
A rising black line shows more RSIs pushing below 30, so bearish pressure is expanding in breadth.
When both lines are low and flat, few horizons are extreme and the market is in mid-range territory.
Cluster zones
When either count crosses the strong threshold (for example 10 out of 20 RSIs in extreme territory):
A strong bull cluster marks a broadly overbought regime. Trend followers may see this as confirmation. Mean-reversion traders may see it as a late-stage or blow-off context.
A strong bear cluster marks a broadly oversold regime. Downtrend traders see strong pressure, but the risk of sharp short-covering bounces also increases.
Trading applications
Trend confirmation
Use the heatmap and breadth lines as a trend filter:
Prefer long setups when the heatmap shows mostly mid to high RSIs and the bull count is rising.
Avoid fresh shorts when there is a strong bull cluster, unless you are specifically trading exhaustion.
Prefer short setups when the heatmap is mostly low RSIs and the bear count is rising.
Avoid aggressive longs when a strong bear cluster is active, unless you are trading reflexive bounces.
Mean-reversion timing
Treat cluster extremes as exhaustion zones:
Look for reversal patterns, failed breakouts, or order flow shifts when bull count is very high and price starts to stall or diverge.
Look for reflexive bounce potential when bear count is very high and price stops making new lows or shows absorption at the lows.
Use the palette and counts together: hot tiles plus a peaking white line can mark blow-off conditions, cold tiles plus a peaking black line can mark capitulation.
Regime detection and risk toggling
Use the overall shape of the ladder over time:
If upper strips stay warm and lower strips stay neutral or warm for extended periods, the market is in an uptrend regime. You can justify higher risk for long-biased strategies.
If upper strips stay cold and lower strips stay neutral or cold, the market is in a downtrend regime. You can justify higher risk for short-biased strategies or defensive positioning.
If colours and counts flip frequently, you are likely in a range or choppy regime. Consider reducing size or using more tactical, short-term strategies.
Multi-horizon synchronization
You can think of each RSI length as a proxy for a different “speed” of the same market:
When only fast RSIs are stretched, the move is local and less robust.
When fast, medium and slow RSIs align, the move has multi-horizon confirmation.
You can require a minimum bull or bear count before allowing your main strategy to engage.
Spotting hidden shifts
Sometimes price appears flat or drifting, but the heatmap quietly cools or warms:
If price is sideways while many hot tiles fade toward neutral, momentum is decaying under the surface and trend risk is increasing.
If price is sideways while many cold tiles climb back toward neutral, selling pressure is decaying and the tape is repairing itself.
Settings overview
Calculation Settings
RS Period – base RSI length for the shortest strip.
RSI Step – the increment added to each successive RSI length.
RSI Multiplier – scales all generated RSI lengths.
Calculation Source – the input series, such as close, hlc3 or others.
Plotting and Coloring Settings
Heatmap Color Palette – choose between Viridis, Jet, Plasma, Custom Heat, Gray, Cividis, Inferno, Magma, Turbo or Rainbow.
Show Group 1 – toggles RSI 1–5.
Show Group 2 – toggles RSI 6–10.
Show Group 3 – toggles RSI 11–15.
Show Group 4 – toggles RSI 16–20.
Show Bull and Bear Count – enables or disables the two breadth lines.
Alerts
RSI Heatmap Strong Bull – fires when the number of RSIs above 70 reaches or exceeds the configured threshold (default 10).
RSI Heatmap Strong Bear – fires when the number of RSIs below 30 reaches or exceeds the configured threshold (default 10).
Tuning guidance
Fast, tactical configurations
Use a small base RS Period, for example 2 to 5.
Use a small RSI Step, for tight clustering around the fast horizon.
Keep the multiplier near 1.0 to avoid extreme long lengths.
Focus on Group 1 and Group 2 for intraday and short-term trading.
Swing and position configurations
Use a mid-range RS Period, for example 7 to 14.
Use a moderate RSI Step to fan out into slower horizons.
Optionally use a multiplier slightly above 1.0.
Keep all four groups enabled for a full view from fast to slow.
Macro or higher timeframe configurations
Use a larger base RS Period.
Use a larger RSI Step so the top of the ladder reaches very slow lengths.
Focus on Group 3 and Group 4 to see structural momentum.
Treat clusters as regime markers rather than frequent trading signals.
Notes
This indicator is a contextual tool, not a standalone trading system. It does not model execution, spreads, slippage or fundamental drivers. Use it to:
Understand whether momentum is narrow or broad across horizons.
Confirm or filter existing signals from your primary strategy.
Identify environments where the market is crowded into one side.
Distinguish between isolated spikes and truly broad pressure moves.
The Relative Strength Heatmap is designed to answer a simple but powerful question:
“How many versions of RSI agree with what I am seeing on the chart?”
By compressing those answers into a single panel with clear colour coding and breadth lines, it becomes a practical, visual gauge of momentum breadth and market pressure that you can overlay on any trading framework.


Divergence Scanner
Scanner and Indication (Divergence Scanner & Signal)An advanced experimental indicator designed to detect instances of Divergence between price action and key oscillator metrics (e.g., RSI or MACD).The primary function of this script is for Screener use. It plots a numerical value (a value greater than zero) on the chart when a confirmed bullish or bearish divergence signal appears."

MA Crossover Scalper [4H]//@version=5
indicator("MA Crossover Scalper ", overlay=false)
// Market Cap Filter (Volume as proxy)
volumeValid = volume >= 500000 and volume <= 4000000
// MA Crossover System
ma9 = ta.sma(close, 9)
ma21 = ta.sma(close, 21)
bullishCross = ta.crossover(ma9, ma21) and close > ma21
bearishCross = ta.crossunder(ma9, ma21) and close < ma21
// Volume Confirmation
volumeSpike = volume > ta.sma(volume, 20) * 1.3
// Final Signals
bullSignal = bullishCross and volumeSpike and volumeValid
bearSignal = bearishCross and volumeSpike and volumeValid
// Output for Screener
plot(bullSignal ? 1 : 0, "Bull MA Cross", color=color.green)
plot(bearSignal ? 1 : 0, "Bear MA Cross", color=color.red)

[NBK] Cover Buy Sell for BTC Cover Buy Sell for BTC— Engulfing Reversals with EMA/ATR Trend & Quality Filters
{Update for BTC}
What it does
This indicator flags high-quality bullish/bearish reversal candles only when they align with a short-term trend and pass several objective quality filters. It is not a simple mashup: each component serves a distinct role and they work together to keep early/low-quality signals out.
How it works (components & interaction)
Pattern engine (entry candidates)
Bullish side (Cover Buy):
Body Engulf: current green body fully covers the prior red body, or
Piercing (relaxed): prior red → current green closes above the prior body’s midpoint (not beyond prior open).
Bearish side (Cover Sell):
Full-candle Engulf: current red candle (body + wicks) covers the entire prior candle, or
Body Engulf: current red body fully covers the prior body, or
Dark-Cloud (relaxed): prior green → current red closes below the prior body’s midpoint.
Short-term trend gate (non-repainting)
Trend is defined by the EMA slope between bar-1 and bar-2, scaled by ATR to require minimum strength.
Slope < 0 → only bullish candidates pass. Slope > 0 → only bearish candidates pass.
Body-size filter (noise control)
Rejects tiny candles: each body is compared with the lookback average body size.
For bearish candidates an additional ratio check requires current body ≥ a fraction of the prior body (to avoid weak top-ticks).
Peak filters for bearish signals (late, cleaner tops)
Distance above EMA: the high must be at least X × ATR above EMA (avoids mid-range noise).
Near local high: the high of the current bar (or bar-1) must be close to the highest high in a recent window.
Break confirmation: close must break low by at least Y × ATR (filters shallow dark-clouds).
Only when a candidate satisfies the pattern ➝ trend ➝ size ➝ peak sequence is a signal printed/alerted.
Inputs (key parameters)
EMA length, Min EMA slope vs ATR, ATR length: trend strength.
Lookback for average body, Min body vs average, Bear body ratio: body-quality filters.
High distance above EMA (×ATR), Local high lookback, Tolerance to local high (×ATR), Min break of low (×ATR): bearish peak confirmation.
Alerts
Built-in alerts fire on bar close for both Cover Buy and Cover Sell.
How to use
Increase High distance above EMA / Local high lookback / Min break of low to reduce early Cover Sell in ranges.
If you miss good tops, ease those thresholds slightly.
Works across symbols/timeframes; evaluated on bar close; no repaint from the trend gate.
Notes
This tool is a signal screener, not financial advice. For best results, combine with your structure/SR zones, risk management, and execution rules.
13 thg 10
Phát hành các Ghi chú
Cover Buy Sell — Engulfing Reversals with EMA/ATR Trend & Quality/Peak Filters
What this script does
Flags high-quality bullish/bearish engulfing reversals only when short-term trend and price-action quality conditions are met. Signals evaluate on bar close. No promotions, no links, no external calls.
Why this is an original combination (mashup justification)
Raw engulfing patterns are noisy in ranges. This script is a pipeline where each module solves a specific failure mode, not a simple merge of indicators:
Pattern engine (candidates):
Bullish (Cover Buy): body-engulf of prior red body, or relaxed Piercing (close above prior body midpoint, not beyond prior open).
Bearish (Cover Sell): full-candle engulf (body+wicks), body-engulf, or relaxed Dark-Cloud (close below prior body midpoint).
Short-term trend gate (non-repainting):
EMA slope is measured between bar-1 and bar-2 and must exceed an ATR-scaled threshold (slopeAtrPct).
Slope < 0 → only bullish candidates pass.
Slope > 0 → only bearish candidates pass.
Body-size filter (noise control):
Bodies must not be tiny vs the average over lenBodyRef. For bearish candidates, an alternate check allows current body ≥ bearRatioMin × prior body to keep decisive tops.
Bearish peak filters (late, cleaner tops):
High must be far above EMA (≥ emaDistAtrMin × ATR), near the local high (current or prior bar within nearHighLen & nearHighTol × ATR), and the close must break prior low by ≥ breakAtrMin × ATR.
These remove premature Cover Sell flags in chop and keep the later, higher-quality reversal.
Only candidates that pass Pattern → Trend → Size → Peak become signals. This staged design is the core originality.
How to use (practical guidance)
To reduce early Cover Sell in ranges: raise emaDistAtrMin, raise nearHighLen, and/or raise breakAtrMin.
If you miss clean tops: slightly lower those thresholds.
Typical starting points: lenTrend=4–6, slopeAtrPct=0.03–0.06, atrLen=14; adjust to instrument/TF volatility.
Combine with structure/SR zones and your risk rules. This tool is for analysis only and is not investment advice.
Alerts
Two alert conditions are included: Cover Buy and Cover Sell, both evaluated on bar close.
Non-repainting note
The trend gate uses confirmed data (EMA slope from bar-1 vs bar-2). Pattern and filters also use confirmed values; no forward-looking references.
English translations of UI strings (if your on-chart UI uses another language)
“Strict engulf (không cho bằng nhau)” → Strict engulf (no equality)
“EMA length (trend ngắn hạn)” → EMA length (short-term trend)
“Lookback tính thân trung bình” → Lookback for average body size
“Ngưỡng thân tối thiểu vs trung bình” → Min body vs average (ratio)
“Bear: thân hiện tại ≥ rRatio * thân trước” → Bear: current body ≥ rRatio × prior body
“Bear: HIGH cách EMA tối thiểu (x ATR)” → Bear: HIGH distance above EMA (× ATR) min
“Bear: cửa sổ đỉnh cục bộ (bars)” → Bear: local high lookback (bars)
“Bear: dung sai tới đỉnh (x ATR)” → Bear: tolerance to local high (× ATR)
“Bear: mức phá LOW tối thiểu (x ATR)” → Bear: min break of LOW (× ATR)
Compliance notes
English-only title, English appears first in this description; no ads, logos, links, or solicitations.
This is an original, closed-source script with a meaningful explanation of what, how, why, and how to use.
(Vietnamese short summary)
Chỉ báo bắt tín hiệu engulfing chất lượng cao khi có xu hướng EMA ngắn hạn (đo bằng độ dốc/ATR) và vượt qua lọc kích thước thân + điều kiện đỉnh cho tín hiệu bán. Chuỗi xử lý Mẫu → Xu hướng → Kích thước → Đỉnh giúp loại tín hiệu sớm trong vùng đi ngang. Có alert Cover Buy/Sell, đánh giá theo bar close, không quảng cáo/đường link, và không phải khuyến nghị đầu tư.

[NBK] Cover Buy Sell for XAU Cover Buy Sell for XAU — Engulfing Reversals with EMA/ATR Trend & Quality Filters
{Update for XAU}
What it does
This indicator flags high-quality bullish/bearish reversal candles only when they align with a short-term trend and pass several objective quality filters. It is not a simple mashup: each component serves a distinct role and they work together to keep early/low-quality signals out.
How it works (components & interaction)
Pattern engine (entry candidates)
Bullish side (Cover Buy):
Body Engulf: current green body fully covers the prior red body, or
Piercing (relaxed): prior red → current green closes above the prior body’s midpoint (not beyond prior open).
Bearish side (Cover Sell):
Full-candle Engulf: current red candle (body + wicks) covers the entire prior candle, or
Body Engulf: current red body fully covers the prior body, or
Dark-Cloud (relaxed): prior green → current red closes below the prior body’s midpoint.
Short-term trend gate (non-repainting)
Trend is defined by the EMA slope between bar-1 and bar-2, scaled by ATR to require minimum strength.
Slope < 0 → only bullish candidates pass. Slope > 0 → only bearish candidates pass.
Body-size filter (noise control)
Rejects tiny candles: each body is compared with the lookback average body size.
For bearish candidates an additional ratio check requires current body ≥ a fraction of the prior body (to avoid weak top-ticks).
Peak filters for bearish signals (late, cleaner tops)
Distance above EMA: the high must be at least X × ATR above EMA (avoids mid-range noise).
Near local high: the high of the current bar (or bar-1) must be close to the highest high in a recent window.
Break confirmation: close must break low by at least Y × ATR (filters shallow dark-clouds).
Only when a candidate satisfies the pattern ➝ trend ➝ size ➝ peak sequence is a signal printed/alerted.
Inputs (key parameters)
EMA length, Min EMA slope vs ATR, ATR length: trend strength.
Lookback for average body, Min body vs average, Bear body ratio: body-quality filters.
High distance above EMA (×ATR), Local high lookback, Tolerance to local high (×ATR), Min break of low (×ATR): bearish peak confirmation.
Alerts
Built-in alerts fire on bar close for both Cover Buy and Cover Sell.
How to use
Increase High distance above EMA / Local high lookback / Min break of low to reduce early Cover Sell in ranges.
If you miss good tops, ease those thresholds slightly.
Works across symbols/timeframes; evaluated on bar close; no repaint from the trend gate.
Notes
This tool is a signal screener, not financial advice. For best results, combine with your structure/SR zones, risk management, and execution rules.
13 thg 10
Phát hành các Ghi chú
Cover Buy Sell — Engulfing Reversals with EMA/ATR Trend & Quality/Peak Filters
What this script does
Flags high-quality bullish/bearish engulfing reversals only when short-term trend and price-action quality conditions are met. Signals evaluate on bar close. No promotions, no links, no external calls.
Why this is an original combination (mashup justification)
Raw engulfing patterns are noisy in ranges. This script is a pipeline where each module solves a specific failure mode, not a simple merge of indicators:
Pattern engine (candidates):
Bullish (Cover Buy): body-engulf of prior red body, or relaxed Piercing (close above prior body midpoint, not beyond prior open).
Bearish (Cover Sell): full-candle engulf (body+wicks), body-engulf, or relaxed Dark-Cloud (close below prior body midpoint).
Short-term trend gate (non-repainting):
EMA slope is measured between bar-1 and bar-2 and must exceed an ATR-scaled threshold (slopeAtrPct).
Slope < 0 → only bullish candidates pass.
Slope > 0 → only bearish candidates pass.
Body-size filter (noise control):
Bodies must not be tiny vs the average over lenBodyRef. For bearish candidates, an alternate check allows current body ≥ bearRatioMin × prior body to keep decisive tops.
Bearish peak filters (late, cleaner tops):
High must be far above EMA (≥ emaDistAtrMin × ATR), near the local high (current or prior bar within nearHighLen & nearHighTol × ATR), and the close must break prior low by ≥ breakAtrMin × ATR.
These remove premature Cover Sell flags in chop and keep the later, higher-quality reversal.
Only candidates that pass Pattern → Trend → Size → Peak become signals. This staged design is the core originality.
How to use (practical guidance)
To reduce early Cover Sell in ranges: raise emaDistAtrMin, raise nearHighLen, and/or raise breakAtrMin.
If you miss clean tops: slightly lower those thresholds.
Typical starting points: lenTrend=4–6, slopeAtrPct=0.03–0.06, atrLen=14; adjust to instrument/TF volatility.
Combine with structure/SR zones and your risk rules. This tool is for analysis only and is not investment advice.
Alerts
Two alert conditions are included: Cover Buy and Cover Sell, both evaluated on bar close.
Non-repainting note
The trend gate uses confirmed data (EMA slope from bar-1 vs bar-2). Pattern and filters also use confirmed values; no forward-looking references.
English translations of UI strings (if your on-chart UI uses another language)
“Strict engulf (không cho bằng nhau)” → Strict engulf (no equality)
“EMA length (trend ngắn hạn)” → EMA length (short-term trend)
“Lookback tính thân trung bình” → Lookback for average body size
“Ngưỡng thân tối thiểu vs trung bình” → Min body vs average (ratio)
“Bear: thân hiện tại ≥ rRatio * thân trước” → Bear: current body ≥ rRatio × prior body
“Bear: HIGH cách EMA tối thiểu (x ATR)” → Bear: HIGH distance above EMA (× ATR) min
“Bear: cửa sổ đỉnh cục bộ (bars)” → Bear: local high lookback (bars)
“Bear: dung sai tới đỉnh (x ATR)” → Bear: tolerance to local high (× ATR)
“Bear: mức phá LOW tối thiểu (x ATR)” → Bear: min break of LOW (× ATR)
Compliance notes
English-only title, English appears first in this description; no ads, logos, links, or solicitations.
This is an original, closed-source script with a meaningful explanation of what, how, why, and how to use.
(Vietnamese short summary)
Chỉ báo bắt tín hiệu engulfing chất lượng cao khi có xu hướng EMA ngắn hạn (đo bằng độ dốc/ATR) và vượt qua lọc kích thước thân + điều kiện đỉnh cho tín hiệu bán. Chuỗi xử lý Mẫu → Xu hướng → Kích thước → Đỉnh giúp loại tín hiệu sớm trong vùng đi ngang. Có alert Cover Buy/Sell, đánh giá theo bar close, không quảng cáo/đường link, và không phải khuyến nghị đầu tư.

Liquidity & inducementsHi all!
This indicator will show liquidity and inducements.
I will continue to try to add different types of liquidity and inducements, at this moment it contains 6 kinds of liquidity/inducement, they are:
• Grabs
• Big grabs
• Sweeps
• Turtle soups
• Equal highs/lows (liquidity and inducement)
• BSL & SSL
And 1 type of inducement:
• Retracement
This description will contain indicator examples of each individual liquidity and inducement. They will all be with the default settings.
Settings
First you will find settings for the market structure (BOS/CHoCH/CHoCH+). Select left and right pivot lengths and if the pivots should have a label or not.
This is the base foundation of this indicator and is possible with my library 'PriceAction' ().
You will see solid lines for break of structures (BOS), change of characters (CHoCH) and change of character plus (CHoCH+).
The pivots found will be the core of this indicator and will show you when the closing price breaks it. When that happens a break of structure (BOS) or a change of character (CHoCH or CHoCH+) will be created. The latest 5 pivots found within the current trend will be kept to take action on.
A break of structure is removed if an earlier pivot within the same trend is broken and the pivot's high price for a bullish trend or low price for a bearish trend is more extreme than the BOS pivot's price.
You are able to show the pivots that are used. "HH" (higher high), "HL" (higher low), "LH" (lower high), "LL" (lower low) and "H"/"L" (for pivots (high/low) when the trend has changed) are the labels used.
In the next section ('Liquidity ($$$)') you can select which types of liquidity you want to see. Note that 'Equal highs/lows' can also show inducement (more on that later).
In the section afterwards ('Inducement (IDM)') you can select if you want retracement inducements to be visible or not. More information on what they are later on.
The section for each individual liquidity and/or inducement can first contain a line named 'Pivot', where you can set the pivot lengths (first left, then right). Then you can set the 'Lookback', which means that the 'Lookback' number of past pivots is to take action on. After that you set the 'Timeframe' for the pivots used. That means that all available liquidity/inducements will be from your desired timeframe. Lastly you set the color of the liquidity/inducement (either a single color or bullish followed by bearish colors).
Lastly in the settings you can select the font sizes for the market structure and liquidity/inducements and what style liquidity/inducements lines will have. The sizes defaults to 7 and has a dotted line look.
Grabs
Liquidity grabs and liquidity sweeps are very similar. It all depends on if the current bar closed above/below the liquidity pivot and on if its a continuation or reversal. In a liquidity grab the bar that's above or below the liquidity pivot was not closed above or below it. Like this:
Or
The visual feedback will be a dotted line between the liquidity pivot and liquidity grab bar and a linefill between the high of the liquidity grab bar and the liquidity pivot.
Indicator example:
Big grabs
This is another 'grabs' option. You can show an additional grab if you want to. I suggest having this grab from a higher timeframe or with larger pivot lengths than the other grab.
The default is with the chart timeframe and 10/10 as pivot lengths.
Indicator example:
Sweeps
A liquidity sweep is like a liquidity grab but with the difference that price closes above/below and has a continuation instead of a reversal. If the liquidity pivot was at the same bar as a BOS/CHoCH/CHoCH+ it will not be a liquidity grab but a structural break instead.
They can look like this:
Indicator example;
Turtle soups
If only one candle is beyond the pivot it could be a liquidity grab. It's a grab if price didn't close beyond the liquidity pivot, if so it's invaliditet. Turtle soups are basically false breakouts that takes liquidity (is a false breakout from a pivot with the lengths and timeframe from the settings).
The turtle soup can have a confirmation in the terms of a change of character (CHoCH). You can enable this in the settings section for 'Turtle soups' through the 'Confirmation' checkbox (enabled by default). The turtle soup strategy usually comes with some sort of confirmation, in this case a CHoCH, but it can also be a market structure shift (MSS) or a change in state of delivery (CISD).
The addition of turtle soups is possible through my script 'Turtle soup' ().
The drawing will be a dotted line between the liquidity pivot and the last bar of the false breakout and a box from the start of the false breakout to the end of it.
Indicator example:
Equal highs/lows
Equal highs/lows will always show liquidity, but might also show inducement. Inducement will be shown on equal lows if the trend is bullish and on equal highs if it's bearish, like this:
Or
Equal highs can only be created if the second pivot is lower than the first one. Equal lows can only be created if the second pivot is higher than the first one. If that is not the case it could be a liquidity grab.
When equal highs or equal lows are find that produces inducement (equal lows in a bullish trend and equal highs in a bearish trend), the indicator will first display inducement and will show liquidity once traders are induced to enter the security. Stop loss placement, for liquidity, is 0.1 * the average true range (ATR, of length 14). They will look like this:
Only inducement:
Inducement and liquidity:
Indicator example:
Equal highs/lows inducements can not be triggered after a BOS/CHoCH/CHoCH+. They are cleared upon a structural break.
BSL & SSL
Buyside liquidity (BSL) and sellside liquidity (SSL) will be shown. A pivot that's been mitigated (touched by price) can never be BSL or SSL. The BSL/SSL available will be dynamic while price moves (work in Replay and lower timeframes that moves fast) and pick the latest pivot/s (with left and right lengths from the 'Market structure' section). You can define how many BSL/SSL you want to see with a default value of 1, meaning only 1 BSL and 1 SSL can be shown. If there is no unmitigated high (BSL) or low (SSL), no BSL/SSL will be available to show. If there are BSL/SSL available they're very useful to use as targets for entering a trade.
The will look like this when available;
And without BSL available:
Or
And without SSL available:
Note that the examples without BSL/SSL available could have liquidity available from previous price legs.
This can be an example of a BSL/SSL sequence:
First both buyside and sellside liquidity is available:
Then a new low appears and new sellside liquidity is available:
Then buyside liquidity is mitigated, so only sellside liquidity is available:
A new high pivot appears and buyside liquidity is available again:
Lastly a bearish CHoCH happens and sellside liquidity is mitigated, only buyside liquidity is available:
Retracement
The first retracement after a BOS/CHoCH/CHoCH+ is considered an inducement with the mission to get traders into a trade prematurely to get stopped out. This level is shown and look like this:
Or
A retracement inducement is removed when a new BOS/CHoCH/CHoCH+ appears and it's not triggered.
---------------------------
As of now there aren't any alerts available. You cannot use the Pine Screener from Tradingview either to see new liquidity/inducement events. I have this planned for future updates though.
I hope that this long description makes sense, let me know otherwise! Also let me know if you experience any bugs or have a feature request or just want to share good settings to use.
Best of trading luck!


Ross Cameron 5 Pillars FilterFirst, I am not Ross Cameron. This indicator is based on his five pillars of stock selection.
ROSS CAMERON 5 PILLARS MOMENTUM FILTER
🎯 OVERVIEW
This indicator automatically checks if the current symbol meets Ross Cameron's famous "5 Pillars" stock selection criteria from Warrior Trading - a proven methodology for identifying high-probability momentum day trading setups.
📊 ROSS CAMERON'S 5 PILLARS
1️⃣ RELATIVE VOLUME ≥5x (Automated ✅)
• Compares current volume to 30-day average
• Minimum 5x confirms institutional/retail interest
• High RVol = high liquidity and momentum potential
2️⃣ DAILY % CHANGE ≥10% (Automated ✅)
• Stock must already be showing momentum
• Default threshold: 10% up from previous close
• Confirms demand is already present
3️⃣ NEWS CATALYST (Manual Check ⚠️)
• Breaking news justifies the price movement
• Look for: earnings, FDA approvals, partnerships, contracts
• 🔥 icon flags stocks with ≥15% momentum (likely news-driven)
4️⃣ PRICE RANGE $1-$20 (Automated ✅)
• Sweet spot for retail trader momentum
• Highly volatile small-cap stocks
• Accessible price range for position building
5️⃣ FLOAT <10 MILLION SHARES (Automated ✅)
• Low float creates supply/demand imbalances
• Enables explosive 50-100%+ intraday moves
• Automatically checked when data available
• Shows actual float with ✅/❌ indicator
🚀 KEY FEATURES
✅ GREEN BACKGROUND HIGHLIGHT
• Visual alert when ALL automated criteria are met
• Instantly identify potential setups while scanning watchlist
📋 DETAILED BREAKDOWN TABLE
• Shows pass/fail status for each pillar
• Displays actual values (RVol, %, Float, etc.)
• Color-coded for quick interpretation
🔥 STRONG MOMENTUM INDICATOR
• Highlights stocks ≥15% (likely have news catalyst)
• Helps prioritize which stocks to research first
🔔 BUILT-IN ALERTS
• "Ross Cameron Criteria Met" - All automated criteria pass
• "Strong Momentum Alert" - Stock showing explosive movement
⚙️ FULLY CUSTOMIZABLE
• Adjust all thresholds to your trading style
• Configurable table position and display
• Toggle volume spike filter on/off
💡 HOW TO USE
BEST WORKFLOW:
1. Build a watchlist of small-cap stocks using TradingView's Stock Screener
2. Add this indicator to your charts
3. Flip through your watchlist - look for GREEN BACKGROUNDS
4. Check the table for detailed breakdown of each pillar
5. VERIFY NEWS CATALYST (required for Pillar 3)
6. If float shows N/A, verify manually on Finviz
7. Execute your trading plan with proper risk management
OPTIMAL TIMING:
• Pre-Market (8:00-9:30 AM ET) - Identify gap-up candidates
• Morning Session (9:30 AM-12:00 PM ET) - Prime momentum window
• Avoid lunch hour (12:00-2:00 PM ET) - Low volume, choppy
ALERT SETUP:
1. Click "Create Alert" on your chart
2. Select "Ross Cameron Criteria Met" condition
3. Get notified when new setups appear real-time
⚙️ CUSTOMIZABLE SETTINGS
PILLAR 1 - RELATIVE VOLUME:
• Min RVol: 5.0x (Ross's minimum, increase for more selective)
• RVol Period: 30 days (industry standard)
PILLAR 2 - MOMENTUM:
• Min Daily %: 10% (increase to 15% for stronger setups)
PILLAR 3 - CATALYST:
• Strong Momentum %: 15% (threshold for 🔥 indicator)
PILLAR 4 - PRICE RANGE:
• Min Price: $1.00 (adjust based on account size)
• Max Price: $20.00 (Ross's sweet spot)
PILLAR 5 - FLOAT:
• Max Float: 10M shares (ultra-aggressive traders use 5M)
ADDITIONAL FILTERS:
• Volume Spike: 2x (Warrior Trading standard)
• Confirms intraday momentum continuation
📈 INTERPRETATION GUIDE
✅ GREEN BACKGROUND = GO!
• All automated criteria are met
• Check news catalyst before trading
• Verify setup on chart (not overextended)
• Follow your risk management plan
❌ NO GREEN BACKGROUND = WAIT
• At least one criterion failed
• Check table to see which pillar(s) failed
• May become valid later if momentum increases
🔥 FLAME ICON = HIGH PRIORITY
• Stock showing very strong momentum (≥15%)
• Likely has significant news catalyst
• Research news IMMEDIATELY
• Often the best setups of the day
⚠️ N/A FOR FLOAT = MANUAL CHECK
• TradingView doesn't have float data for this symbol
• Verify on Finviz.com or similar
• If float >10M, setup is invalid per Ross's criteria
📚 RECOMMENDED STRATEGIES
GAP AND GO:
• Stock gaps up 10%+ on news
• Enters above gap high with volume
• Targets: 20-50% gains
VWAP BOUNCE:
• Pullback to VWAP support
• Enters on bounce with volume confirmation
• Tight stop below VWAP
HIGH OF DAY BREAKOUT:
• New HOD with volume surge
• Momentum continuation play
• Trail stop as it runs
ABCD PATTERN:
• Classic reversal pattern
• Enters on D-point breakout
• Target: A-B distance from C
⚠️ RISK WARNINGS
• DAY TRADING IS HIGHLY RISKY - Most day traders lose money
• This indicator finds setups - YOUR EXECUTION determines success
• Always use proper risk management (1-2% risk per trade)
• Never trade without stop losses
• Paper trade extensively before using real money
• Past performance does not guarantee future results
🔧 TECHNICAL DETAILS
• Pine Script v6
• Works on any timeframe (calculates daily metrics automatically)
• Compatible with TradingView Free, Pro, Premium
• No repainting - all calculations based on confirmed data
• Efficient code - minimal lag
📊 DATA SOURCES
• Relative Volume: Calculated from 30-day volume average
• Daily %: Previous day's close vs current price
• Float: TradingView's shares_outstanding_float data
• Volume Spike: 20-period volume moving average
🎯 WHO THIS IS FOR
IDEAL FOR:
✅ Day traders focused on momentum strategies
✅ Traders who follow Ross Cameron/Warrior Trading methodology
✅ Small-cap stock traders ($1-$20 range)
✅ Scalpers and swing traders seeking high-volatility setups
NOT IDEAL FOR:
❌ Long-term investors
❌ Large-cap stock traders
❌ Options-only traders
❌ Traders who don't monitor news catalysts
💬 USAGE TIPS
1. COMBINE WITH OTHER TOOLS
• Use alongside your charting/technical analysis
• Verify pattern setups (bull flags, ABCD, etc.)
• Check Level 2 / Time & Sales for confirmation
2. MAINTAIN A WATCHLIST
• Update daily with fresh small-cap movers
• Use Finviz Gap Scanner as starting point
• Focus on sectors with momentum
3. RISK MANAGEMENT IS KEY
• Never risk more than 1-2% per trade
• Use 2:1 minimum profit/loss ratio
• Cut losses quickly, let winners run
• Position size based on volatility (ATR)
4. TRACK YOUR RESULTS
• Keep a trading journal
• Note which setups work best for you
• Refine criteria based on your data
• Continuous improvement mindset
📝 DISCLAIMER
This indicator is for EDUCATIONAL PURPOSES ONLY. It is not investment advice, a recommendation to buy/sell securities, or a guarantee of profits. Trading involves substantial risk of loss. Always:
• Conduct your own research and due diligence
• Consult with a licensed financial advisor
• Never risk money you cannot afford to lose
• Understand that most day traders lose money
• Practice in a simulator before trading real money
The creator of this indicator is not affiliated with Ross Cameron or Warrior Trading. This is an independent implementation of publicly available trading methodology.
📈 SUPPORT & FEEDBACK
If you find this indicator helpful, please:
• Give it a thumbs up 👍
• Leave a comment with your experience
• Share with other momentum traders
• Follow for updates and new indicators
For questions or suggestions, leave a comment below!
---
🏆 HAPPY TRADING! Remember: The indicator finds opportunities, but YOUR discipline, risk management, and execution determine your success.
#DayTrading #Momentum #RossCameron #WarriorTrading #SmallCaps #GapAndGo #Scalping #StockScreener

LE ScannerGENERAL OVERVIEW:
The LE Scanner is a multi-ticker dashboard that scans up to 20 tickers in real time and displays their current trend, price, volume, and key level conditions directly on your chart. It tracks how each ticker interacts with both the Previous Day’s High/Low (PDH/PDL) and Pre-Market High/Low (PMH/PML) to determine whether price is breaking above, below, or remaining inside those levels. The indicator automatically classifies each ticker as Bullish, Bearish, or Neutral based on these break conditions.
This indicator was developed by Flux Charts in collaboration with Ellis Dillinger (Ellydtrades).
What is the purpose of the indicator?:
The LE Scanner helps traders keep track of up to 20 tickers at once without switching between charts. It puts all the key information in one place, including price, daily percentage change, volume, and how each ticker is reacting around the previous day’s and pre-market highs and lows. The layout is simple and easy to read, with progress bars that show where price is relative to those levels. The goal is to save time and make it easier to understand market strength and weakness across your watchlist.
What’s the theory behind the indicator?:
The LE Scanner is built around the idea that key levels define bias. The previous day’s high and low show where the market traded most actively during the prior session, and the pre-market range reveals how price behaved before the open. When a ticker breaks both the previous day’s high and the pre-market high, it shows that buyers are in control. When it breaks both the previous day’s low and the pre-market low, sellers are in control. If neither side has full control, the bias is seen as neutral.
LE SCANNER FEATURES:
Multi-Ticker Dashboard
Key Level Tracking
Trend Classification
Sorting
Customization
Multi-Ticker Dashboard:
The LE Scanner can monitor up to 20 tickers at the same time. Each ticker has its own row in the dashboard showing:
Ticker Name
Current Price
Volume
Daily % Change
PDH Break
PDL Break
PMH Break
PML Break
Trend (bullish, bearish, or neutral)
You can enable or disable each ticker individually, so if you only want to track 5 or 10 tickers, you can simply toggle the rest off. Each ticker input lets you type in any valid ticker that’s available on TradingView.
Ticker Name:
Shows the ticker you selected in your input settings
Current Price:
Displays the latest price of that ticker based on your chart’s selected timeframe.
Volume:
Tracks the total trading volume for the current session.
Daily % Change:
Measures how much price has moved since the previous session’s close.
The remaining elements of the dashboard are explained in full detail throughout the remaining sections of this write-up.
Key Level Tracking:
The core of the LE Scanner is its ability to track and visualize how price interacts with four key levels for every ticker:
Previous Day High (PDH)
Previous Day Low (PDL)
Pre-Market High (PMH)
Pre-Market Low (PML)
These levels are updated automatically and compared to the current market price for each ticker inputted into the indicator. They show you whether the market is staying inside yesterday’s range or expanding beyond it.
🔹Previous Day High (PDH) & Previous Day Low (PDL)
The Previous Day High (PDH) marks where price reached its highest point during the last full trading session, while the Previous Day Low (PDL) marks the lowest point. Together, they define the previous day’s range and help traders understand where price is trading relative to that prior structure.
When the current price of a user-selected ticker moves above the PDH, it signals that buyers are taking control and that the ticker is now trading above yesterday’s range. In the dashboard, this change triggers a 🟢 icon under the “PDH Break” column. Once the PDH Break is confirmed, the opposite PDL Break column for that same ticker becomes blank.
When the current price of the user-selected ticker moves below the PDL, it shows that sellers are taking control and that the ticker is trading below yesterday’s range. In the dashboard, this change triggers a 🔴 icon under the “PDL Break” column. Once the PDL Break is confirmed, the opposite PDH Break column for that same ticker becomes blank.
🔹 Pre-Market High (PMH) & Pre-Market Low (PML)
The Pre-Market High (PMH) and Pre-Market Low (PML) show where price reached its highest and lowest points before the main trading session begins. On most U.S. exchanges, the pre-market session is from 4:00 AM to 9:29 AM Eastern Standard Time (EST), just before the New York session opens at 9:30 AM EST. These levels are important because they reflect how traders positioned themselves during the early morning hours. Many traders use the pre-market session to react to overnight news. The PMH and PML outline that entire pre-market range, showing where buyers and sellers fought for control and where the early balance between the two sides was established before the market opens.
When the current price of a ticker moves above the Pre-Market High, it means buyers are in control and that price has pushed through the top of the pre-market range. In the dashboard, this triggers a 🟢 icon under the “PMH Break” column. Once this break is confirmed, the opposite PML Break column for that ticker becomes blank.
When the current price moves below the Pre-Market Low, it means sellers are in control and that price has fallen beneath the pre-market range. In the dashboard, this triggers a 🔴 icon under the “PML Break” column. Once a PML Break is confirmed, the opposite PMH Break column for that ticker becomes blank.
🔹Progress Bars
The LE Scanner indicator includes progress bars that show how far the current price is from key levels.
When price is between the Previous Day High (PDH) and Previous Day Low (PDL), the progress bar measures price’s distance relative to those two points.
When price is between the Pre-Market High (PMH) and Pre-Market Low (PML), the bar tracks how far price is from those pre-market boundaries.
The closer price gets to either side, the more the bar fills, giving you a quick visual sense of how close a breakout or breakdown might be. A bar that’s nearly full means price is approaching one of the levels, while a shorter bar means it’s still far away from it. By seeing this relationship directly in the dashboard, you can see which tickers are getting ready to test key levels without flipping through multiple charts.
🔹PDH Progress Bar
The PDH progress bar measures how close price is to breaking above the previous day’s high.
When the bar is nearly full, it means the current price is trading just below yesterday’s high.
When the bar is low or mostly empty, it means price is far from the PDH and trading near the middle or lower end of the previous day’s range.
Once price breaks above the PDH, the progress bar is replaced with a green confirmation icon in the PDH Break column.
🔹Previous Day Low (PDL) Progress Bar
The PDL progress bar measures how close price is to breaking below the previous day’s low.
When the bar is nearly full, it means the current price is trading just above yesterday’s low.
When the bar is low or mostly empty, it means price is far from the PDL and trading near the middle or upper end of the previous day’s range.
Once price breaks below the PDL, the progress bar is replaced with a red confirmation icon in the PDL Break column.
🔹Pre-Market High (PMH) Progress Bar
The PMH progress bar shows how close price is to breaking above the pre-market high.
When the bar is nearly full, it means the current price is trading just below the pre-market high.
When the bar is low or mostly empty, it means price is far from the PMH and trading near the middle or lower end of the pre-market range.
Once price breaks above the PMH, the progress bar is replaced with a green confirmation icon in the PMH Break column.
🔹Pre-Market Low (PML) Progress Bar
The PML progress bar shows how close price is to breaking below the pre-market low.
When the bar is nearly full, it means the current price is trading just above the pre-market low.
When the bar is low or mostly empty, it means price is far from the PML and trading near the middle or upper end of the pre-market range.
Once price breaks below the PML, the progress bar is replaced with a red confirmation icon in the PML Break column.
Trend Classification:
The LE Scanner automatically classifies each user-inputted ticker as bullish, bearish, or neutral based on how price is interacting with its key levels.
Each trend type follows a specific set of conditions and is displayed in its own column under Trend on the dashboard.
🔹 Bullish Trend
A bullish trend occurs when price has broken above both the Previous Day High (PDH) and the Pre-Market High (PMH). This shows that buyers are in full control and that the ticker is trading firmly above the prior session’s and pre-market range.
When this condition is met, the Trend column displays a green background with an upward-facing triangle icon (▲).
🔹 Bearish Trend
A bearish trend occurs when price has broken below both the Previous Day Low (PDL) and the Pre-Market Low (PML). This indicates that sellers are in control and that the ticker is trading firmly below the prior session’s and pre-market range.
When this happens, the Trend column switches to a red background with a downward-facing triangle icon (▼).
🔹 Neutral Trend
A neutral trend occurs when price is trading inside the range, meaning it hasn’t broken above the PDH/PMH or below the PDL/PML. This indicates that neither bulls nor bears has clear control, and the ticker is consolidating between the prior session’s and pre-market range.
When this condition is active, the Trend column appears with a warning sign icon (⚠️). This helps distinguish tickers that are still forming setups from those that have already shown decisive strength or weakness.
Sorting:
The LE Scanner includes a built-in sorting feature that lets you reorder the dashboard in either descending or ascending order based on one of four metrics:
% Change
Volume
Price
Trend
Sorting is handled directly in the indicator settings, where you can toggle “Sort By” and then select your preferred Sort By criteria and Order (Ascending or Descending). When enabled, the dashboard automatically repositions every ticker to match the selected sorting method.
🔹 % Change Sorting
When you sort by % Change, the dashboard ranks tickers based on their daily percentage movement relative to the previous session’s close.
If you choose descending order, the biggest gainers appear at the top.
If you choose ascending order, the biggest decliners appear at the top.
🔹 Volume Sorting
When you sort by Volume, the dashboard arranges tickers based on their total traded volume for the current session.
If you choose descending order, the highest-volume tickers appear at the top.
If you choose ascending order, the lowest-volume tickers appear at the top.
🔹 Price Sorting
When you sort by Price, the dashboard arranges tickers by their current market price.
If you choose descending order, the highest-priced tickers appear at the top.
If you choose ascending order, the lowest-priced tickers appear at the top.
🔹 Trend Sorting
When you sort by Trend, the dashboard organizes tickers based on their directional classification.
If you choose descending order, bullish tickers appear first, followed by neutral and bearish.
If you choose ascending order, bearish tickers appear first, followed by neutral and bullish.
Customization:
The LE Scanner includes several settings that let you customize how the dashboard appears on your chart. All visual and positional elements can be adjusted to fit your personal layout preferences.
🔹 Dashboard Position
You can move the dashboard anywhere on your chart using the “Table Position” setting. Options include:
Bottom-Center
Bottom-Left
Bottom-Right
Middle-Center
Middle-Left
Middle-Right
Top-Center
Top-Left
Top-Right
🔹 Dashboard Size
The dashboard size can be adjusted to be larger or smaller. Users can choose between the following options:
Tiny
Small
Normal
Large
Huge
🔹 Color Customization
All color elements in the dashboard are customizable. You can change the following:
Background Color
Border Color
Frame Color
Text Color
Bullish Trend Color
Bearish Trend Color
Important Notes:
Because the LE Scanner tracks multiple tickers and updates all data in real time, it performs several background calculations at once. On rare occasions, this can cause the following issue:
Computation Error:
Scanning up to 20 tickers at the same time requires multiple request.security() calls. This process is resource-intensive and can sometimes trigger a calculation timeout message in TradingView. If this occurs, simply force the indicator to refresh by changing one of its settings (for example, toggling a ticker off and back on) or by removing and re-adding the indicator to your chart.
Uniqueness:
The LE Scanner is unique because it combines real-time multi-ticker tracking, sortable data, and visual feedback into one tool. It can track up to 20 tickers simultaneously, automatically sort them by % change, volume, price, or trend. The built-in progress bars provide a clear visual of how close price is to breaking key levels, while the trend classification instantly shows whether each ticker is bullish, bearish, or neutral.
