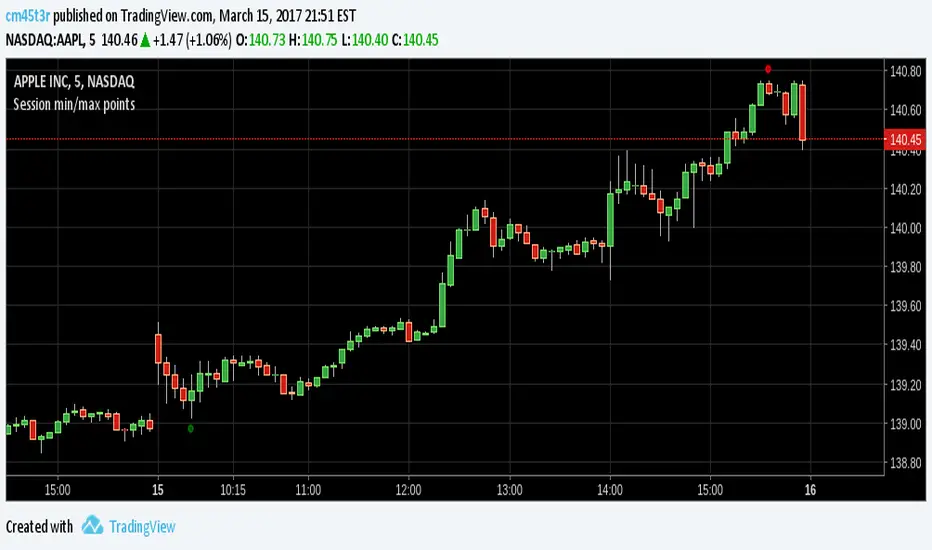
Session min/max pointsMinimum and maximum points in a day trading session. It may help you spot the range which min and max occur in a session.
In day trading, for example, at securities like GBPNZD, minimum happens between 02:00-05:00 ET and maximum between 08:00-14:00 ET. This indicator can help you test this hypothesis.
Happy trading!
在腳本中搜尋"session"
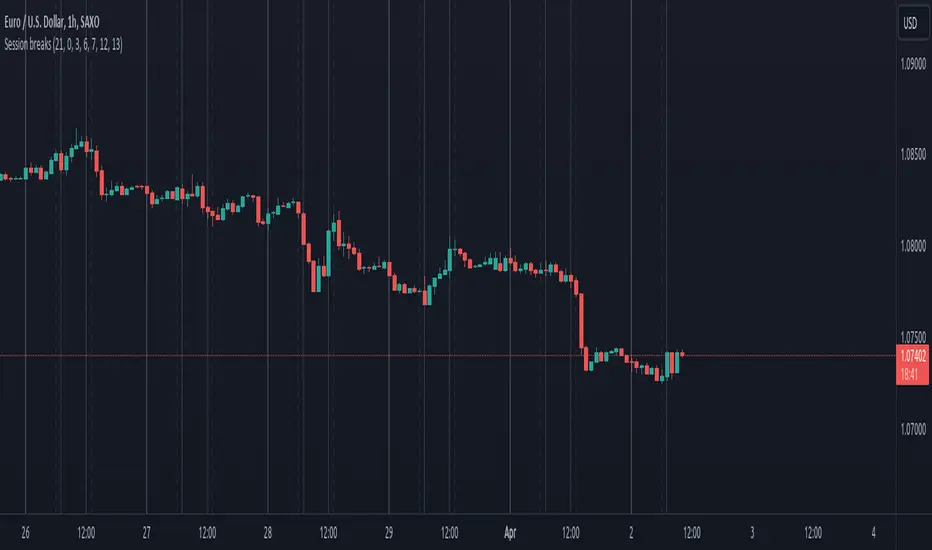
Session breaksThis indicator marks the start of each trading session around the world, starting with Tokyo at 0am UTC, London at 7am UTC, NY at 12pm and Sydney at 9pm, is non-intrusive (light gray vertical lines) and works with both UTC and exchanges' local time and handles DST / timezone offsets as well.
You can easily see that sometimes it acts as pivot-point especially on high volume.
And last, it is supposed to replace the "Session breaks" option that you can find in "Settings - Appearance" that only displays the end of session for the current exchange.
Session Swing High / Low Rays AUS USERS ONLY
marks the last week concurrent to the present day, the highs and lows of each session

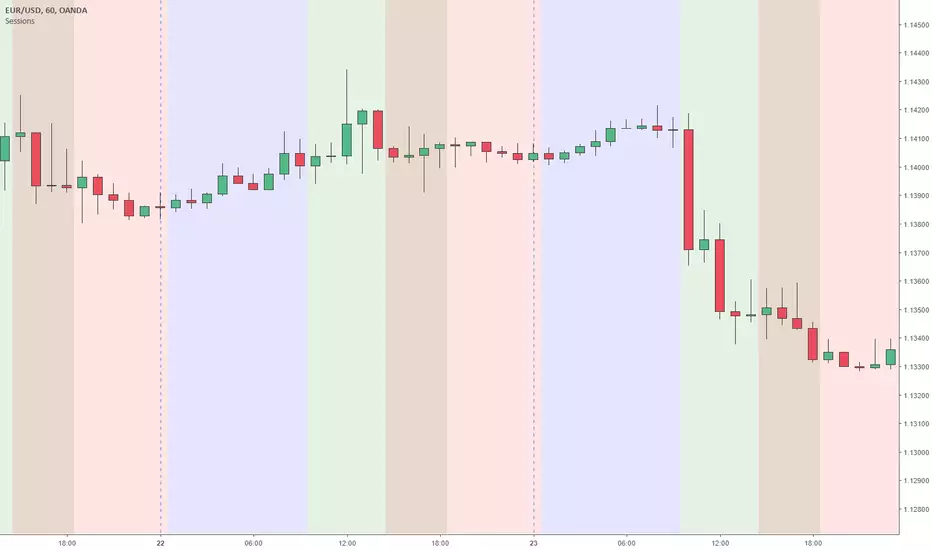
Sessions Asia, London, NY colored USED FOR GMT+2Simple script making easy to see when what session begins also overlaps and ends.
This script used for GMT+2 time zone, if you want to edit it just overite script time cycle.
Sessions (Nephew_Sam_)Indicator combines the 3;
1. 3 Sessions - with an option to set your own times
2. 4 Killzones- with an option to set your own times
3. Daily Dividers
If you dont want any of the the above or want to decrease your killzones, just uncheck the relevant checkbox under settings - inputs/colors.
Note: Most of this code it taken from other open source scripts, therefore I will leave this as an open source code too.

Session, Weekly, Daily LevelsScroll down for hungarian description!
Magyar leíráshoz görgess lejjebb!
Overview
This script provides a unified market structure mapping tool that automatically identifies and visualizes key intraday, daily, and weekly reference levels. It helps traders contextualize price action throughout the trading week by marking true session opens, previous day highs/lows, weekly highs/lows, and weekday opens, all with accurate historical anchoring and correct timezone handling.
What This Script Does
1. Intraday Session Opens (Tokyo, London, New York)
- Detects the exact candle where each session opens.
- Draws horizontal rays with labels.
- Automatically clears lines at the start of each new day.
- Uses a custom local-to-exchange timezone conversion system.
2. Weekly Levels
- Last week high and low (precise bar anchoring, not HTF aggregation)
- Current week open (also Monday open)
- Auto-reset on new week
- Levels are always drawn from the true candle where they formed.
3. Previous Day High & Low
- Continuously tracks intraday highs and lows.
- On a new day, stores yesterday’s values and anchors rays to the exact bars.
- Levels remain visible for the full current day and reset the next day.
4. Weekday Opens (Tue–Fri)
- Captures the exact opening price of Tuesday–Friday.
- Monday open = Week open, so it is not shown separately.
- Auto-reset on new week.
Timezone Logic (Original Feature)
The script converts:
local session times → exchange timezone → chart timestamps
It works correctly regardless of chart timezone or instrument exchange location.
Line Drawing Logic
- Finds the exact bar_index where each level forms.
- Draws rays extending to the right.
- Labels are placed ahead of price.
- Safe updating prevents “bar index too far” errors.
How to Use
- Identify daily/weekly structure.
- Track bias relative to session opens.
- Observe reactions around weekday opens.
- Compare price action to last week's range.
Originality
- Custom timezone conversion engine.
- True historical bar anchoring.
- Fully automated weekly/daily structural resets.
- Independent styling for each level type.
- Not a mashup; all components follow one unified logic.
Limitations
- Does not predict trend or direction.
- Structural tool only.
Summary
A precise and reliable market structure tool that unifies weekly, daily, and intraday reference levels with full timezone automation and true-candle anchoring.
MAGYAR LEÍRÁS
--------------
Áttekintés
Ez az indikátor egy összetett piaci szerkezet-feltérképező eszköz, amely automatikusan megjeleníti a legfontosabb intraday, napi és heti referenciaértékeket. A célja, hogy a kereskedő tisztán lássa a piac aktuális környezetét: hol nyíltak a főbb devizapiaci szekciók, hogyan alakult a tegnapi tartomány, hol volt a múlt heti csúcs/mélypont, és hogyan nyitottak az egyes hétköznapok.
Mit tud a script?
1. Szekciónyitások (Tokyo, London, New York)
- Megkeresi a pontos gyertyát, amely a szekciónyitáskori árat tartalmazza.
- Vízszintes vonalat és címkét rajzol.
- Minden nap elején automatikusan törli a korábbi nap szintjeit.
- Egyedi időzóna-konverziós rendszerrel működik (helyi idő → tőzsdei idő → chart idő).
2. Heti szintek
- Múlt heti maximum és minimum (pontos gyertyapontra horgonyozva)
- Aktuális heti nyitóár (egyben a hétfői nyitó is)
- Új hét kezdetekor automatikusan frissül.
- A múlt heti high/low nem fix időpontra, hanem a valódi gyertyára kerül.
3. Előző napi High és Low
- Folyamatosan követi a napi maximumot és minimumot.
- Napváltáskor elmenti és pontos gyertyáról indítja a ray-t.
- A szintek a teljes nap folyamán megmaradnak, majd a következő nap törlődnek.
4. Hétköznapok nyitóárai (Kedd–Péntek)
- A kedd, szerda, csütörtök és péntek nyitóárát rögzíti és megjeleníti.
- A hétfői nyitó a Week Open, ezért külön nem jelenik meg.
- Heti váltáskor automatikusan törlődnek.
Időzóna-kezelés (egyedi megoldás)
A script a felhasználó helyi idejét átszámítja az instrumentum tőzsdei időzónájára, majd a chartra vetíti.
Ez biztosítja, hogy minden szekciónyitás helyesen jelenik meg, bármely chart vagy instrumentum esetén.
Vonalrajzolási logika
- A szintek a valódi bar_index alapján kerülnek rögzítésre.
- Jobbra nyúló ray-eket rajzol.
- A címkék mindig a jobb oldalon, előre helyezve jelennek meg.
- Biztonságos frissítési rendszer akadályozza meg a hibákat (pl. “bar index too far”).
Használat
- Napi/heti szerkezet meghatározása.
- Bias követése a session openekhez viszonyítva.
- Reakciók figyelése a hétköznapok nyitóárai körül.
- Összevetés a múlt heti tartománnyal.
Eredetiség
- Egyedi időzóna-kezelő motor.
- Igazi gyertyapont-alapú horgonyzás.
- Automatikus napi/heti reset.
- Minden szint külön stílusban konfigurálható.
- Nem mashup; egységes rendszer.
Összegzés
Professzionális, pontos eszköz a piaci szerkezet feltérképezésére, amely egyesíti a heti, napi és intraday szinteket, teljes időzóna-automatizálással és gyertyapontra horgonyzott kijelölésekkel.

Session Range and Breakout Summary
This script presents the session range and post session movements relative to that range of all the majors and crosses on a single page. You can also set it to a daily range and weekly range (beta). It will even show you the pip value of the range. I made the indicator to easily stay on top of market movements at london open relative to the Asia session range. Its very easy to see which entire currency group is breaking its asia range WHIST ITS HAPPENING. Focus on NZD in the examples as it was the market lead today - I was able to get some of it when I saw the entire group breaking its range
Showing all the majors and crosses relative to the Asia range (00:00 - 07:00 GMT)
Active 'show on chart' to verify the indicator is measuring the range correctly. Compare below to the NZD box above - you can see how NZD had control of the market this morning and all NZD pairs broke out of their ranges.
'PIP MODE' - active pip mode to see what the pip range was of the session
Notes
The information is presented RELATIVELY - this means that all the ranges and movements are scaled to be the same size. You are therefore seeing the movements relative to their ranges. When you see a breakout it relative to the size of the range - for example, if GBPJPY had a range of 50pips and breaks out of the range by 100 pip and GBPEUR has a range of 20 pips and breaks out by 40 pips they have both broken out double the range and will be displayed as the same distance.
The indicator will show the movements whilst the range is forming. I did this so I can see what the groups are doing before Europe open and be ready - such as lingering at the top end of its INCOMPLETE asia range. Be aware through that if the lines are flat at the top of the range WHILST THE RANGE IS STILL FORMING this does not mean price was flat, it means that price was pushing up and growing the range. (Price can't breakout until the range has formed at the end of the session)
The currency pairs are organised to show the strength or weakness of the selected group - this means that the base currency is always the select group. This is to present the data with currencies moving in the same direction rather than some reversed but meaning the same in relation to currency strength. In the NZD example:
NZDAUD (not AUDNZD )
NZDCAD
NZDCHF
NZDEUR (not EURNZD )
NZDGBP (not GBPNZD )
NZDJPY
NZDUSD
I hope its useful. This is the most powerful indicator I've managed to write yet. It was difficult to make the code efficient enough to fit into the pinescript limit and still do everything.

session min/max support&resistance [LM]Hello traders,
I would like to present you session min/max support&resistance indicator. The idea behind is to calculate min and max per session and render line at those levels and bars until the price reach the level. With this you can see levels where the price didn't reach with granular control over how many lines can be shown.
Indicator has following settings:
General control - where you can select session interval and show/hide labels
Line control - where you can adjust type of line, color of up/bottom level..
I hope you will enjoy it,
Lukas

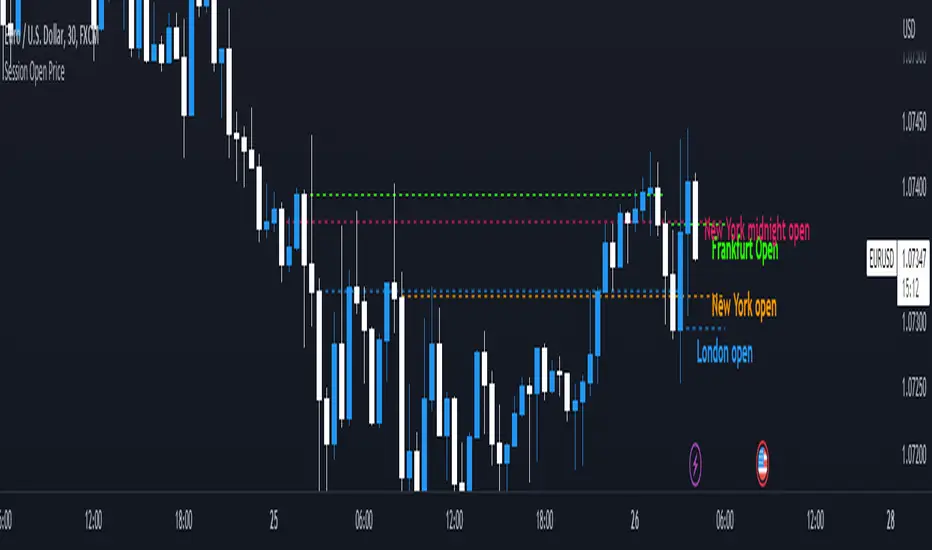
Session Open PriceThis Indicator displays the ICT kill zones' open price
You will be able to see the following open prices (ALL TIMES ARE IN NEW YORK TIME)
All times and appearances are customisable to your own liking.
The default time setting is recommended
- 00:00 AM Midnight New York Open Price (RED DASH LINE)
- 2:00 AM Frankfurt Open Price (GREEN DASH LINE)
- 3:00 AM London Open Price (BLUE DASH LINE)
- 8:30 AM New York Open Price (ORANGE DASH LINE)
HOW TO USE SESSION OPEN PRICE IN YOUR TRADING
If the price is above the opening price you only look for sells whereas if the price is under the opening price you only look for buys
BUY EXAMPLE
Wait for Midnight New York and Frankfurt open price to display
The price must be under both prices
Look for a Market maker buy model or your own entry model
Stoploss will be at the swing low and Take profit can be a fixed RR or how you calculate your take profit level
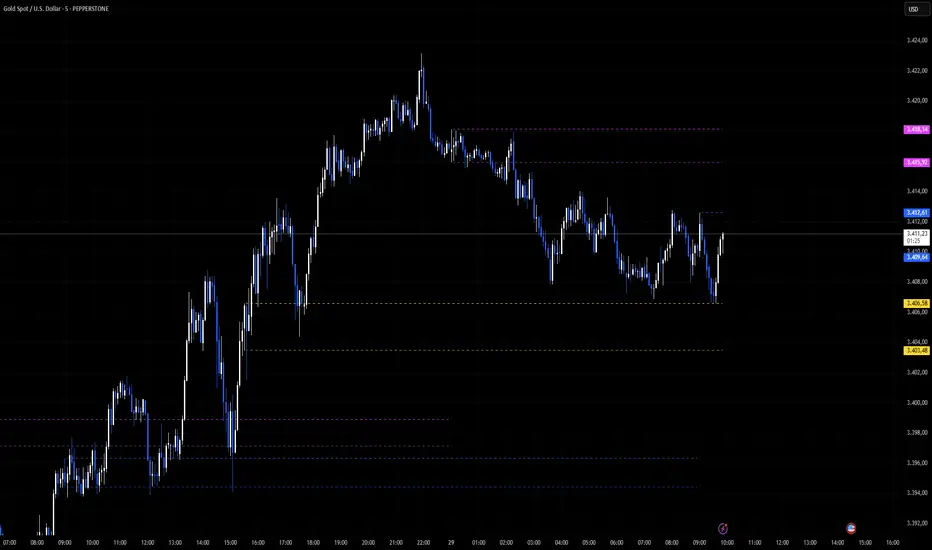
Session LevelsThis indicator plots important session (intraday) levels for the day. It plots high and low of previous day, week, month, 52 week and all time. Also plots the vix range which shows the daily expected trading range of the instrument. These levels acts as important support/resistance for the day.
For example, if price closes above previous day, week, or month high/low it indicates bullish sentiment and vice versa for bearish.
Vix Range plots top, center, bottom line for expected trading range for the day. It is calculated based on the volatility index selected (NSE:India VIX is used by default).


Chart Box Session Indicator [The Quant Science]This indicator allows highlighting specific time sessions within a chart by creating colored boxes to represent the price range of the selected session. Is an advanced and flexible tool for chart segmenting trading sessions. Thanks to its extensive customization options and advanced visualization features, it allows traders to gain a clear representation of key market areas based on chosen time intervals.
The indicator offers two range calculation modes:
Body to Body: considers the range between the opening and closing price.
Wick to Wick: considers the range between the session's low and high.
Body To Body
Wick to Wick
Key Features
1. Session Configuration
- Users can select the time range of the session of interest.
- Option to choose the day of the week for the calculation.
- Supports UTC timezone selection to correctly align data.
2. Customizable Visualization
- Option to display session price lines.
- Ability to show a central price line.
- Extension of session lines beyond the specified duration.
3. Design Display Configuration
- Three different background configurations to suit light and dark themes.
- Two gradient modes for session coloring:
- Centered: the color is evenly distributed.
- Off-Centered: the gradient is asymmetrical.
How It Works
The indicator determines whether the current time falls within the selected session, creating a colored box that highlights the corresponding price range. Depending on user preferences, the indicator draws horizontal lines at the minimum and maximum price levels and, optionally, a central line.
During the session:
- The lowest and highest session prices are dynamically updated.
- The range is divided into 10 bands to create a gradient effect.
- A colored box is generated to visually highlight the chosen session.
If the Extend Lines option is enabled, price lines continue even after the session ends, keeping the range visible for further analysis.
This indicator is useful for traders who want to analyze price behavior in specific timeframes. It is particularly beneficial for strategies based on market sessions (e.g., London or New York open) or for identifying accumulation and distribution zones.

ICT KillZones Hunt [TradingFinder] 4 Sessions + OB + FVG + Alert🔵 Introduction
🟣 ICT
The "ICT" style is a subset of "Price Action" technical analysis. The primary goal of the ICT trading strategy is to merge "Price Action" with the "Smart Money" concept to pinpoint optimal trade entry points.
However, this approach's strength extends beyond merely finding entry points. It also helps traders gain a deeper understanding of price behavior and adapt their trading strategies to the market structure.
The most important concepts of "ICT" :
Order Block
Fair Value Gap(FVG)
Liquidity
🟣 Session
Financial markets are divided into several time periods, each featuring distinct characteristics and levels of activity. These periods, known as sessions, are active at different times during the day.
The primary active sessions in financial markets include :
Asian Session
European Session
New York Session
Based on the UTC time zone, the schedule for these key sessions is :
Asian Session: 23:00 to 06:00
European Session: 07:00 to 16:30
New York Session: 13:00 to 22:00
Note
To avoid session overlap and minimize interference during kill zones, the session times have been modified as follows :
Asian Session: 23:00 to 06:00
European Session: 07:00 to 14:25
New York Session: 14:30 to 22:55
🟣 KillZone
Kill zones are periods within a session where trader activity spikes. During these times, trading volume surges, and price movements become more pronounced.
The major kill zones, according to the UTC time zone, are as follows :
Asian Kill Zone: 23:00 to 03:55
European Kill Zone: 07:00 to 09:55
New York Morning Kill Zone: 14:30 to 16:55
New York Evening Kill Zone: 19:30 to 20:55
🔵 How to Use
🟣 Order Block
Order blocks are a distinct category of "Supply and Demand" zones, formed when a series of orders are grouped together. These blocks are often created by banks or other significant market participants.
Banks typically execute large orders in blocks during their trading sessions. If they were to enter the market with small quantities, substantial price movements would occur before the orders were fully executed, reducing potential profit.
To mitigate this, they divide their orders into smaller, more manageable positions. Traders should seek "buy" opportunities in "demand order blocks" and "sell" opportunities in "supply order blocks."
🟣 Fair Value Gap (FVG)
To pinpoint the "Fair Value Gap" on the chart, meticulous candle-by-candle analysis is essential. Pay close attention to candles with significant bodies, examining each candle alongside the one preceding it.
The candles flanking this central candle should exhibit elongated shadows, with bodies that do not intersect the body of the central candle. The span between the shadows of the first and third candles is referred to as the FVG range.
Note :
The origin of all Order Blocks and FVGs starts from inside a kill zone and extends up to the end of the same session.
🟣 Kill Zone Hunt
Following this strategy, after the conclusion of the kill zone and the stabilization of its high and low lines, if the price touches either of these lines within the same session and encounters a robust rejection, it presents an opportunity to enter a trade.
🔵 Setting
🟣 Global Setting
Show All Order Block :
If it is turned off, only the last Order Block will be displayed.
Show All FVG :
If it is turned off, only the last FVG will be displayed.
Show More Info Session :
If it is turned on, more information about kill zones (Trade Volume, Time, Number of Candles) will be displayed.
🟣 Logic Parameter
Pivot Period of Order Blocks Detector :
Enter the desired pivot period to identify the Order Block.
Order Block Validity Period (Bar) :
You can specify the maximum time the Order Block remains valid based on the number of candles from the origin.
Mitigation Level Order Block :
Determining the basic level of a block order. When the price hits the basic level, the order block due to mitigation.
🟣 Order Blocks Display
Demand Order Block :
Show or not show and specify color.
Supply order Block :
Show or not show and specify color.
🟣 Order Block Refinement
Refine Demand OB :
Enable or disable the refinement feature. Mode selection.
Refine Supply OB :
Enable or disable the refinement feature. Mode selection.
🟣 FVG
FVG Validity Period (Bar) :
You can specify the maximum time the FVG remains valid based on the number of candles from the origin.
Mitigation Level FVG :
Determining the basic level of a FVG. When the price hits the basic level, the FVG due to mitigation.
Show Demand FVG :
Show or not show and specify color.
Show Supply FVG :
Show or not show and specify color.
FVG Filter :
Enable or disable filtering of FVGs. Select filter mode.
🟣 Session
Show More Info Session Color
Asia Session, London Sesseion, New York am Session & New York pm Session :
Show or not show session and kill zones. Change the display color.
🟣 Alert
Send Alert When Touched Session high & Low :
On / Off
Alert Demand OB Mitigation :
On / Off
Alert Supply OB Mitigation :
On / Off
Alert Demand FVG Mitigation :
On / Off
Alert Supply FVG Mitigation :
On / Off
Message Frequency :
This string parameter defines the announcement frequency. Choices include: "All" (activates the alert every time the function is called), "Once Per Bar" (activates the alert only on the first call within the bar), and "Once Per Bar Close" (the alert is activated only by a call at the last script execution of the real-time bar upon closing). The default setting is "Once per Bar".
Show Alert Time by Time Zone :
The date, hour, and minute you receive in alert messages can be based on any time zone you choose. For example, if you want New York time, you should enter "UTC-4". This input is set to the time zone "UTC" by default.
Display More Info :
Displays information about the price range of the order blocks (Zone Price) and the date, hour, and minute under "Display More Info". If you do not want this information to appear in the received message along with the alert, you should set it to "Off".

Quantura - Session High/LowIntroduction
“Quantura – Session High/Low” is a professional-grade session mapping indicator that automatically identifies and visualizes the highs, lows, and ranges of key global trading sessions — London, New York, and Asia. It helps traders understand when and where liquidity tends to accumulate, allowing for better market structure analysis and session-based strategy alignment.
Originality & Value
This indicator unifies the three most influential global sessions into a single, adaptive visualization tool. Unlike typical session indicators, it dynamically updates live session highs and lows in real time while marking session boundaries and transitions. Its multi-session management system allows for immediate recognition of overlapping liquidity zones — a crucial feature for institutional and intraday traders.
The value and originality come from:
Real-time tracking of session highs, lows, and developing ranges.
Simultaneous visualization of multiple global sessions.
Optional vertical range lines for clearer visual segmentation.
Customizable session times, colors, and time zone offset for global accuracy.
Automatically extending and updating lines as each session progresses.
Functionality & Core Logic
Detects the start and end of each trading session (London, New York, Asia) using built-in time logic and user-defined UTC offsets.
Initializes session-specific high and low variables at the start of each new session.
Continuously updates session high/low levels as new candles form.
Draws color-coded horizontal lines for each session’s high and low.
Optionally adds vertical dotted lines to visually connect session range extremes.
Locks each session’s range once it ends, preserving historical structure for review.
Parameters & Customization
New York Session: Enable/disable, customize time (default 15:30–21:30), and set color.
London Session: Enable/disable, customize time (default 09:00–16:30), and set color.
Asia Session: Enable/disable, customize time (default 02:30–08:00), and set color.
Vertical Line: Toggle dotted vertical lines connecting session high and low levels.
UTC Offset: Adjust session timing to align with your chart’s local time zone.
Visualization & Display
Each session is color-coded for quick identification (default: blue for London, red for New York, green for Asia).
Horizontal lines track evolving session highs and lows in real time.
Once a session closes, the lines remain fixed to mark historical range boundaries.
Vertical dotted lines (optional) visually connect the session’s high and low for clarity.
Supports full overlay display without interfering with other technical indicators.
Use Cases
Identify liquidity zones and range extremes formed during active trading sessions.
Observe session overlaps (London–New York) to anticipate volatility spikes.
Combine with volume or market structure tools for session-based confluence.
Track how price interacts with prior session highs/lows to detect potential reversals.
Analyze session-specific performance patterns for algorithmic or discretionary systems.
Limitations & Recommendations
The indicator is designed for intraday analysis and may not provide meaningful output on daily or higher timeframes.
Adjust session times and UTC offset based on your broker’s or exchange’s timezone.
Does not provide trading signals — it visualizes session structure only.
Combine with liquidity and volatility indicators for full contextual understanding.
Markets & Timeframes
Compatible with all asset classes — including crypto, forex, indices, and commodities — and optimized for intraday timeframes (1m–4h). Particularly useful for traders analyzing session overlaps and volatility transitions.
Author & Access
Developed 100% by Quantura. Published as a Open-source script indicator. Access is free.
Compliance Note
This description fully complies with TradingView’s Script Publishing Rules and House Rules . It provides a detailed explanation of functionality, parameters, and realistic use cases without making any performance or predictive claims.

Simple Sessions========== TLDR ==========
The "Simple Sessions" indicator plots vertical lines and labels at the open and close of the US (New York), Asia (Tokyo), and Europe (London), daily session. The existing session indicators I could find all changed the background color of the chart for the entire session or added extra information to the chart that cluttered up my view. This is meant to be a less noisy and easy to interpret indication that the session you trade has started or is ending.
========== Features ==========
- Show or hide vertical lines for session opens and closes
- Show or hide labels for session opens and closes
- Show or hide each session individually
- Show or hide just the session close indications
- Change the color used for each session open and close
- Change the labels text, size, and text color
========== Limitations ==========
The session start and end times are hard coded in for their time zones and can't be changed:
- US (New York) - 9:30 - 16:00
- Asia (Tokyo) - 9:00 - 15:00
- Europe (London) - 8:30 - 16:30
========== Use Cases ==========
- Easily see when each session started and ended without the chart being too noisy
- Make it easier to identify price action patterns and trade setups that may occur on the open of each session
=============================
If you'd like more features or options feel free to request them in the comments.
Forex Session Tracker [MacroGlide]Forex Session Tracker is a tool designed to track and visualize trading activity across the four key Forex market sessions: New York, London, Tokyo, and Sydney. The indicator helps traders see the time intervals of each session, their impact on price movements, and analyze volatility within these sessions.
Key Features:
• Session Visualization: The indicator highlights price ranges during the New York, London, Tokyo, and Sydney sessions using different colors, making data easier to visually interpret and analyze. Users can customize the color scheme for each session.
• Price Change Analysis: The indicator tracks the opening prices of each session and calculates the price changes by the session's close. This allows traders to assess market dynamics within each session and make informed trading decisions.
• Average Price Changes: The average price change for a specified number of sessions is calculated for each session, helping to identify trends and volatility levels.
• Time Zone Support: The indicator takes into account time zones, allowing users to adjust the display according to their location or use the market's time zone.
• Interactive Dashboard: The built-in dashboard shows the status of each session in real-time (active or inactive), recent price changes, and average changes, providing quick access to key information directly on the chart.
How to Use:
• Add the indicator to your chart and configure the displayed sessions according to your needs.
• Use color differentiation to easily identify active trading sessions and assess their impact on price movements.
• Monitor price changes in each session and analyze averages for a deeper understanding of market trends.
Methodology:
The indicator uses the time intervals of each trading session to calculate and display opening prices, price ranges, and price changes for the session. Based on this data, the Forex Session Tracker visualizes the session's high and low prices and calculates the average price change over the last several sessions. All data is displayed in real-time, considering the user's time zone settings or the market's time zone.
Originality and Usefulness:
Forex Session Tracker stands out for its ability to combine price change information from several key trading sessions into one indicator, providing traders with a simple and clear way to analyze market activity across different time zones.
Charts:
The indicator displays clean and clear charts, where each trading session is highlighted with its own color, making visual interpretation easier. The charts focus only on essential information for analysis: opening prices, session ranges, and price changes. The integrated dashboard provides quick access to key session metrics, such as activity status, recent price changes, and average values for the selected period. These features make the charts highly useful for rapid analysis and trading decision-making.
Enjoy the game!

Statistics: High & Low timings of custom session; 1yr historyGet statistics of the Session High and Session Low timings for any custom session; based on around 1yr of data.
//Purpose:
-To get data on the 'time of day' tendencies of an asset.
-Narrow in on a custom defined session and get statistics on that session.
//Notes:
-Input times are always in New York time (but changing the timezone after setting WILL adust both table stats and background highlight correctly.
-For particularly long sessions, make sure text size is set to 'tiny' (very long vertical table), or adjust table to display horizontally.
-You'll notice most assets show higher readings around NY equities open (9:30am NY time). Other assets will have 'hot-spots' at other times too.
-Timings represent the beginning of a 15m candle. i.e. reading for 15:45 represents a high occurring between 15:45 and 1600.
-Premium users should get 20k bars => around 1year's worth of data on a 15minute chart. Days of history is displayed in the top left corner of the table.
//Limitations
-only designed and working on 15minute timeframe (to gather a full year of meaningful/comparable % stats, need 15minute 'buckets' of time.
-sessions cannot cross through midnight, or start at midnight (00:15 is ok). 00:15 >> 23:45 is the max session length. On BTC, same applies but 01:00 instead of midnight (all in NY time).
-if your session crosses through 'dead time' (e.g. 17:00-18:00 S&P NY time); table will correctly omit these non-existent candles, but it will add on the missing hour before the start time.
//Cautionary note:
-Since markets are not uncommonly in a trending state when your defined session starts or ends, the high/low timings % readings for start and end of session may be misleadingly high. Try to look for unusually high readings that are not at the start/end of your session.
Wheat (ZW1!) 15min chart; Table displayed vertically:
Nasdaq (NQ1!) 15m chart; Table displayed horizontally and with smaller text to view a very long custom session:

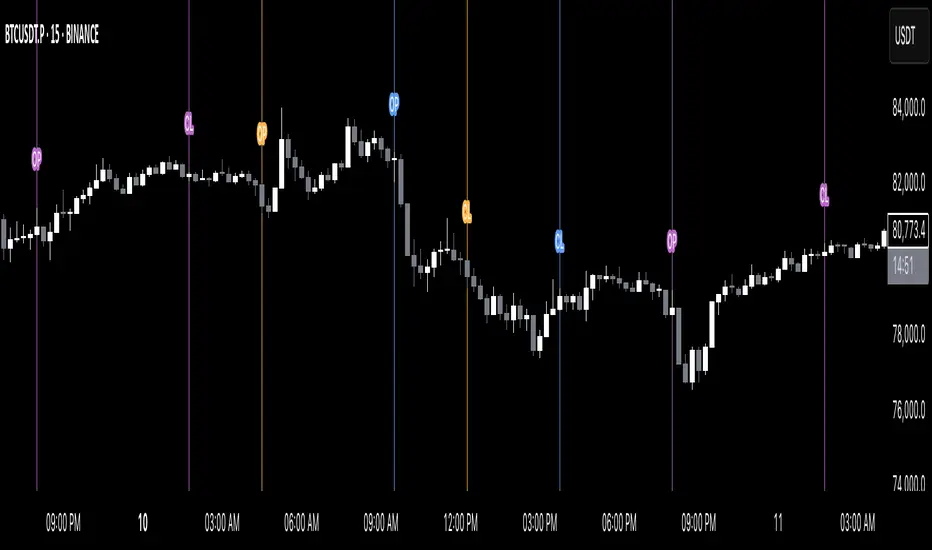
Sessions High/Low with Break LogicSessions High/Low with Break Logic – Indicator Description
Update 27.10.25
Overview
This indicator marks the highs and lows of key trading sessions (Tokyo, London, New York) and highlights when these levels are broken. It is ideal for traders using session-based strategies to monitor breakouts or support/resistance levels in real time.
Key Features
Session-Based Highs/Lows:
Tracks highs and lows for three trading sessions:
Tokyo: 02:00–09:00 (UTC+1)
London: 09:00–17:00 (UTC+1)
New York: 15:30–22:00 (UTC+1)
Break Logic:
Detects when the current price breaks a session high or low.
Labels are updated with a "Break" note when a level is breached.
Visual Display:
Draws horizontal lines for highs and lows of each session.
Adds labels with values (optionally including price).
Colors are customizable for each session:
Tokyo: Purple
London: Teal
New York: Orange
Customizable Settings:
Horizontal Offset: Shifts lines and labels horizontally for clarity.
Time Zone: Adjustable to UTC+1 (default).
Price Display: Option to show the exact price next to the label.
Settings and Translations
Display Settings
Horizontal Offset: Horizontal shift for lines and labels.
Show Price with Text: Displays the price next to the label (e.g., "London High: 123.45").
Time Settings
UTC: Time zone (default: UTC+1).
Session 1 (Tokyo)
Session 1: 02:00–09:00
High Text: "Tokyo High"
Low Text: "Tokyo Low"
High Color: Purple
Low Color: Purple
Session 2 (London)
Session 2: 09:00–17:00
High Text: "London High"
Low Text: "London Low"
High Color: Teal
Low Color: Teal
Session 3 (New York)
Session 3: 15:30–22:00
High Text: "New York High"
Low Text: "New York Low"
High Color: Orange
Low Color: Orange

KillZones & Sessions [TradingFinder] Volume | Asia, London & NY🔵 Introduction
🟣 Session
The forex market operates 24 hours a day, 5 days a week, with only Saturdays and Sundays being off; traders often focus on one of the forex trading sessions instead of trying to trade in all markets 24 hours a day.
Trading sessions are time intervals during which a specific financial market is active and trades are conducted. The Asia, London, and New York sessions are the most important trading sessions throughout the 24-hour period, during which a significant amount of money and liquidity enters the market.
🟣 Kill Zone
Traders in financial markets profit from the difference between the price at which they buy or sell and the current market price. Traders have different time horizons for trading.
Among these, some traders engage in daily or even hourly trading and must operate during times when the market has desirable trading volumes and significant price movements.
Kill zones are segments of a session with higher trading volumes and price fluctuations compared to the rest of the session.
🔵 How to Use
🟣 Session Time
The "Asia Session" consists of two sessions: "Sydney" and "Tokyo." The beginning of this session, according to the "UTC" time zone, is at 23:00 and ends at 06:00. Similarly, the beginning of the "Asia KillZone," according to the "UTC" time zone, is at 23:00, and it ends at 03:55.
The "London Session" consists of two sessions: "Frankfurt" and "London." The beginning of this session, according to the "UTC" time zone, is at 07:00, and it ends at 14:25. Similarly, the beginning of the "London KillZone," according to the "UTC" time zone, is at 07:00, and it ends at 09:55.
The beginning of the "New York am" session, according to the "UTC" time zone, is at 14:30, and it ends at 19:25. Similarly, the beginning of the "New York am KillZone," according to the "UTC" time zone, is at 14:30, and it ends at 16:55.
The beginning of the "New York pm" session, according to the "UTC" time zone, is at 19:30, and it ends at 22:55. Similarly, the beginning of the "New York pm KillZone," according to the "UTC" time zone, is at 19:30, and it ends at 20:55.
Important : To prevent session overlap, the working hours of each session have slightly changed.
🔵 Features
🟣 Simultaneous Session and Kill Zone
With this indicator, you can simultaneously view the kill zone and session. High and low lines are used to indicate sessions, while filled areas with color represent kill zones. If you do not want to see kill zones, you can turn off the display settings.
🟣 Candle, Time, and Volume
Using the "More Info" feature, you can see the number of candles, elapsed time, and traded volume within the colored filled area.
🔵 Settings
•Show More Info: To display "More Info," you need to turn on this feature and turn it off whenever you don't need it.
• You can also customize these settings for each session separately :
o Display or hide session.
o Choose session color.
o Set session time range.
o Display or hide kill zone.
o Set kill zone time range.

Timeshifter Triple Timeframe Strategy w/ SessionsOverview
The "Enhanced Timeshifter Triple Timeframe Strategy with Session Filtering" is a sophisticated trading strategy designed for the TradingView platform. It integrates multiple technical indicators across three different timeframes and allows traders to customize their trading Sessions. This strategy is ideal for traders who wish to leverage multi-timeframe analysis and session-based trading to enhance their trading decisions.
Features
Multi-Timeframe Analysis and direction:
Higher Timeframe: Set to a daily timeframe by default, providing a broader view of market trends.
Trading Timeframe: Automatically set to the current chart timeframe, ensuring alignment with the trader's primary analysis period.
Lower Timeframe: Set to a 15-minute timeframe by default, offering a granular view for precise entry and exit points.
Indicator Selection:
RMI (Relative Momentum Index): Combines RSI and MFI to gauge market momentum.
TWAP (Time Weighted Average Price): Provides an average price over a specified period, useful for identifying trends.
TEMA (Triple Exponential Moving Average): Reduces lag and smooths price data for trend identification.
DEMA (Double Exponential Moving Average): Similar to TEMA, it reduces lag and provides a smoother trend line.
MA (Moving Average): A simple moving average for basic trend analysis.
MFI (Money Flow Index): Measures the flow of money into and out of a security, useful for identifying overbought or oversold conditions.
VWMA (Volume Weighted Moving Average): Incorporates volume data into the moving average calculation.
PSAR (Parabolic SAR): Identifies potential reversals in price movement.
Session Filtering:
London Session: Trade during the London market hours (0800-1700 GMT+1).
New York Session: Trade during the New York market hours (0800-1700 GMT-5).
Tokyo Session: Trade during the Tokyo market hours (0900-1800 GMT+9).
Users can select one or multiple sessions to align trading with specific market hours.
Trade Direction:
Long: Only long trades are permitted.
Short: Only short trades are permitted.
Both: Both long and short trades are permitted, providing flexibility based on market conditions.
ADX Confirmation:
ADX (Average Directional Index): An optional filter to confirm the strength of a trend before entering a trade.
How to Use the Script
Setup:
Add the script to your TradingView chart.
Customize the input parameters according to your trading preferences and strategy requirements.
Indicator Selection:
Choose the primary indicator you wish to use for generating trading signals from the dropdown menu.
Enable or disable the ADX confirmation based on your preference for trend strength analysis.
Session Filtering:
Select the trading sessions you wish to trade in. You can choose one or multiple Sessions based on your trading strategy and market focus.
Trade Direction:
Set your preferred trade direction (Long, Short, or Both) to align with your market outlook and risk tolerance. You can use this feature to gauge the market and understand the possible directions.
Tips for Profitable and Safe Trading:
Recommended Timeframes Combination:
LT: 1m , CT: 5m, HT: 1H
LT: 1-5m , CT: 15m, HT: 4H
LT: 5-15m , CT: 4H, HT: 1W
Backtesting:
Always backtest the strategy on historical data to understand its performance under various market conditions.
Adjust the parameters based on backtesting results to optimize the strategy for your specific trading style.
Risk Management:
Use appropriate risk management techniques, such as setting stop-loss and take-profit levels, to protect your capital.
Avoid over-leveraging and ensure that you are trading within your risk tolerance.
Market Analysis:
Combine the script with other forms of market analysis, such as fundamental analysis or market sentiment, to make well-rounded trading decisions.
Stay informed about major economic events and news that could impact market volatility and trading sessions.
Continuous Monitoring:
Regularly monitor the strategy's performance and make adjustments as necessary.
Keep an eye on the results and settings for real-time statistics and ensure that the strategy aligns with current market conditions.
Education and Practice:
Continuously educate yourself on trading strategies and market dynamics.
Practice using the strategy in a demo account before applying it to live trading to gain confidence and understanding.

Forex Sessions by CryptoforForex Sessions Boxes
Killzones are the period of greatest volatility, and volatility is one of the main factors for finding the optimal trade time (OTT/Optimal Trade Time). That is, in a period of high volatility, we as traders have the most chances to open a good position, and at the same time not to sit on the charts for too long waiting for its closing.
Sessions:
1. Asian Session:
2. Frankfurt Session:
3. London Session:
3. New York Session:
Features:
Time zone change
Session time change
Show/hide Historical Data
Show/hide Pips
Show/hide Previous Day High/Low
Show/hide New York Midnight/True Daily Open
Text size and align customization
Borders style
Line and border sizes
Full customization of colors: borders, price lines, text, background
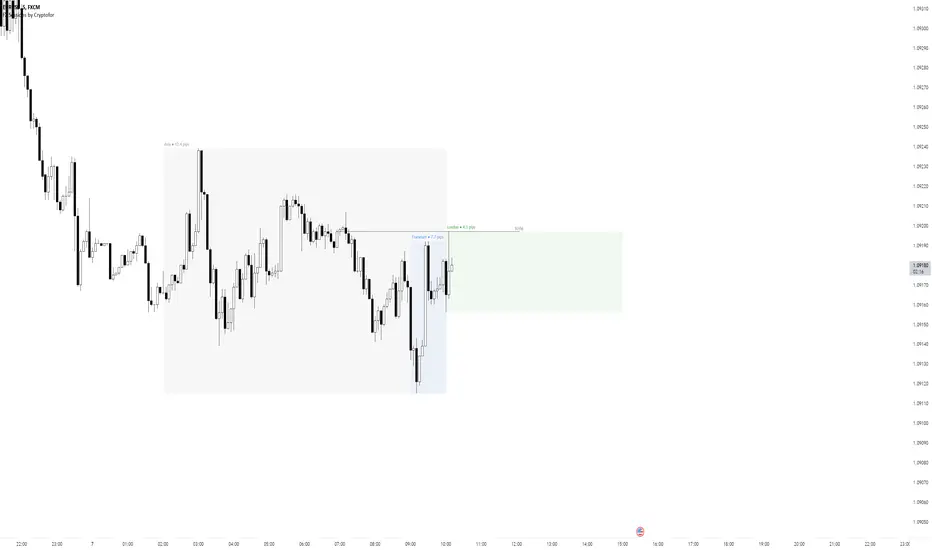
Session Seed Range (LON / FRA / NY / CME / ASIA + 3 Custom) — v6Session Seed Range → Lines (LON / FRA / NY / CME / ASIA + 3 Custom)
What it does
This tool draws two horizontal levels—the High and Low of a short seed window at each market open (e.g., London 09:00–09:05)—and extends them to the session close (e.g., 17:30). An optional Mid line (average of seed High/Low) can be displayed as well.
Included sessions
• London, Frankfurt, New York, CME, Asia
• Plus 3 fully custom sessions (name, seed window, session end)
Key features
• Seed window → extended lines: Capture the initial opening move and project it across the trading session.
• Timezone dropdown: Choose from common IANA timezones (incl. Europe/Istanbul)—no manual offset math.
• Label language: DE / EN / TR (or Off) for price labels at the right edge.
• Show/Hide Mid line per your preference.
• 3 custom sessions: Add your own schedules with custom names.
• Per-session styling: Colors and widths for High/Low/Mid.
• Lightweight: Works on any timeframe.
________________________________________
Quick start
1. Pick your Timezone in the Inputs.
2. Enable a session (e.g., London) and set its Seed (HHMM–HHMM) and Session End (HHMM).
3. Optionally turn on Show mid line and Labels (DE/EN/TR).
4. Repeat for other sessions or use the Custom A/B/C blocks.
Tip: The seed window must be visible on the chart’s timeframe so the High/Low can be collected. If you don’t see lines, zoom in or use a lower timeframe.
________________________________________
Inputs overview
• Timezone: IANA timezone selection.
• Labels: Off / DE / EN / TR + label offset (ticks).
• Show mid line: Toggle Mid (average of seed High/Low).
• Session blocks (London, Frankfurt, New York, CME, Asia, Custom A/B/C):
o Enable, Seed (HHMM–HHMM), Session End (HHMM)
o High/Low/Mid colors, Width
________________________________________
Notes & limitations
• Lines are built from the seed window only; they do not repaint once the seed completes.
• If the chart timeframe is too high to include the seed window, switch to a lower TF or widen the seed.
• This indicator is for analysis/education only and not financial advice.
________________________________________
Changelog (suggested)
• v1.0.0 — Initial release: LON/FRA/NY/CME/ASIA + 3 Custom, TZ dropdown, labels DE/EN/TR, Mid toggle.
________________________________________
If you want a shorter “store blurb” version, use:
Draws High/Low of a small opening seed window (e.g., London 09:00–09:05) and extends them to session close. Includes London, Frankfurt, New York, CME, Asia + 3 custom sessions. Timezone dropdown (incl. Europe/Istanbul), labels in DE/EN/TR (or Off), optional Mid line, per-session styling. Seed window must be visible on your timeframe. Not financial advice.
Essa's Sessions IndicatorOverview
This powerful tool is designed to visually map out the key trading sessions: Asia, London, and New York directly on your chart. By highlighting these periods and plotting their respective highs and lows, it helps you identify critical price levels, gauge market sentiment, and pinpoint potential breakout opportunities with ease.
What It Does
Visualizes Key Trading Sessions: Automatically draws colored backgrounds for the Asia, London, and New York sessions to show you exactly when the most important market activity is happening.
Plots Session Highs & Lows: Displays precise horizontal lines for the highest and lowest prices reached during each session, acting as key support and resistance levels.
Dual Timezone Mode: Easily switch between London (GMT/BST) and New York (EST/EDT) timezones with a single click. The indicator automatically adjusts all session times for you, ensuring accuracy no matter where you are.
Interactive & Informative Labels: Hover over any session high or low label to see a detailed tooltip containing:
The exact price level.
The session's price range (calculated in pips or points).
The total daily price range for broader context.
A simple volatility gauge (from "Low Vol 😴" to "High Vol 🔥").
Customizable Alerts: Enable breakout alerts to receive instant notifications the moment the price closes above a session high or below a session low.
Simple, powerful, and highly informative, this indicator is an essential tool for traders looking to build strategies around session-based price action.
