Celestial Pair Spread Hello friends, after a very long time!
Today, I tried to put into code an idea that came to my mind spontaneously and suddenly.
Note :
This script is experimental and improvable.
I haven't had a chance to try it yet.
TIMEFRAME : 1D (Daily Bars)
CELESTIAL SPREAD
The spread moves in a very limited area and is consistent within itself, especially on days far from the end of the contract.
That's why there is a reassuring sky atmosphere. That's why this name was given completely improvised.
Basic logic of the script
We enter the name of the CME Futures contract we want to enter:
Ex : CL1! , ES1! , ZC1! , NQ1!
The script creates us a pair trade parity divided into secondary contracts.
Example : ES1!/ES2!
What is pair trading?
I will explain briefly here.
For users who are wondering:
www.investopedia.com
Let's get back to our topic.
Now we have created a parity that does not actually exist.
This parity is the manifestation of the relative movements of two contracts.
When the parity rises, ES1! increased,ES2! has fallen.
In the opposite case, We can say: ES1! Contract has been dropped ES2! has increased.
Pair trading is generally a trade that needs to be kept in mind from time to time.
It is a method preferred by professionals who can process very quickly.
Market risk is minimal, but since 2 contracts are purchased, more money is paid and very low percentage profits are made.
It is very expensive to do pair trading, especially with oil and its derivatives and interest security derivatives.
The contract we are considering has micros. (small-item contracts tied to the same value)
So when we switch to our broker MES1!/MES2! We will trade.
For all CME futures :
www.cmegroup.com
Anyway, let's continue:
The script created the parity showing its relationship with the next contract and plotted it as bars.
Celestial bands are just like Bollinger bands, but they consist of 3 bands based on percentage changes rather than standard deviation.
The middle band is obtained from moving averages.
The upper and lower bands are the middle band subjected to a threshold value.
The threshold value can be changed.
0.15 percent was charged for this script.
CAUTION :
As can be seen in the example below;
The most important thing is not to make any transactions when the contract switch dates are approaching.
Therefore, it is recommended to use it just below the main chart.
The blue bars in the parity are
Values that outside the upper and lower threshold values are colored blue.
For this condition
Alerts has been added.
Don't forget to add alert and edit.
MAIN PURPOSE
It is aimed to start a pair trade when such conditions come and to quickly close the trades when the parity basis reaches the value.
OTHER IMPORTANT POINTS
Other issues are broker related issues.
Difference between initial margins and maintanence margins of contracts (between 1! and 2!)
It shouldn't be too high.
The commission should not be too high.
Leverage must be high because the profit percentage is very low.
To calculate leverage you must divide your contract size by the relevant margin requirement.
Sample margin requirement table:
www.interactivebrokers.com
RISKS
It is an experimental and intellectual script,
the risk of contract price differences (maybe it will not leave a profit except for very extreme values)
I remind you of the quickness risk that comes from a two-legged trade.
Alerts definitely synchronized with an audible alert sent to a smartphone as an e-mail notification and displayed on the locked screen for quick action.
Best regards!
在腳本中搜尋"smart"

MMXM ICT [TradingFinder] Market Maker Model PO3 CHoCH/CSID + FVG🔵 Introduction
The MMXM Smart Money Reversal leverages key metrics such as SMT Divergence, Liquidity Sweep, HTF PD Array, Market Structure Shift (MSS) or (ChoCh), CISD, and Fair Value Gap (FVG) to identify critical turning points in the market. Designed for traders aiming to analyze the behavior of major market participants, this setup pinpoints strategic areas for making informed trading decisions.
The document introduces the MMXM model, a trading strategy that identifies market maker activity to predict price movements. The model operates across five distinct stages: original consolidation, price run, smart money reversal, accumulation/distribution, and completion. This systematic approach allows traders to differentiate between buyside and sellside curves, offering a structured framework for interpreting price action.
Market makers play a pivotal role in facilitating these movements by bridging liquidity gaps. They continuously quote bid (buy) and ask (sell) prices for assets, ensuring smooth trading conditions.
By maintaining liquidity, market makers prevent scenarios where buyers are left without sellers and vice versa, making their activity a cornerstone of the MMXM strategy.
SMT Divergence serves as the first signal of a potential trend reversal, arising from discrepancies between the movements of related assets or indices. This divergence is detected when two or more highly correlated assets or indices move in opposite directions, signaling a likely shift in market trends.
Liquidity Sweep occurs when the market targets liquidity in specific zones through false price movements. This process allows major market participants to execute their orders efficiently by collecting the necessary liquidity to enter or exit positions.
The HTF PD Array refers to premium and discount zones on higher timeframes. These zones highlight price levels where the market is in a premium (ideal for selling) or discount (ideal for buying). These areas are identified based on higher timeframe market behavior and guide traders toward lucrative opportunities.
Market Structure Shift (MSS), also referred to as ChoCh, indicates a change in market structure, often marked by breaking key support or resistance levels. This shift confirms the directional movement of the market, signaling the start of a new trend.
CISD (Change in State of Delivery) reflects a transition in price delivery mechanisms. Typically occurring after MSS, CISD confirms the continuation of price movement in the new direction.
Fair Value Gap (FVG) represents zones where price imbalance exists between buyers and sellers. These gaps often act as price targets for filling, offering traders opportunities for entry or exit.
By combining all these metrics, the Smart Money Reversal provides a comprehensive tool for analyzing market behavior and identifying key trading opportunities. It enables traders to anticipate the actions of major players and align their strategies accordingly.
MMBM :
MMSM :
🔵 How to Use
The Smart Money Reversal operates in two primary states: MMBM (Market Maker Buy Model) and MMSM (Market Maker Sell Model). Each state highlights critical structural changes in market trends, focusing on liquidity behavior and price reactions at key levels to offer precise and effective trading opportunities.
The MMXM model expands on this by identifying five distinct stages of market behavior: original consolidation, price run, smart money reversal, accumulation/distribution, and completion. These stages provide traders with a detailed roadmap for interpreting price action and anticipating market maker activity.
🟣 Market Maker Buy Model
In the MMBM state, the market transitions from a bearish trend to a bullish trend. Initially, SMT Divergence between related assets or indices reveals weaknesses in the bearish trend. Subsequently, a Liquidity Sweep collects liquidity from lower levels through false breakouts.
After this, the price reacts to discount zones identified in the HTF PD Array, where major market participants often execute buy orders. The market confirms the bullish trend with a Market Structure Shift (MSS) and a change in price delivery state (CISD). During this phase, an FVG emerges as a key trading opportunity. Traders can open long positions upon a pullback to this FVG zone, capitalizing on the bullish continuation.
🟣 Market Maker Sell Model
In the MMSM state, the market shifts from a bullish trend to a bearish trend. Here, SMT Divergence highlights weaknesses in the bullish trend. A Liquidity Sweep then gathers liquidity from higher levels.
The price reacts to premium zones identified in the HTF PD Array, where major sellers enter the market and reverse the price direction. A Market Structure Shift (MSS) and a change in delivery state (CISD) confirm the bearish trend. The FVG then acts as a target for the price. Traders can initiate short positions upon a pullback to this FVG zone, profiting from the bearish continuation.
Market makers actively bridge liquidity gaps throughout these stages, quoting continuous bid and ask prices for assets. This ensures that trades are executed seamlessly, even during periods of low market participation, and supports the structured progression of the MMXM model.
The price’s reaction to FVG zones in both states provides traders with opportunities to reduce risk and enhance precision. These pullbacks to FVG zones not only represent optimal entry points but also create avenues for maximizing returns with minimal risk.
🔵 Settings
Higher TimeFrame PD Array : Selects the timeframe for identifying premium/discount arrays on higher timeframes.
PD Array Period : Specifies the number of candles for identifying key swing points.
ATR Coefficient Threshold : Defines the threshold for acceptable volatility based on ATR.
Max Swing Back Method : Choose between analyzing all swings ("All") or a fixed number ("Custom").
Max Swing Back : Sets the maximum number of candles to consider for swing analysis (if "Custom" is selected).
Second Symbol for SMT : Specifies the second asset or index for detecting SMT divergence.
SMT Fractal Periods : Sets the number of candles required to identify SMT fractals.
FVG Validity Period : Defines the validity duration for FVG zones.
MSS Validity Period : Sets the validity duration for MSS zones.
FVG Filter : Activates filtering for FVG zones based on width.
FVG Filter Type : Selects the filtering level from "Very Aggressive" to "Very Defensive."
Mitigation Level FVG : Determines the level within the FVG zone (proximal, 50%, or distal) that price reacts to.
Demand FVG : Enables the display of demand FVG zones.
Supply FVG : Enables the display of supply FVG zones.
Zone Colors : Allows customization of colors for demand and supply FVG zones.
Bottom Line & Label : Enables or disables the SMT divergence line and label from the bottom.
Top Line & Label : Enables or disables the SMT divergence line and label from the top.
Show All HTF Levels : Displays all premium/discount levels on higher timeframes.
High/Low Levels : Activates the display of high/low levels.
Color Options : Customizes the colors for high/low lines and labels.
Show All MSS Levels : Enables display of all MSS zones.
High/Low MSS Levels : Activates the display of high/low MSS levels.
Color Options : Customizes the colors for MSS lines and labels.
🔵 Conclusion
The Smart Money Reversal model represents one of the most advanced tools for technical analysis, enabling traders to identify critical market turning points. By leveraging metrics such as SMT Divergence, Liquidity Sweep, HTF PD Array, MSS, CISD, and FVG, traders can predict future price movements with precision.
The price’s interaction with key zones such as PD Array and FVG, combined with pullbacks to imbalance areas, offers exceptional opportunities with favorable risk-to-reward ratios. This approach empowers traders to analyze the behavior of major market participants and adopt professional strategies for entry and exit.
By employing this analytical framework, traders can reduce errors, make more informed decisions, and capitalize on profitable opportunities. The Smart Money Reversal focuses on liquidity behavior and structural changes, making it an indispensable tool for financial market success.

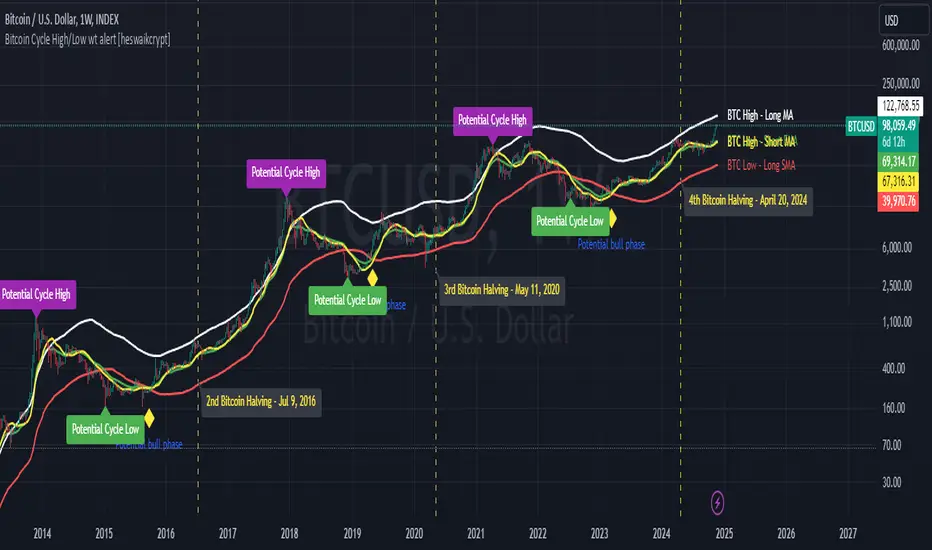
Bitcoin Cycle High/Low with functional Alert [heswaikcrypt]Introduction
Just as machines are fine-tuned for maximum efficiency, trading indicators must evolve to meet the demands of ever-changing markets.
Credit goes to the initial author, @NoCreditsLeft I only improved the existing Pi-cycle indicator with a functional alert and included a bull mode indicator in the script. The alert can help you get a live alert at candle close when the cycle tops, bottoms, and the potential bull phase switch occurs.
Philip Swift’s Pi Cycle Top Indicator is a brilliant example of leveraging mathematical relationships to signal critical turning points in Bitcoin’s price cycles. Historically, it has identified market and local tops with some relative accuracy, often within three days, as demonstrated in all the previous bull run cycles.
At its core, the Pi Cycle Indicator derives its name from the mathematical constant π (pi), achieved by using simple moving averages (MAs) in a specific ratio: 𝜋 = Long MA/short MA
The Bull mode switch is calculated using a crossover of the short exponentia moving average and the long moving average.
.
.
.
Knowing when Bitcoin reaches its top—and receiving timely alerts about it—is crucial for successful trading. The indicator is designed to signal;
Potential Bitcoin tops: Purple label
Potential Bitcoin bottoms : green Label, and
Parabolic swing : Yellow diamond shape (relating to the market switching to a potential bull mode)
"Please note: This indicator is tailored for Bitcoin using historical data analysis and should not be considered definitive. However accurate it might be."
Setting alerts
To set the alert conditions, select any alert function call to get alert whenever the conditions are met. The script is configured on dialy TF; you can set it on 1D or weekly TF.
Enjoy and Trade smartly
ICT Power Of Three | Flux Charts💎 GENERAL OVERVIEW
Introducing our new ICT Power Of Three Indicator! This indicator is built around the ICT's "Power Of Three" strategy. This strategy makes use of these 3 key smart money concepts : Accumulation, Manipulation and Distribution. Each step is explained in detail within this write-up. For more information about the process, check the "HOW DOES IT WORK" section.
Features of the new ICT Power Of Three Indicator :
Implementation of ICT's Power Of Three Strategy
Different Algorithm Modes
Customizable Execution Settings
Customizable Backtesting Dashboard
Alerts for Buy, Sell, TP & SL Signals
📌 HOW DOES IT WORK ?
The "Power Of Three" comes from these three keywords "Accumulation, Manipulation and Distribution". Here is a brief explanation of each keyword :
Accumulation -> Accumulation phase is when the smart money accumulate their positions in a fixed range. This phase indicates price stability, generally meaning that the price constantly switches between up & down trend between a low and a high pivot point. When the indicator detects an accumulation zone, the Power Of Three strategy begins.
Manipulation -> When the smart money needs to increase their position sizes, they need retail traders' positions for liquidity. So, they manipulate the market into the opposite direction of their intended direction. This will result in retail traders opening positions the way that the smart money intended them to do, creating liquidity. After this step, the real move that the smart money intended begins.
Distribution -> This is when the real intention of the smart money comes into action. With the new liquidity thanks to the manipulation phase, the smart money add their positions towards the opposite direction of the retail mindset. The purpose of this indicator is to detect the accumulation and manipulation phases, and help the trader move towards the same direction as the smart money for their trades.
Detection Methods Of The Indicator :
Accumulation -> The indicator detects accumulation zones as explained step-by-step :
1. Draw two lines from the lowest point and the highest point of the latest X bars.
2. If the (high line - low line) is lower than Average True Range (ATR) * accumulationConstant
3. After the condition is validated, an accumulation zone is detected. The accumulation zone will be invalidated and manipulation phase will begin when the range is broken.
Manipulation -> If the accumulation range is broken, check if the current bar closes / wicks above the (high line + ATR * manipulationConstant) or below the (low line - ATR * manipulationConstant). If the condition is met, the indicator detects a manipulation zone.
Distribution -> The purpose of this indicator is to try to foresee the distribution zone, so instead of a detection, after the manipulation zone is detected the indicator automatically create a "shadow" distribution zone towards the opposite direction of the freshly detected manipulation zone. This shadow distribution zone comes with a take-profit and stop-loss layout, customizable by the trader in the settings.
The X bars, accumulationConstant and manipulationConstant are subject to change with the "Algorithm Mode" setting. Read the "Settings" section for more information.
This indicator follows these steps and inform you step by step by plotting them in your chart.
🚩UNIQUENESS
This indicator is an all-in-one suite for the ICT's Power Of Three concept. It's capable of plotting the strategy, giving signals, a backtesting dashboard and alerts feature. Different and customizable algorithm modes will help the trader fine-tune the indicator for the asset they are currently trading. The backtesting dashboard allows you to see how your settings perform in the current ticker. You can also set up alerts to get informed when the strategy is executable for different tickers.
⚙️SETTINGS
1. General Configuration
Algorithm Mode -> The indicator offers 3 different detection algorithm modes according to your needs. Here is the explanation of each mode.
a) Small Manipulation
This mode has the default bar length for the accumulation detection, but a lower manipulation constant, meaning that slighter imbalances in the price action can be detected as manipulation. This setting can be useful on tickers that have lower liquidity, thus can be manipulated easier.
b) Big Manipulation
This mode has the default bar length for the accumulation detection, but a higher manipulation constant, meaning that heavier imbalances on the price action are required in order to detect manipulation zones. This setting can be useful on tickers that have higher liquidity, thus can be manipulated harder.
c) Short Accumulation
This mode has a ~70% lower bar length requirement for accumulation zone detection, and the default manipulation constant. This setting can be useful on tickers that are highly volatile and do not enter accumulation phases too often.
Breakout Method -> If "Close" is selected, bar close price will be taken into calculation when Accumulation & Manipulation zone invalidation. If "Wick" is selected, a wick will be enough to validate the corresponding zone.
2. TP / SL
TP / SL Method -> If "Fixed" is selected, you can adjust the TP / SL ratios from the settings below. If "Dynamic" is selected, the TP / SL zones will be auto-determined by the algorithm.
Risk -> The risk you're willing to take if "Dynamic" TP / SL Method is selected. Higher risk usually means a better winrate at the cost of losing more if the strategy fails. This setting is has a crucial effect on the performance of the indicator, as different tickers may have different volatility so the indicator may have increased performance when this setting is correctly adjusted.
3. Visuals
Show Zones -> Enables / Disables rendering of Accumulation (yellow) and Manipulation (red) zones.

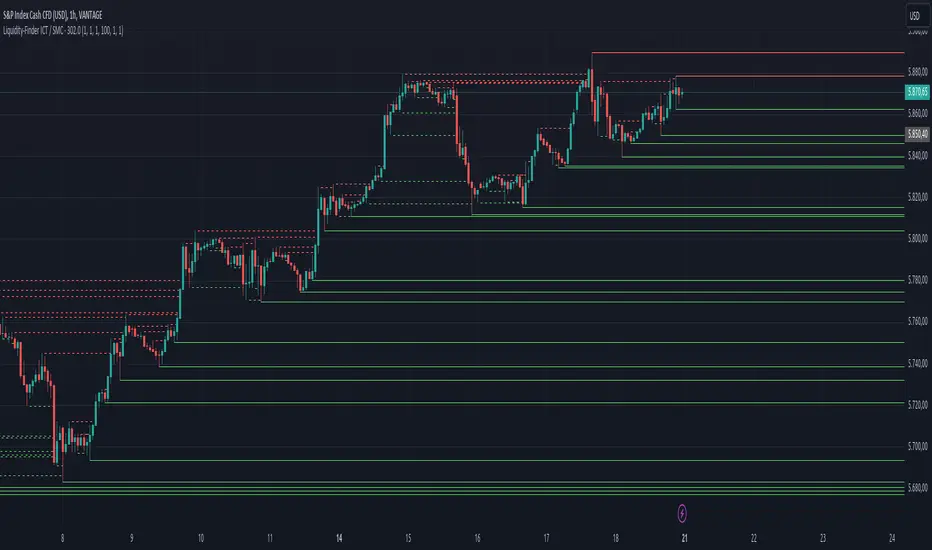
Liquidity-Finder ICT / SMCIn the context of ICT and the Smart Money Concept, liquidity is likely viewed as a crucial factor for determining the strength and sustainability of a market move. Smart Money is often associated with large institutional traders who have the ability to influence liquidity.
Liquidity Sweep:
A liquidity sweep in this context might involve Smart Money intentionally executing trades across various price levels to assess market depth and liquidity. This information can be used to identify potential areas of interest for Smart Money to initiate or exit positions without causing significant price disruptions.
Stop Hunt:
Stop hunting is a concept that Smart Money traders may employ to deliberately trigger stop orders in the market. By doing so, they can create temporary price movements that allow them to accumulate or liquidate positions at more favorable prices before the market reacts.
Smart Money Concept (SMC):
The Smart Money Concept revolves around the idea that large institutional traders (Smart Money) have superior information and resources compared to retail traders. Understanding the behavior of Smart Money, as taught in ICT and SMC, involves analyzing market dynamics, order flow, and liquidity to make more informed trading decisions.
Liquidating:
Liquidating refers to the process of selling or closing out existing positions. In the context of Smart Money, the term could imply that institutional traders are actively managing their positions, either taking profits or cutting losses strategically based on their analysis of market conditions.
The Indicator
The Indicator show open liquidity as solid lines and liquidates liquidity as dashed lines
Is able to send alerts for liquidity level was liquidated, liquidity level was dipped or the next close is on the other side
ATR VisualizerAdvance Your Market Analysis with the True Range Indicator
The True Range Indicator is a sophisticated screener meticulously developed to bolster your trading execution by presenting an exceptional understanding of the market direction. The centerpiece of this instrument is a distinctive candle configuration depicting the Average True Range (ATR) and the Bear/Bull range. However, it traverses beyond the conventional channels to offer specific market settings to boost your trading decisions.
User-Defined Settings
Broadly, the indicator offers five dynamic settings:
Bear/Bull Range
The Bear/Bull Range outlines the ATR for each candle type - bearish and bullish - and then smartly opts for the pertinent one based on the prevalent market circumstances. This feature aids in comparing the range of bullish and bearish candlesticks, which deepens your understanding of the price action and volatility.
Bearish Range
The Bearish Range isolates and computes the ATR for bearish candles solely. Utilizing this option spots the bear-dominated periods and provides insights about potential market reversals or downward continuations.
Bullish Range
Opposite to the Bearish Range, the Bullish Range setting tabulates the ATR exclusively for bullish candles. It assists in tracking the periods when bulls control, enlightening traders about the possibility of upward continuations or trend reversals.
Average Range
The Average Range provides an unbiased measure of range without prioritizing either bull or bear trends. This model is ideal for traders looking for a holistic interpretation of market behavior, regardless of direction.
Cumulative Average Range
Equally significant is the Cumulative Average Range which calculates the aggregate moving average of the true ranges for an expressed period. This setting is extremely valuable when evaluating the long-term volatility and spotting potential breakouts.
Dual Candle Configuration
Going a step ahead, the True Range Indicator uniquely offers the possibility to incorporate more than one candle estimate on your screen. This ensures simultaneous analysis of multiple market dynamics, thereby enhancing your trading precision multifold.
Concluding Thoughts
In essence, the True Range Indicator is an indispensable companion for traders looking to not only leverage market volatility but also make educated predictions. Equipped with an array of insightful market settings and the ability to display dual candle estimates on-screen, you can customize the functionality to suit your unique trading style and magnify your market performance dramatically.

OSPL Volume [Community Edition]NSE:BANKNIFTY1!
This indicator is based on the concepts popularized by @OptionsScalper123 "Siva" of OiPulse. His ideology Is that large moves come after high volume candles. For Nifty, high volume is considered to be a candle above 125k volume and for BankNifty it’s 50k.
This indicator allows you to cut the noise and focus only on the high volume candle. It shows high volume candle in a brighter shade and lower volume candles in a less visible shade.
You can set the minimum volume threshold limit for Nifty and BankNifty. The indicator smartly recognizes which index you are using it in and uses the respective threshold volume limit.
All colors are customizable.
Thanks for Siva for all the ideas and wonderful products he has given to the community
Thanks to all the wonderful Pinescipters for developing awesome indicators and keeping the source open.
The source code of this indicator is just a few lines. Hope you can use it in your projects and learn something from this just how I learned from other scripts.
Any changes or updates needed in this indicator, please suggest. I was thinking some kind of alerts can be added when volume crosses the threshold. Let me know.
Boost/like this indicator and comment if you find this useful. Cheers and happy trading!!!

Price alertThis indicator is an indicator for setting alerts.
Set alerts after adding them to the chart.
By setting an alert, you can notify the closing price to your smartphone or smartwatch.

Penny Stock Short Signal Pro# Penny Stock Short Signal Pro (PSSP) v1.0
## Complete User Guide & Documentation
---
# 📋 TABLE OF CONTENTS
1. (#introduction)
2. (#why-short-penny-stocks)
3. (#the-7-core-detection-systems)
4. (#installation--setup)
5. (#understanding-the-dashboard)
6. (#input-settings-deep-dive)
7. (#visual-elements-explained)
8. (#alert-configuration)
9. (#trading-strategies)
10. (#risk-management)
11. (#best-practices)
12. (#troubleshooting)
13. (#changelog)
---
# Introduction
**Penny Stock Short Signal Pro (PSSP)** is a comprehensive Pine Script v6 indicator specifically engineered for identifying high-probability short-selling opportunities on low-priced, high-volatility stocks. Unlike generic indicators that apply broad technical analysis, PSSP is purpose-built for the unique characteristics of penny stock price action—where parabolic moves, retail FOMO, and violent reversals create predictable patterns for prepared traders.
## Key Features
- **7 Independent Detection Systems** working in concert to identify exhaustion points
- **Composite Signal Engine** that requires multiple confirmations before triggering
- **Real-Time Dashboard** displaying all signal states and market metrics
- **Automatic Risk Management** with dynamic stop-loss and profit target calculations
- **Customizable Sensitivity** for different trading styles (scalping vs. swing)
- **Built-in Alert System** for all major signal types
## Who Is This For?
- **Active Day Traders** looking to capitalize on intraday reversals
- **Short Sellers** who specialize in penny stocks and small caps
- **Momentum Traders** who want to identify when momentum is exhausting
- **Risk-Conscious Traders** who need clear entry/exit levels
---
# Why Short Penny Stocks?
## The Penny Stock Lifecycle
Penny stocks follow a remarkably predictable lifecycle that creates shorting opportunities:
```
PHASE 1: ACCUMULATION
└── Low volume, tight range
└── Smart money quietly building positions
PHASE 2: MARKUP / PROMOTION
└── News catalyst or promotional campaign
└── Volume increases, price begins rising
└── Early momentum traders enter
PHASE 3: DISTRIBUTION (YOUR OPPORTUNITY)
└── Parabolic move attracts retail FOMO buyers
└── Smart money selling into strength
└── Volume climax signals exhaustion
└── ⚠️ PSSP SIGNALS FIRE HERE ⚠️
PHASE 4: DECLINE
└── Support breaks, panic selling
└── Price returns toward origin
└── Short sellers profit
```
## Why Shorts Work on Penny Stocks
1. **No Fundamental Support**: Most penny stocks have no earnings, revenue, or assets to justify elevated prices
2. **Promotional Nature**: Many rallies are driven by promoters who will eventually stop
3. **Retail Exhaustion**: Retail buying power is finite—when it's exhausted, gravity takes over
4. **Float Dynamics**: Low float stocks move fast in both directions
5. **Technical Levels Matter**: VWAP, round numbers, and prior highs become self-fulfilling resistance
---
# The 7 Core Detection Systems
PSSP employs seven independent detection algorithms. Each identifies a specific type of exhaustion or reversal signal. When multiple systems fire simultaneously, the probability of a successful short dramatically increases.
---
## 1. PARABOLIC EXHAUSTION DETECTOR
### What It Detects
Identifies when price has moved too far, too fast and is likely to reverse. This system looks for the classic "blow-off top" pattern common in penny stock runners.
### Technical Logic
```
Parabolic Signal = TRUE when:
├── Consecutive green candles ≥ threshold (default: 3)
├── AND price extension from VWAP ≥ threshold ATRs (default: 1.5)
└── OR shooting star / upper wick rejection pattern forms
```
### Visual Representation
```
╱╲ ← Shooting star / upper wick
╱ ╲ (Parabolic exhaustion)
╱
╱
╱
══════════════ VWAP
╱
╱
```
### Why It Works on Penny Stocks
Penny stocks are notorious for parabolic moves driven by retail FOMO. When everyone who wants to buy has bought, there's no one left to push prices higher. The shooting star pattern shows that sellers are already stepping in at higher prices.
### Key Settings
| Parameter | Default | Range | Description |
|-----------|---------|-------|-------------|
| Lookback Period | 10 | 3-30 | Bars to analyze for pattern |
| Extension Threshold | 1.5 ATR | 0.5-5.0 | How far above VWAP is "parabolic" |
| Consecutive Green Bars | 3 | 2-10 | Minimum green bars for exhaustion |
---
## 2. VWAP REJECTION SYSTEM
### What It Detects
Volume Weighted Average Price (VWAP) is the single most important level for institutional traders. This system identifies when price tests above VWAP and gets rejected back below—a powerful short signal.
### Technical Logic
```
VWAP Rejection = TRUE when:
├── Candle high pierces above VWAP
├── AND candle closes below VWAP
├── AND candle is bearish (close < open)
└── AND rejection distance is within sensitivity threshold
```
### Visual Representation
```
High ──→ ╱╲
╱ ╲
VWAP ════════╱════╲═══════════
Close ←── Rejection
```
### Extended VWAP Signals
The system also tracks VWAP standard deviation bands. Rejection from the upper band (2 standard deviations above VWAP) is an even stronger signal.
### Why It Works on Penny Stocks
- Algorithms and institutions use VWAP as their benchmark
- Failed attempts to reclaim VWAP often lead to waterfall selling
- VWAP acts as a "magnet" that price tends to revert toward
### Key Settings
| Parameter | Default | Range | Description |
|-----------|---------|-------|-------------|
| Rejection Sensitivity | 0.5 ATR | 0.1-2.0 | How close to VWAP for valid rejection |
| Show VWAP Line | True | - | Display VWAP on chart |
| Show VWAP Bands | True | - | Display standard deviation bands |
| Band Multiplier | 2.0 | 0.5-4.0 | Standard deviations for bands |
---
## 3. VOLUME CLIMAX DETECTOR
### What It Detects
Identifies "blow-off tops" where extreme volume accompanies a price spike. This often marks the exact top as it represents maximum retail participation—after which buying power is exhausted.
### Technical Logic
```
Volume Climax = TRUE when:
├── Current volume ≥ (Average volume × Climax Multiple)
├── AND one of:
│ ├── Selling into the high (upper wick > lower wick on green bar)
│ └── OR post-climax weakness (red bar following climax bar)
```
### Visual Representation
```
Price: ╱╲
╱ ╲
╱ ╲
╱ ╲
╱
Volume:
▂▃▅▇██▇▅▃▂▁
↑
Volume Climax (3x+ average)
```
### Why It Works on Penny Stocks
- Retail traders pile in at the top, creating volume spikes
- Market makers and smart money use this liquidity to exit
- Once the volume spike passes, there's no fuel left for higher prices
- The "smart money selling into dumb money buying" creates the top
### Key Settings
| Parameter | Default | Range | Description |
|-----------|---------|-------|-------------|
| Volume MA Length | 20 | 5-50 | Period for average volume calculation |
| Climax Volume Multiple | 3.0x | 1.5-10.0 | Multiple of average for "climax" |
| Show Volume Bars | True | - | Visual volume representation |
---
## 4. RSI DIVERGENCE ANALYZER
### What It Detects
Bearish divergence occurs when price makes higher highs but RSI (momentum) makes lower highs. This indicates that momentum is weakening even as price pushes higher—a warning of imminent reversal.
### Technical Logic
```
Bearish Divergence = TRUE when:
├── RSI is in overbought territory (> threshold)
├── AND RSI is declining (current < previous < prior)
└── Indicates momentum exhaustion before price catches up
```
### Visual Representation
```
Price: /\ /\
/ \ / \ ← Higher high
/ \/
/
/
RSI: /\
/ \ /\
/ \/ \ ← Lower high (DIVERGENCE)
/ \
════════════════════ Overbought (70)
```
### Why It Works on Penny Stocks
- Penny stocks often push to new highs on weaker and weaker momentum
- Divergence signals that fewer buyers are participating at each new high
- Eventually, the lack of buying pressure leads to collapse
### Key Settings
| Parameter | Default | Range | Description |
|-----------|---------|-------|-------------|
| RSI Length | 14 | 5-30 | Standard RSI calculation period |
| Overbought Level | 70 | 60-90 | RSI level considered overbought |
| Divergence Lookback | 14 | 5-30 | Bars to look back for swing highs |
---
## 5. KEY LEVEL REJECTION TRACKER
### What It Detects
Identifies rejections from significant price levels where shorts are likely to be concentrated: High of Day (HOD), premarket highs, and psychological levels (whole and half dollars).
### Technical Logic
```
Level Rejection = TRUE when:
├── Price touches key level (within 0.2% tolerance)
├── AND candle is bearish (close < open)
├── AND close is in lower portion of candle range
│
├── Key Levels Tracked:
│ ├── High of Day (HOD)
│ ├── Premarket High
│ └── Psychological levels ($1.00, $1.50, $2.00, etc.)
```
### Visual Representation
```
HOD ─────────────────────────────────
╱╲ ← Rejection
╱ ╲
╱ ╲
╱
─────────────────────────────────
PM High ─────────────────────────────
```
### Why It Works on Penny Stocks
- **HOD**: The high of day is where the most traders are trapped long. Failure to break HOD often triggers stop-loss cascades
- **Premarket High**: Represents overnight enthusiasm; failure to exceed often means the "news" is priced in
- **Psychological Levels**: Round numbers ($1, $2, $5) attract orders and act as natural resistance
### Key Settings
| Parameter | Default | Range | Description |
|-----------|---------|-------|-------------|
| Track HOD Rejection | True | - | Monitor high of day |
| Track Premarket High | True | - | Monitor premarket resistance |
| Track Psychological Levels | True | - | Monitor round numbers |
---
## 6. FAILED BREAKOUT DETECTOR
### What It Detects
Identifies "bull traps" where price breaks above resistance but immediately fails and closes back below. This traps breakout buyers and often leads to accelerated selling.
### Technical Logic
```
Failed Breakout = TRUE when:
├── Price breaks above recent high (lookback period)
├── AND one of:
│ ├── Same bar closes below the breakout level
│ └── OR following bars show consecutive red candles
```
### Visual Representation
```
╱╲
╱ ╲ ← False breakout
Recent High ══╱════╲════════════════
╱ ╲
╱ ╲
╱ ╲ ← Trapped longs panic sell
```
### Why It Works on Penny Stocks
- Breakout traders enter on the break, providing exit liquidity for smart money
- When the breakout fails, these traders become trapped and must exit
- Their forced selling accelerates the decline
- Penny stocks have thin order books, making failed breakouts especially violent
### Key Settings
| Parameter | Default | Range | Description |
|-----------|---------|-------|-------------|
| Breakout Lookback | 5 | 2-15 | Bars to define "recent high" |
| Confirmation Bars | 2 | 1-5 | Bars to confirm failure |
---
## 7. MOVING AVERAGE BREAKDOWN SYSTEM
### What It Detects
Monitors exponential moving averages (EMAs) for bearish crossovers and price rejections. EMA crosses often signal trend changes, while rejections from EMAs indicate resistance.
### Technical Logic
```
MA Breakdown = TRUE when:
├── Bearish EMA cross (fast crosses below slow)
└── OR EMA rejection (price tests EMA from below and fails)
```
### Visual Representation
```
╱╲ ← Rejection from EMA
╱ ╲
EMA 9 ═══════════╱════╲═══════════
╲
EMA 20 ═══════════════════╲════════
╲
Bearish cross ↓
```
### Why It Works on Penny Stocks
- EMAs smooth out the noise and show underlying trend direction
- When fast EMA crosses below slow EMA, it signals momentum shift
- Rejected attempts to reclaim EMAs show sellers are in control
### Key Settings
| Parameter | Default | Range | Description |
|-----------|---------|-------|-------------|
| Fast EMA | 9 | 3-20 | Short-term trend |
| Slow EMA | 20 | 10-50 | Medium-term trend |
| Show EMAs | True | - | Display on chart |
---
# Installation & Setup
## Step 1: Access Pine Editor
1. Open TradingView (tradingview.com)
2. Open any chart
3. Click "Pine Editor" at the bottom of the screen
## Step 2: Create New Indicator
1. Click "Open" → "New blank indicator"
2. Delete any existing code
3. Paste the entire PSSP code
## Step 3: Save and Add to Chart
1. Click "Save" (give it a name like "PSSP")
2. Click "Add to chart"
3. The indicator will appear with default settings
## Step 4: Configure Settings
1. Click the gear icon (⚙️) on the indicator
2. Adjust settings based on your trading style (see Settings section)
3. Click "OK" to apply
## Recommended Chart Setup
- **Timeframe**: 1-minute or 5-minute for scalping, 15-minute for swing shorts
- **Chart Type**: Candlestick
- **Extended Hours**: Enable if trading premarket/afterhours
- **Volume**: Can disable default volume since PSSP tracks it
---
# Understanding the Dashboard
The real-time dashboard provides at-a-glance status of all systems:
```
┌─────────────────────────────────────────┐
│ 📊 SHORT SIGNAL DASHBOARD │
├─────────────────────────────────────────┤
│ Signal Strength: 5/7 │
├─────────────────────────────────────────┤
│ ─── ACTIVE SIGNALS ─── │
│ │
│ Parabolic Exhaustion 🔴 2.1 ATR │
│ VWAP Rejection 🔴 Above │
│ Volume Climax 🔴 4.2x Avg │
│ RSI Divergence ⚪ RSI: 68 │
│ Level Rejection 🔴 @ HOD │
│ Failed Breakout 🔴 │
│ MA Breakdown ⚪ Bullish │
├─────────────────────────────────────────┤
│ ─── RISK LEVELS ─── │
│ Stop: $2.45 T1: $2.10 T2: $1.85 │
└─────────────────────────────────────────┘
```
## Dashboard Elements Explained
### Signal Strength Indicator
| Rating | Signals | Color | Interpretation |
|--------|---------|-------|----------------|
| STRONG | 5-7 | Red | High-confidence short opportunity |
| MODERATE | 3-4 | Orange | Decent setup, consider other factors |
| WEAK | 1-2 | Gray | Insufficient confirmation |
| NONE | 0 | Gray | No short signals active |
### Signal Status Icons
- 🔴 = Signal is ACTIVE (condition met)
- ⚪ = Signal is INACTIVE (condition not met)
### Contextual Metrics
Each signal row includes relevant metrics:
- **Parabolic**: Shows ATR extension from VWAP
- **VWAP**: Shows if price is Above/Below VWAP
- **Volume**: Shows current volume as multiple of average
- **RSI**: Shows current RSI value
- **Level**: Shows which level was touched (HOD, PM High, etc.)
- **MA**: Shows EMA relationship (Bullish/Bearish)
### Risk Levels
When a composite short signal fires:
- **Stop**: Suggested stop-loss level (high + ATR multiple)
- **T1**: First profit target (1:1 risk/reward)
- **T2**: Second profit target (user-defined R:R)
---
# Input Settings Deep Dive
## Group 1: Parabolic Exhaustion
| Setting | Default | Conservative | Aggressive | Description |
|---------|---------|--------------|------------|-------------|
| Enable | True | True | True | Turn system on/off |
| Lookback Period | 10 | 15 | 5 | Bars analyzed for pattern |
| Extension Threshold | 1.5 | 2.0 | 1.0 | ATRs above VWAP for "parabolic" |
| Consecutive Green Bars | 3 | 4 | 2 | Minimum green bars required |
**Tuning Tips:**
- Lower thresholds = more signals but more false positives
- Higher thresholds = fewer signals but higher quality
- For very volatile penny stocks, consider higher thresholds
## Group 2: VWAP Rejection
| Setting | Default | Conservative | Aggressive | Description |
|---------|---------|--------------|------------|-------------|
| Enable | True | True | True | Turn system on/off |
| Rejection Sensitivity | 0.5 | 0.3 | 0.8 | ATR distance for valid rejection |
| Show VWAP Line | True | True | True | Display VWAP |
| Show VWAP Bands | True | True | True | Display deviation bands |
| Band Multiplier | 2.0 | 2.5 | 1.5 | Standard deviations for bands |
**Tuning Tips:**
- Tighter sensitivity (lower number) = must reject very close to VWAP
- Wider bands = less frequent upper band rejections but more significant
## Group 3: Volume Climax
| Setting | Default | Conservative | Aggressive | Description |
|---------|---------|--------------|------------|-------------|
| Enable | True | True | True | Turn system on/off |
| Volume MA Length | 20 | 30 | 10 | Baseline volume period |
| Climax Volume Multiple | 3.0 | 4.0 | 2.0 | Multiple for "climax" status |
| Show Volume Profile | True | True | True | Visual volume bars |
**Tuning Tips:**
- Higher multiple = only extreme volume spikes trigger
- Shorter MA = more responsive to recent volume changes
- For highly liquid stocks, consider higher multiples
## Group 4: Momentum Divergence
| Setting | Default | Conservative | Aggressive | Description |
|---------|---------|--------------|------------|-------------|
| Enable | True | True | True | Turn system on/off |
| RSI Length | 14 | 21 | 7 | RSI calculation period |
| Overbought Level | 70 | 75 | 65 | Threshold for "overbought" |
| Divergence Lookback | 14 | 20 | 10 | Bars for swing high detection |
**Tuning Tips:**
- Lower overbought threshold = more frequent signals
- Shorter RSI length = more responsive but noisier
## Group 5: Key Level Rejection
| Setting | Default | Description |
|---------|---------|-------------|
| Enable | True | Master toggle for level system |
| Track Premarket High | True | Monitor premarket resistance |
| Track HOD Rejection | True | Monitor high of day |
| Track Psychological Levels | True | Monitor round numbers |
**Tuning Tips:**
- Disable premarket tracking if stock doesn't have significant premarket activity
- Psychological levels work best on stocks under $10
## Group 6: Failed Follow-Through
| Setting | Default | Conservative | Aggressive | Description |
|---------|---------|--------------|------------|-------------|
| Enable | True | True | True | Turn system on/off |
| Breakout Lookback | 5 | 8 | 3 | Bars defining "recent high" |
| Confirmation Bars | 2 | 3 | 1 | Bars to confirm failure |
**Tuning Tips:**
- Shorter lookback = more breakouts detected but smaller significance
- More confirmation bars = higher confidence but later entry
## Group 7: Moving Average Signals
| Setting | Default | Conservative | Aggressive | Description |
|---------|---------|--------------|------------|-------------|
| Enable | True | True | True | Turn system on/off |
| Fast EMA | 9 | 12 | 5 | Short-term trend |
| Slow EMA | 20 | 26 | 13 | Medium-term trend |
| Show EMAs | True | True | True | Display on chart |
**Tuning Tips:**
- Standard 9/20 works well for most penny stocks
- Faster EMAs (5/13) for scalping, slower (12/26) for swing trading
## Group 8: Composite Signal
| Setting | Default | Conservative | Aggressive | Description |
|---------|---------|--------------|------------|-------------|
| Minimum Signals | 3 | 4-5 | 2 | Signals needed for trigger |
| Show Dashboard | True | True | True | Display signal table |
| Dashboard Position | top_right | - | - | Screen location |
**Tuning Tips:**
- **Minimum Signals is the most important setting**
- Higher minimum = fewer trades but higher win rate
- Lower minimum = more trades but more false signals
## Group 9: Risk Management
| Setting | Default | Conservative | Aggressive | Description |
|---------|---------|--------------|------------|-------------|
| Show Stop Levels | True | True | True | Display stop loss |
| Stop ATR Multiple | 1.5 | 2.0 | 1.0 | Stop distance in ATRs |
| Show Targets | True | True | True | Display profit targets |
| Target R:R | 2.0 | 1.5 | 3.0 | Risk:Reward for Target 2 |
**Tuning Tips:**
- Tighter stops (lower ATR multiple) = less risk but more stop-outs
- Higher R:R targets = bigger winners but fewer targets hit
## Group 10: Visual Settings
| Setting | Default | Description |
|---------|---------|-------------|
| Bullish Color | Green | Color for bullish elements |
| Bearish Color | Red | Color for bearish/short signals |
| Warning Color | Orange | Color for caution signals |
| Neutral Color | Gray | Color for inactive elements |
---
# Visual Elements Explained
## Chart Overlays
### VWAP Line (Blue)
- **Solid blue line** = Volume Weighted Average Price
- Price above VWAP = bullish bias
- Price below VWAP = bearish bias
- **Use**: Short when price rejects from above VWAP
### VWAP Bands (Purple circles)
- Upper band = 2 standard deviations above VWAP
- Lower band = 2 standard deviations below VWAP
- **Use**: Extreme extension to upper band signals potential reversal
### EMAs (Orange and Red)
- **Orange line** = Fast EMA (9-period default)
- **Red line** = Slow EMA (20-period default)
- **Use**: Bearish cross or price rejection from EMAs confirms short
### HOD Line (Red, dashed)
- Shows the current day's high
- **Use**: Rejection from HOD is a key short signal
### Premarket High (Orange, dashed)
- Shows premarket session high
- **Use**: Failure to break PM high often signals weakness
## Signal Markers
### Individual Signal Markers (Small)
| Shape | Color | Signal |
|-------|-------|--------|
| ▼ Triangle | Purple | Parabolic Exhaustion |
| ✕ X-Cross | Blue | VWAP Rejection |
| ◆ Diamond | Yellow | Volume Climax |
| ● Circle | Orange | RSI Divergence |
| ■ Square | Red | Failed Breakout |
### Composite Short Signal (Large)
- **Large red triangle** with "SHORT" text
- Only appears when minimum signal threshold is met
- This is your primary trading signal
## Risk Level Lines
### Stop Loss (Red line)
- Calculated as: Entry + (ATR × Stop Multiple)
- Represents maximum acceptable loss
- **RESPECT THIS LEVEL**
### Target 1 (Light green line)
- First profit target at 1:1 risk/reward
- Consider taking partial profits here
### Target 2 (Dark green line)
- Second profit target at user-defined R:R
- Let winners run to this level
## Background Coloring
### Light Red Background
- Appears when composite short signal is active
- Indicates you should be looking for shorts, not longs
### Light Purple Background
- Appears during extreme parabolic extension
- Warning of potential imminent reversal
---
# Alert Configuration
## Available Alerts
### 1. Composite Short Signal
**Best for**: Primary trading signal
```
Condition: Composite short signal fires
Message: "PSSP: Short Signal Triggered - {ticker} at {close}"
```
### 2. Parabolic Exhaustion
**Best for**: Early warning of potential top
```
Condition: Parabolic exhaustion detected
Message: "PSSP: Parabolic exhaustion detected on {ticker}"
```
### 3. Volume Climax
**Best for**: Blow-off top identification
```
Condition: Volume climax occurs
Message: "PSSP: Volume climax / blow-off top on {ticker}"
```
### 4. Strong Short Setup (5+ Signals)
**Best for**: High-confidence opportunities only
```
Condition: 5 or more signals active
Message: "PSSP: STRONG short setup on {ticker}"
```
### 5. Very Strong Short Setup (6+ Signals)
**Best for**: Maximum confidence trades
```
Condition: 6 or more signals active
Message: "PSSP: VERY STRONG short setup on {ticker}"
```
### 6. Failed Breakout
**Best for**: Bull trap identification
```
Condition: Failed breakout detected
Message: "PSSP: Failed breakout detected on {ticker}"
```
### 7. Key Level Rejection
**Best for**: Resistance level plays
```
Condition: Key level rejection occurs
Message: "PSSP: Key level rejection on {ticker}"
```
## Setting Up Alerts in TradingView
1. Right-click on the chart
2. Select "Add Alert"
3. Set Condition to "Penny Stock Short Signal Pro"
4. Choose your desired alert condition
5. Configure notification method (popup, email, webhook, etc.)
6. Set expiration (or "Open-ended" for permanent)
7. Click "Create"
## Alert Strategy Recommendations
### For Active Day Traders
- Enable: Composite Short Signal, Volume Climax
- Set to: Popup + Sound
- Check frequently during market hours
### For Swing Traders
- Enable: Strong Short Setup (5+), Very Strong Short Setup (6+)
- Set to: Email + Mobile Push
- Review at key times (open, lunch, close)
### For Part-Time Traders
- Enable: Very Strong Short Setup (6+) only
- Set to: Email + SMS
- Only trade highest-conviction setups
---
# Trading Strategies
## Strategy 1: The Parabolic Fade
**Setup Requirements:**
- Parabolic Exhaustion signal ACTIVE
- Extension from VWAP ≥ 2.0 ATR
- Volume climax or declining volume on push
**Entry:**
- Short on first red candle after signal
- Or short on break below prior candle's low
**Stop Loss:**
- Above the high of the parabolic move
- Maximum: 1.5 ATR above entry
**Targets:**
- T1: VWAP (take 50% off)
- T2: Lower VWAP band or LOD
**Best Time:** 9:30-10:30 AM (morning runners)
---
## Strategy 2: VWAP Rejection Short
**Setup Requirements:**
- VWAP Rejection signal ACTIVE
- Price came from below VWAP
- Rejection candle has significant upper wick
**Entry:**
- Short on close below VWAP
- Or short on break below rejection candle low
**Stop Loss:**
- Above VWAP + 0.5 ATR
- Or above rejection candle high
**Targets:**
- T1: Lower VWAP band
- T2: Prior support or LOD
**Best Time:** Midday (11:00 AM - 2:00 PM)
---
## Strategy 3: HOD Failure Short
**Setup Requirements:**
- Level Rejection signal ACTIVE (HOD)
- Multiple tests of HOD without breakthrough
- Volume declining on each test
**Entry:**
- Short on confirmed HOD rejection
- Wait for close below the rejection candle
**Stop Loss:**
- Above HOD + 0.25 ATR (tight)
- Clear invalidation if HOD breaks
**Targets:**
- T1: VWAP
- T2: Morning support levels
**Best Time:** 10:30 AM - 12:00 PM
---
## Strategy 4: Volume Climax Fade
**Setup Requirements:**
- Volume Climax signal ACTIVE
- Volume ≥ 3x average on green candle
- Followed by bearish candle or upper wick
**Entry:**
- Short on first red candle after climax
- Or short on break below climax candle low
**Stop Loss:**
- Above climax candle high
- Give room for volatility spike
**Targets:**
- T1: 50% retracement of the run
- T2: VWAP or start of the run
**Best Time:** First hour of trading
---
## Strategy 5: The Full Composite (High Conviction)
**Setup Requirements:**
- Composite Short signal ACTIVE
- Minimum 4-5 individual signals
- Clear visual of signal markers clustering
**Entry:**
- Short immediately on composite signal
- Use market order for fast-moving stocks
**Stop Loss:**
- Use indicator's automatic stop level
- Do not deviate from system
**Targets:**
- T1: Indicator's T1 level (1:1)
- T2: Indicator's T2 level (2:1)
**Best Time:** Any time with sufficient signals
---
# Risk Management
## Position Sizing Formula
```
Position Size = (Account Risk %) / (Stop Loss %)
Example:
- Account: $25,000
- Risk per trade: 1% = $250
- Entry: $2.00
- Stop: $2.20 (10% stop)
- Position Size: $250 / 10% = $2,500 worth
- Shares: $2,500 / $2.00 = 1,250 shares
```
## Risk Rules
### The 1% Rule
Never risk more than 1% of your account on any single trade. For a $25,000 account, max risk = $250.
### The 2x Stop Rule
If your stop gets hit twice on the same stock, stop trading it for the day. The pattern isn't working.
### The Daily Loss Limit
Set a maximum daily loss (e.g., 3% of account). Stop trading if hit.
### The Size-Down Rule
After a losing trade, reduce your next position size by 50%. Rebuild after a winner.
## Short-Specific Risks
### The Short Squeeze
- Penny stocks can squeeze violently
- ALWAYS use stops
- Never "hope" a position comes back
- Size appropriately for volatility
### The Hard-to-Borrow
- Check borrow availability before trading
- High borrow fees eat into profits
- Some stocks become HTB mid-trade
### The Halt Risk
- Penny stocks can halt on volatility
- Position size for worst-case halt against you
- Halts can open significantly higher
---
# Best Practices
## DO's
✅ **Wait for multiple signals** - Single signals have lower accuracy
✅ **Trade with the trend** - Short when daily trend is down
✅ **Use the dashboard** - Check signal count before entering
✅ **Respect stops** - The indicator calculates them for a reason
✅ **Size appropriately** - Penny stocks are volatile; position small
✅ **Trade liquid stocks** - Volume ≥ 500K daily average
✅ **Know the catalyst** - Understand why the stock is moving
✅ **Take partial profits** - Secure gains at T1
✅ **Journal your trades** - Track what works and what doesn't
✅ **Time your entries** - Best shorts often come 10:30-11:30 AM
## DON'Ts
❌ **Don't short strong stocks** - If it won't go down, don't force it
❌ **Don't fight the tape** - A stock going up can keep going up
❌ **Don't average up on losers** - Adding to losing shorts is dangerous
❌ **Don't ignore the dashboard** - It exists to help you
❌ **Don't overtrade** - Quality over quantity
❌ **Don't short into news** - Wait for the reaction first
❌ **Don't trade the first 5 minutes** - Too chaotic for reliable signals
❌ **Don't hold overnight** - Penny stock gaps can destroy accounts
❌ **Don't trade without stops** - Ever.
❌ **Don't trade on tilt** - After losses, take a break
## Optimal Trading Windows
| Time (ET) | Quality | Notes |
|-----------|---------|-------|
| 9:30-9:35 | ⭐ | Too volatile, avoid |
| 9:35-10:30 | ⭐⭐⭐⭐⭐ | Best shorts, morning runners exhaust |
| 10:30-11:30 | ⭐⭐⭐⭐ | Secondary exhaustion, HOD rejections |
| 11:30-2:00 | ⭐⭐ | Midday lull, lower quality |
| 2:00-3:00 | ⭐⭐⭐ | Afternoon setups develop |
| 3:00-3:30 | ⭐⭐⭐⭐ | End of day momentum |
| 3:30-4:00 | ⭐⭐ | Closing volatility, risky |
---
# Troubleshooting
## Common Issues
### "Signals aren't appearing"
- Check that the relevant system is enabled in settings
- Ensure minimum signals threshold isn't too high
- Verify the stock has sufficient volume for calculations
### "Too many false signals"
- Increase minimum signals threshold
- Use more conservative settings (see Settings section)
- Focus on stocks with cleaner price action
### "Dashboard not showing"
- Ensure "Show Signal Dashboard" is enabled
- Check that your chart has enough space
- Try a different dashboard position
### "VWAP line is missing"
- VWAP requires intraday timeframes (1m, 5m, 15m, etc.)
- VWAP resets daily; won't show on daily+ charts
- Ensure "Show VWAP Line" is enabled
### "Stop loss seems too tight/wide"
- Adjust Stop ATR Multiple in Risk Management settings
- Lower multiple = tighter stop
- Higher multiple = wider stop
### "Alerts not triggering"
- Verify alert is set to the correct indicator
- Check that alert hasn't expired
- Ensure notification settings are configured in TradingView
## Performance Optimization
If the indicator is slow:
1. Reduce the number of visual elements shown
2. Disable unused signal systems
3. Use on fewer simultaneous charts
4. Close unused browser tabs
---
# Changelog
## Version 1.0 (Initial Release)
- 7 core detection systems implemented
- Real-time signal dashboard
- Automatic risk management calculations
- 7 alert conditions
- Full visual overlay system
- Comprehensive input settings
## Planned Features (Future Updates)
- Scanner integration for multi-stock screening
- Machine learning signal weighting
- Backtesting statistics panel
- Volume profile analysis
- Level 2 data integration (if available)
- Custom timeframe VWAP options
---
# Support & Feedback
## Reporting Issues
When reporting issues, please include:
1. TradingView username
2. Stock symbol and timeframe
3. Screenshot of the issue
4. Your indicator settings
5. Steps to reproduce
## Feature Requests
We welcome suggestions for improving PSSP. Consider:
- What specific pattern are you trying to catch?
- How would this help your trading?
- Any reference examples?
---
# Disclaimer
**IMPORTANT: This indicator is for educational and informational purposes only.**
- Past performance does not guarantee future results
- Short selling carries unlimited risk potential
- Always use proper position sizing and stop losses
- Paper trade before using real capital
- The creator assumes no liability for trading losses
- Consult a financial advisor before trading
**Trade at your own risk.**
---
*Penny Stock Short Signal Pro v1.0*
*Pine Script v6*
*© 2025*

Teemo Volume Delta & Market HUDTeemo Volume Delta & Market HUD
Description:
Teemo Volume Delta goes beyond simple volume indicators to provide expert-level analysis of Buy and Sell pressure within the market. It visualizes supply/demand imbalances inside candles and provides an immediate grasp of market control via a real-time HUD.
With the v1.2.0 update, we have removed unnecessary overlays (like EMAs) to focus on Pure Delta Analysis and a flexible Smart Accumulation System, making the tool lighter and more powerful.
🚀 Key Features
1. Dual Calculation Modes Offers two calculation methods tailored to your trading environment and goals:
Estimation: Rapidly estimates buy/sell volume based on candle shape (OHLC) and price range. It features fast loading times and works instantly on all assets.
Intraday: Analyzes lower timeframe data (e.g., 1-minute bars) to calculate the precise delta of the current timeframe. (Loading time may vary depending on TradingView data limits.)
2. Smart Accumulation System Supports strategic analysis beyond simple summation with two distinct modes:
Time Based: Resets the Cumulative Delta to 0 at specific intervals (e.g., every 4 hours, Daily). This is optimized for session-based analysis or day trading.
Infinite: Continuously accumulates data without resetting, ideal for analyzing long-term Divergences between price and delta.
3. Intuitive HUD (Heads-Up Display) Displays critical market data on the chart for instant decision-making:
Delta Panel: Shows real-time Buy/Sell volume and Net Delta for the current candle.
Market HUD: Provides a comprehensive view of Trend Strength (ADX), Momentum (RSI), and the Cumulative Buy/Sell status for the current period.
4. Teemo Design System (v1.2) Provides optimized color themes for visual comfort during long trading sessions:
Teemo Neon: High-contrast Mint/Purple theme optimized for dark backgrounds.
Classic Soft: A calming Soft Green/Red theme designed to reduce eye strain (Recommended for all backgrounds).
⚙️ Settings Guide
Calculation Mode: Choose between Estimation (Speed) or Intraday (Precision).
Accumulation Mode: Choose Time Based (Periodic Reset) or Infinite (Continuous).
Reset Period: Set the reset interval for Time Based mode (e.g., 1D = Daily Reset).
Color Preset: Select between Teemo Neon or Classic Soft themes.
💡 Trading Tips
Delta Divergence: If the price makes a higher high but the Cumulative Delta (HUD) makes a lower high, it signals weakening buying pressure and a potential reversal.
Candle Coloring: A solid Mint (or Green) candle body indicates a price rise accompanied by strong actual buying volume, offering higher reliability than standard candles.
HUD Confluence: Consider trend-following entries when the ADX is above 25 and the Delta is heavily skewed in one direction.
This indicator is for informational purposes only and does not constitute financial advice. The Estimation mode provides approximations based on algorithms, and the Intraday mode's accuracy depends on the quality of the lower timeframe data provided by the exchange.
Developed by Teemo Trading Systems
------------------------------------------------------------------------
Teemo Volume Delta & Market HUD
설명 본문:
Teemo Volume Delta는 단순한 거래량 지표를 넘어, 시장 내부의 매수(Buy)와 매도(Sell) 압력을 정밀하게 분석하는 전문가용 도구입니다. 캔들 내부의 수급 불균형을 시각화하고, 실시간 HUD를 통해 시장의 주도권이 누구에게 있는지 즉각적으로 파악할 수 있도록 돕습니다.
v1.2.0 업데이트를 통해 불필요한 보조지표(EMA)를 제거하고, 순수한 델타 분석과 유연한 누적(Accumulation) 시스템에 집중하여 더욱 가볍고 강력해졌습니다.
🚀 주요 기능 (Key Features)
1. 듀얼 계산 모드 (Dual Calculation Modes) 사용자의 환경과 목적에 맞춰 두 가지 계산 방식을 제공합니다.
Estimation (추정 모드): 캔들의 형태(OHLC)와 가격 변동폭을 기반으로 매수/매도 볼륨을 빠르게 추정합니다. 로딩 속도가 빠르며 모든 자산에 즉시 적용 가능합니다.
Intraday (정밀 분석 모드): 하위 타임프레임(예: 1분봉)의 데이터를 분석하여 상위 타임프레임의 델타를 정밀하게 계산합니다. (TradingView 데이터 제한에 따라 로딩 시간이 소요될 수 있습니다.)
2. 스마트 누적 시스템 (Smart Accumulation) 단순 누적을 넘어, 전략적 분석을 위한 두 가지 모드를 지원합니다.
Time Based: 지정한 주기(예: 4시간, 1일)마다 누적 델타를 **0으로 초기화(Reset)**합니다. 세션별 수급 분석이나 데이 트레이딩에 최적화되어 있습니다.
Infinite: 초기화 없이 데이터를 계속 누적하여, 장기적인 가격과 델타의 **다이버전스(Divergence)**를 분석하는 데 유용합니다.
3. 직관적인 HUD (Heads-Up Display) 차트 우측과 좌측에 핵심 정보를 요약하여 보여줍니다.
Delta Panel: 현재 캔들의 매수/매도 거래량과 순매수(Net Delta) 상태를 실시간으로 표시합니다.
Market HUD: ADX(추세 강도), RSI(모멘텀), 그리고 현재 구간의 누적 매수/매도 현황을 한눈에 볼 수 있습니다.
4. Teemo Design System (v1.2) 장시간 차트를 보는 트레이더를 위해 시인성이 뛰어난 컬러 테마를 제공합니다.
Teemo Neon: 어두운 배경에 최적화된 고대비 민트/퍼플 테마.
Classic Soft: 눈의 피로를 줄여주는 차분한 그린/레드 테마 (밝은/어두운 배경 모두 추천).
⚙️ 설정 가이드 (Settings)
Calculation Mode: Estimation(속도 중심) 또는 Intraday(정확도 중심) 중 선택.
Accumulation Mode: Time Based(주기별 리셋) 또는 Infinite(무한 누적) 선택.
Reset Period: Time Based 모드 사용 시 리셋할 주기 설정 (예: 1D = 매일 리셋).
Color Preset: Teemo Neon 또는 Classic Soft 테마 선택.
💡 활용 팁 (Trading Tips)
델타 다이버전스: 가격은 신고가를 갱신하지만 누적 델타(Cum Delta)는 낮아진다면, 매수세가 약화되고 있다는 강력한 반전 신호입니다.
캔들 컬러링: 캔들의 몸통 색상이 짙은 민트색(또는 그린)이라면 강력한 매수세가 동반된 상승을 의미하며, 신뢰도가 높습니다.
HUD 활용: ADX가 25 이상이면서 델타가 한쪽 방향으로 쏠릴 때 추세 매매를 고려하세요.
이 지표는 정보 제공의 목적으로만 사용되며, 재정적 조언이 아닙니다. Estimation 모드는 근사치를 제공하며, Intraday 모드는 거래소에서 제공하는 하위 데이터의 품질에 따라 정확도가 달라질 수 있습니다.

SMA Lines📊 SMA Lines Indicator - Complete Trading System
Professional multi-feature indicator for Bursa Malaysia combining moving averages, breakout detection, smart money tracking, and visual market participant identification.

🎯 Core Components:
1. Four Simple Moving Averages
• 🟡 SMA 7 (Yellow) - Very short-term trend
• 🔴 SMA 20 (Red) - Short-term trend
• 🔵 SMA 50 (Blue) - Medium-term trend
• ⚫ SMA 200 (Black) - Long-term trend
2. Bollinger Bands
• 20-period, 2.0 std deviation
• Oversold/overbought detection
• Mean reversion opportunities
3. 10-Priority Candlestick Colors
1. 🔵 BLUE - All-Time High breakout (STRONGEST BUY)
2. ⚫ BLACK - All-Time Low breakdown (EXTREME WARNING)
3. 🟡 YELLOW - Open & Close < BB Lower (Extreme oversold)
4. 🟣 PURPLE - Close < BB Lower (Oversold)
5. 🔷 AQUA - 52-Week High breakout
6. 🟢 LIME - Bullish breakout (20-period)
7. 🟠 ORANGE - 52-Week Low breakdown
8. 🟪 FUCHSIA - Bearish breakdown
9. 🟩 GREEN - Normal bullish (Close > Open)
10. 🔴 RED - Normal bearish (Close < Open)
4. Animal Emoji Market Participants
Shows WHO controls the market (one emoji max per bar):
• 🐊 CROCODILE - Smart money/operators at major breakouts (52W/ATH + volume 2x+)
• 🐘 ELEPHANT - Big institutions (volume 4x+ & large candle 2x ATR)
• 🦈 SHARK - Liquidity hunters (volume 2.5x+ on breakouts)
• 🐂 BULL - Strong buyers (SMA alignment + rising 3 bars + volume + 1.2x ATR candle)
• 🐻 BEAR - Strong sellers (SMA reversed + falling 3 bars + volume + 1.2x ATR candle)
• 🐑 SHEEP - Weak retail (volume <0.5x, small candle, no conviction)
Priority System: Crocodile > Elephant > Shark > Bull > Bear > Sheep (no overlap)

📍 Detection Systems:
Three Breakout Levels:
• 20-Period - Short-term breakouts
• 52-Week (252 days) - Yearly resistance/support
• All-Time High/Low - Historical extremes
Volume Confirmation:
• All breakouts require 1.5x+ volume spike
• Filters false signals

⚙️ Key Settings:
• Moving Averages: Customizable periods
• Bollinger Bands: Length & std dev adjustable
• Breakout Period: Default 20 bars
• Volume Multiplier: Default 1.5x
• Toggle Controls: Enable/disable any feature

🎯 Best Trading Strategies:
1. ATH Blue Sky Breakout 🔵
• Entry: Blue candle with 🐊/🐘 emoji
• Target: Open (trail with stop)
• Position: 3-5% (highest conviction)
2. Smart Money Follow 🐊🦈🐘
• Entry: On emoji signal
• Exit: Volume normalizes
• Position: 3-4%
3. Oversold Bounce 🟡🟣
• Entry: Yellow/Purple in uptrend
• Target: BB Middle/Upper (2-3:1 RR)
• Position: 2-3%
4. Trend Following 🐂
• Entry: Bull emoji with SMA alignment
• Trail: SMA 7 or SMA 20
• Exit: Bear emoji appears

⚠️ Key Rules:
✅ Follow: Blue (ATH), Crocodile, Elephant, Bull in uptrend
❌ Avoid: Black (ATL), Sheep signals, counter-trend trades
⚡ Volume Required: All signals need volume confirmation
📊 Risk: 2-5% per trade maximum

💡 Unique Features:
• Non-overlapping emojis - Priority system ensures clean chart
• 10-level color hierarchy - Instant visual analysis
• Smart money detection - See institutional activity
• Real-time labels - Current SMA values displayed
• Professional design - Clean, no clutter

Target Market: Bursa Malaysia (LONG only)
Best Timeframes: Daily, 4H, 1H
Skill Level: Beginner to Advanced
Complete professional system combining technical analysis with behavioral market participant tracking for data-driven trading decisions! 🚀📈

BULLISH!! Low High Range Options HelperThis indicator is designed for range-based options trading, where price tends to rotate between a defined low and high rather than trend continuously. Its purpose is not to tell you what to trade, but to provide context for timing, specifically answering the question: if price is at a discount here, how much time should an option realistically have?
The script identifies a recent price range and plots three key levels. The range high represents the upper boundary of recent price action and often acts as a take-profit or resistance area. The range mid is the 50 percent equilibrium of the range and is intended as a confirmation level rather than an entry signal. The range low represents the discount zone, where risk is best defined for bullish options trades. This is the only area where options guidance is displayed.
When price touches the range low, the indicator calculates how long similar range rotations have taken in the past, adjusts that timing to the current chart timeframe, and applies a safety factor to reduce the risk of under-timing an options position. It then displays a suggested days-to-expiration label, such as 3 DTE, 4 DTE, 5 DTE, 6 DTE, 7 DTE, 10 DTE, or 14 plus. Shorter DTE values reflect faster expected rotations, while longer DTE values reflect slower, choppier, or more uncertain conditions. The goal is to help avoid the common mistake of buying options that do not have enough time to work.
A typical way to use this tool is to identify a clearly defined range, wait for price to reach the range low, note the DTE guidance shown on the chart, then wait for confirmation such as a reclaim of the range midpoint before considering a trade. Risk can then be managed with the range structure in mind, often targeting the range high in rotational environments. The indicator is most effective in sideways or mean-reverting markets rather than strong trends.
This script does not place trades, predict direction, or guarantee outcomes. It does not account for news events, earnings, implied volatility changes, or broader macro conditions. It is intended as a contextual tool to support disciplined decision-making, not as a standalone trading system.
Always trade smart. Manage position size, define risk before entering a trade, and avoid over-leveraging short-dated options. The objective is not to predict the market, but to consistently align price structure with realistic time expectations.

RSI-RS StrategyRSI-RS Strategy: Smart Trend Following 🚀
Overview
This strategy combines Multi-Timeframe RSI with Mansfield Relative Strength to identify high-momentum breakouts in strong stocks. Unlike standard RSI strategies, it features a "Smart Trailing Stop" that tightens when momentum weakens but respects key RSI 50 support levels to avoid shaking you out of winning trades.
Key Features ✨
1. 🎯 High-Probability Entries
Multi-Confirmations: Requires Monthly RSI > 60 and Weekly RSI > 60 (Trend is Up).
Dual Trigger: Enters on a Daily RSI Breakout (>60) OR a Weekly RSI Catch-up, ensuring you don't miss late moves.
RS Filter: Only buys stocks outperforming the Index (RS > 0).
New Listing Safe: Automatically skips Monthly checks for new IPOs lacking history.
2. 🛡️ Advanced "Hybrid" Stop Loss
This strategy solves the "Wick Out" problem:
Confirmation Exit: If price drops below the Stop Loss, it waits for the Next Candle to confirm the breakdown. It ignores intraday wicks!
Crash Protection: Includes a "Panic Button" (Default 3% buffer). If price crashes rapidly intraday, it exits immediately to save capital.
Smart Trailing: The Stop Loss moves UP when RSI shows weakness (<60), locking in profits.
3. 🧠 Smart Support Buffer
Wait for 50: Uniquely detects when RSI is resting on 50 Support (Zone 50-55).
Patience: It ignores minor weakness signals in this zone, waiting for a bounce instead of exiting prematurely.
4. 🧹 Clean Visuals
Minimalist Labels: Transparent Entry/Exit labels that don't declutter the chart.
Setup Watch: Visually signals "Watch > " before the trade triggers.
Transparency: "SL Update" diamonds prove exactly why the stop moved (showing the RSI value).
Settings Guide ⚙️
Confirmation Window: How many bars the breakout remains valid (Default: 2).
RSI Support Buffer: The "Safe Zone" range above 50 (Default: 5).
Crash Buffer %: Distance below SL for immediate emergency exit (Default: 3.0%).
Visuals: Toggle Setup Labels and SL Diamonds on/off to keep your chart clean.
How to Trade It
Green Background: You are in a trade.
Red Line: Your Hard Stop Loss (Closing Basis).
Maroon Dotted Line: Your Crash Limit (Intraday Danger Zone).
Orange Diamond: Warning! RSI Weakness detected, SL has tightened.
Disclaimer
Backtested on Indian Equities (NSE). Designed for Swing Trading on Daily Timeframe. Always manage your own risk.

SMC + Dual UT Bot buy and sell AlertsMise a jour avec un EMA 20/50 et vwap
his script is a composite indicator for TradingView (Pine Script v5) that merges Smart Money Concepts (SMC) with a Dual-instance UT Bot. It has been styled with a high-contrast "Neon Cyberpunk" theme (Cyan/Pink) and is fully compliant with the CC BY-NC-SA 4.0 license.
Here is a breakdown of its two main components:
1. Smart Money Concepts (SMC)
This portion, originally by LuxAlgo, is designed to identify institutional price levels and structural market shifts. It provides a detailed map of market structure rather than simple entry/exit signals.
Market Structure (BOS & CHoCH):
BOS (Break of Structure): Marks trend continuation (e.g., breaking a higher high in an uptrend).
CHoCH (Change of Character): Marks potential trend reversals (e.g., the first time a higher low is broken in an uptrend).
Order Blocks (OB):
Highlights specific candles where institutional buying or selling likely occurred. These act as high-probability support/resistance zones.
Neon Blue/Cyan for Bullish OBs.
Neon Pink for Bearish OBs.
Fair Value Gaps (FVG):
Identifies imbalances (gaps) in price action where the market often returns to "fill" orders.
Neon Mint for Bullish FVGs.
Neon Red for Bearish FVGs.
Premium/Discount Zones: Automatically plots the range equilibrium (50% level) to help you buy in "Discount" (low) and sell in "Premium" (high) areas.
Liquidity (EQH/EQL): Automatically detects "Equal Highs" and "Equal Lows," which are magnets for price as they represent liquidity pools (stop losses).
2. Dual UT Bot Alerts
This portion provides the actual Entry Signals. It runs two separate instances of the "UT Bot" strategy simultaneously with different sensitivity settings to filter noise.
Instance 1 (Buy Only):
Settings: Key Value = 4, ATR Period = 10 (Faster, more sensitive).
Visual: Plots a Neon Cyan "Buy" label.
Function: Looks for bullish reversals earlier to catch the start of a move.
Instance 2 (Sell Only):
Settings: Key Value = 7, ATR Period = 20 (Slower, smoother).
Visual: Plots a Neon Pink "Sell" label.
Function: Uses a wider ATR band to avoid getting shaken out of shorts too early, focusing on major downtrends.
How to Use It
The strength of this script is confluence.
Wait for a Signal: Look for a UT Bot "Buy" or "Sell" tag.
Confirm with SMC: Check if the signal aligns with SMC concepts.
Example Buy: Did the UT Bot give a "Buy" signal while price was bouncing off a Bullish Order Block?
Example Buy: Did price just sweep Liquidity (EQL) before the Buy signal?
Example Sell: Is the "Sell" signal happening inside a Premium Zone or a Bearish Fair Value Gap?
avant-hier
Notes de version
1. "Pro" Badge Buy/Sell Labels
The standard text signals have been replaced with modern, professional Badge Labels that provide more information at a glance.
Visuals: Instead of simple text, the script now uses label.new to create high-visibility badges.
BUY: A Neon Cyan badge with a Rocket icon (🚀).
SELL: A Neon Pink badge with a Chart icon (📉).
Price Details: Each badge displays the exact Entry Price directly on the label.
Tooltips: If you hover your mouse over a Buy or Sell badge, a tooltip will appear showing the exact Take Profit (TP) and Stop Loss (SL) prices calculated for that trade.
2. Dynamic Take Profit (TP)
The script now automatically calculates a profit target for every trade the moment a signal is generated.
Calculation: It measures the distance between your Entry Price and the initial Stop Loss (the ATR Trailing Stop).
Risk:Reward: It multiplies that distance by your chosen Risk:Reward Ratio (default is 1.5) to project a TP target.
Visual Line: A Green Line is drawn on the chart at the TP level. It remains active until price hits it or the stop loss.
3. Active Trailing Stop Loss (SL)
The Stop Loss is no longer static; it is now "alive" and manages the trade for you.
Trailing Logic: If Use Trailing SL? is enabled (default), the SL line will automatically move up (for longs) or move down (for shorts) as the trend continues in your favor. It locks in profit by following the UT Bot's ATR trailing band.
Visual Line: A Red Line is drawn at the SL level. You can see it physically step up or down on the chart as the trend progresses.
4. Real-Time Trade Simulation
The script now simulates the lifecycle of a trade directly on the chart:
Active State: When a trade is live, the TP and SL lines extend to the right of the current candle (bar_index + 1), showing you exactly where your exit points are in real-time.
Closed State: Once the price hits either the Green TP line or the Red SL line, the script detects the "Exit." The lines stop extending and turn dotted, indicating that the trade is closed and waiting for the next signal.
Summary of New Settings
You will find a new group in the settings panel called "UT Bot: Trade Management":
TP Risk:Reward Ratio: Adjust this to change how far the Green TP line is placed (e.g., set to 2.0 for 2x return).
Use Trailing SL?: Uncheck this if you want the Red SL line to stay fixed at the initial entry risk level.
avant-hier
Notes de version
1. Live Strategy Performance Dashboard (Backtester)
Since this is an indicator, TradingView does not automatically calculate PnL (Profit and Loss). I have built a custom Simulation Engine inside the script that tracks every UT Bot signal as if you had taken the trade.
Location: Bottom Right of your chart.
Win Rate: Displays the percentage of trades that hit the Take Profit target versus the Stop Loss.
Trades (W/L): Shows the total number of signals generated, broken down by Wins and Losses.
Net Profit (R): Calculates your theoretical profit in "R-Multiples" (Risk Units).
Example: If you set your Risk:Reward to 2.0, every win adds +2R, and every loss subtracts -1R.
Dynamic Colors: The Win Rate and Profit cells turn Neon Cyan if positive (>50% or >0R) and Neon Pink if negative.
2. Multi-Timeframe Trend Dashboard
A new panel at the Top Right gives you an instant "Market Bias" reading so you don't have to scan the whole chart.
SMC Trend: Reads the Smart Money structure (Break of Structure/Change of Character) to determine if the high-level timeframe is BULLISH or BEARISH.
UT Bot Status: Displays the current active signal state:
BUY (Active): You are currently in a Long trade.
SELL (Active): You are currently in a Short trade.
NEUTRAL: No active signal or the last trade hit TP/SL.
3. Integrated Alert System
I have connected the visual lines to the alert system. You can now set a single alert on this indicator, and it will trigger for:
Entry Signals: "UT Long Entry" / "UT Short Entry"
Exits: "Take Profit Hit" / "Stop Loss Hit"
4. Consolidated Settings
To make the script easier to manage, I organized the settings into clear groups:
Dashboards: Toggle the visibility of the new panels or move the Performance Panel to a different corner.
UT Bot: Trade Management: Quickly adjust your Risk:Reward Ratio (e.g., change from 1.5 to 2.0) to see how it affects your Win Rate in real-time on the dashboard.
avant-hier
Notes de version
1. Multi-Timeframe (MTF) Trend Scanner
I have replaced the basic "Market Bias" panel with a comprehensive MTF Trend Dashboard located at the Top Right of your chart.
What it tracks: It simultaneously monitors the trend direction on 5 distinct timeframes:
15 Minute
1 Hour
4 Hour
Daily
Weekly
How it works: It runs a background calculation (using UT Bot settings Key=5, ATR=15) on these higher timeframes without you needing to switch charts.
Visuals:
BULLISH: Highlighted in Neon Cyan.
BEARISH: Highlighted in Neon Pink.
2. Strategic Confluence (How to use it)
This new dashboard transforms the script from a simple "signal generator" into a complete trading system by allowing you to filter trades based on the bigger picture.
The "All-Green" Rule: If you are scalping on a 5-minute chart and you get a BUY signal, check the dashboard. If the 1H, 4H, and Daily are all Neon Cyan (Bullish), that trade has a significantly higher probability of success.
Avoid Counter-Trend Trades: If your main chart says BUY, but the dashboard shows the 4H and Daily are Neon Pink (Bearish), you are trading against the major trend. You might want to skip that trade or reduce your risk size.
3. Summary of Dashboards
You now have two professional-grade panels on your screen:
Bottom Right (Performance): Shows the past results of the strategy on your current timeframe (Win Rate, Profit Factor).
Top Right (Trend): Shows the current state of the market across all timeframes.

FlowMaster 4H - Avanced Volume & Pip Analyzer“Visualize market flow like an institutional trader – track buy/sell volume, pip per tick, and candle efficiency in one table.”
“Visualize market flow like an institutional trader – track buy/sell volume, pip per tick, and candle efficiency in one table.”
Short Description (Marketplace-Friendly):
Aggregated 4H candle analysis with buy/sell volume breakdown.
Pip/Tick calculation with weighted averages for smarter entry/exit signals.
Compare current candle volume to previous candle and 20-bar average.
All key metrics in a compact, easy-to-read table below the chart.
Ideal for Forex swing & position traders seeking institutional-style insights directly in TradingView.
Long Description / Full Product Info:
FlowMaster 4H is a professional-grade trading indicator designed to provide quantitative order flow analysis on Forex markets using 4-hour candles. By aggregating volume data, tick information, and pip movements, FlowMaster gives traders a unique perspective on market dynamics typically reserved for institutional participants.
Key Features:
Volume Relative Metrics: Compare the current candle volume to the previous candle and to the average of the last 20 candles.
Pip/Tick Analysis: Calculates pip per tick using a scaled price approach, giving insights into the efficiency of price moves.
Weighted Pip/Tick Averages: Tracks volume-weighted pip/tick over the last 20 candles for both buyers and sellers.
Percentage Metrics: Visualize the proportion of buy and sell volume relative to total ticks, helping identify absorption and impulse movements.
User-Friendly Table: All key indicators displayed in a compact, easy-to-read table below the chart.
Why use FlowMaster 4H:
Identify market absorption and impulse using reliable volume and pip metrics.
Optimize trade entry and exit decisions based on quantitative order flow data.
Works directly in TradingView, offering a professional order flow view without needing access to Level 2 order book data.
Pioneering approach in aggregating 4H candle data with detailed pip/tick insights.
Ideal For: Swing and position traders, Forex traders seeking institutional-style volume analysis, and anyone looking to improve order flow reasoning using TradingView.

PropKorea US10Y Monitor for NQPropKorea US10Y Monitor for NQ
Overview This indicator is specifically designed for Nasdaq (NQ) day traders and scalpers. It visualizes the real-time fluctuations of the US 10-Year Treasury Yield (US10Y), which historically has a strong Inverse Correlation with tech stocks.
By monitoring the US10Y yield in real-time, traders can gauge the macro pressure on the Nasdaq. This script features a Smart Smoothing Algorithm to filter out tick noise on lower timeframes (e.g., 1-minute chart) and uses a "Neon" visual effect to intuitively display market sentiment (Risk On/Off).
Key Features
Neon Trend Signals (Risk Gauge)
🔴 Red Zone: Yield is UP vs. Previous Close (Bearish pressure on NQ → Short Bias).
🟢 Green Zone: Yield is DOWN vs. Previous Close (Bullish pressure on NQ → Long Bias).
⚪ Gray (Neutral): Trend is reversing or consolidating (Wait or Exit signal).
Smart Smoothing (Noise Filter)
Apply a customizable Moving Average filter to ignore minor tick whipsaws on 1-minute charts.
Adjust the Smoothing Strength in settings to fit your trading style.
1:1 Candle Matching (Dot Style)
Supports "Line + Dots" style to align yield data points perfectly with NQ candles for precise timing.
Session Filter
The Neon effect activates only during the main NY Session (08:30 – 17:00 EST) to focus on high-liquidity hours.
How to Use
Add this indicator to a separate pane below your NQ chart.
Short Setup: If the background/line is Red, look for Short opportunities when NQ bounces.
Long Setup: If the background/line is Green, look for Long opportunities when NQ dips.
Caution: If the color turns Gray, the yield trend is losing momentum. Consider tightening stops or waiting.
Disclaimer This tool is for informational purposes only and does not guarantee profits. Please be aware that markets can decouple from yields during major news events (e.g., Earnings surprises).
개요 (Overview) 이 지표는 나스닥(NQ) 데이 트레이더와 스캘퍼를 위해 제작되었습니다. 기술주와 강력한 **역상관 관계(Inverse Correlation)**를 가지는 **미국 10년물 국채 금리(US10Y)**의 실시간 변동을 시각화하여 트레이딩에 도움을 줍니다.
1분봉 이하의 빠른 스캘핑 환경에서도 틱 노이즈(Noise)에 속지 않도록 스마트 스무딩(Smart Smoothing) 알고리즘이 적용되어 있으며, 네온(Neon) 효과를 통해 현재 시장의 분위기(Risk On/Off)를 직관적으로 파악할 수 있습니다.
핵심 기능 (Key Features)
네온 트렌드 신호 (Neon Trend)
🔴 레드존 (Red Zone): 전일 대비 금리 상승 중 (나스닥 하방 압력 → 매도 우위)
🟢 그린존 (Green Zone): 전일 대비 금리 하락 중 (나스닥 상방 압력 → 매수 우위)
⚪ 회색 (Gray): 추세 반전 또는 횡보 구간 (관망 또는 청산 신호)
스마트 스무딩 (노이즈 제거)
이동평균 필터를 적용하여 1분봉 차트에서의 자잘한 틱 튀김 현상을 걸러냅니다.
설정에서 노이즈 제거 강도를 조절하여 본인의 스타일에 맞게 튜닝할 수 있습니다.
1:1 캔들 매칭 (Dot Style)
"Line + Dots" 스타일을 지원하여 나스닥 캔들과 금리 데이터를 1:1로 매칭해 정확한 타점을 볼 수 있습니다.
세션 필터 (Session Filter)
유동성이 풍부한 뉴욕 본장(08:30~17:00 EST) 시간에만 네온 효과가 켜지고, 그 외 시간에는 눈의 피로를 줄이기 위해 차분한 회색으로 전환됩니다.
사용 가이드 (How to Use)
NQ 차트 하단 패널에 이 지표를 추가하십시오.
매도 진입: 배경과 선이 붉은색일 때, 나스닥이 반등하면 매도 포지션 진입을 고려합니다.
매수 진입: 배경과 선이 초록색일 때, 나스닥이 눌림목을 주면 매수 포지션 진입을 고려합니다.
주의: 선명하던 색상이 회색으로 변하면 금리 추세가 멈추거나 반전되고 있다는 신호이므로 주의가 필요합니다.
주의 사항 (Disclaimer) 본 지표는 보조 도구일 뿐이며 절대적인 수익을 보장하지 않습니다. 강력한 개별 호재(실적 발표 등)가 있는 날에는 금리와 디커플링(Decoupling) 될 수 있음을 유의하십시오.
Developed by PropKorea

MATATABI SP Ver.1Specifications & Features
This indicator is a comprehensive tool designed to monitor trend inception (Squeeze), key reversal zones (Smart SR), and market context (Range Analysis) on a single chart. It is updated for Pine Script v6.
1. 10 Moving Averages (MA)
Spec: Displays a total of 10 Moving Averages.
Defaults: All set to EMA (Exponential Moving Average) with periods 20, 25, 30, 35, 40, 45, 50, 55, 60, 65 (increments of 5).
Customization: Period, type (SMA, EMA, SMMA, WMA), color, and width for each line can be adjusted in the settings.
Visibility: MA01-MA08 are visible by default; MA09-MA10 are hidden by default.
2. MA Squeeze Detection Alert
Feature: Detects when all 10 MAs contract (cluster together) and flatten out, indicating potential energy buildup for a move.
Behavior: No background color change on the chart; it functions purely as an Alert condition configurable in TradingView.
Logic: Triggered when the spread between the highest and lowest MA is below a specific ATR threshold AND the slope of the longest MA is near zero.
3. Smart Support & Resistance (Smart SR)
Zone Display: Draws Support/Resistance as zones (bands) rather than thin lines. The width adapts automatically based on volatility (ATR).
Auto-Removal on Break: When price breaks through a zone, the line stops extending to the right automatically. This ensures only currently active/unbroken levels remain visible on the chart.
Significance Filter: Filters out minor noise, using a longer Pivot length (15) to identify only significant peaks and troughs. It also prevents drawing duplicate zones near existing ones.
Multi-Timeframe (MTF): Can display SR zones from a higher timeframe (e.g., 4H SR on a 15m chart) alongside current timeframe zones.
4. Range Analysis
Range Detection: Visualizes consolidation areas (boxes) based on price deviation and volume analysis.
Info Dashboard: Displays a table (top-right) showing the range strength and a statistical "Directional Probability (Bullish/Bearish %)" for the potential breakout.
Breakout Signals: Highlights the box border and triggers alerts when price breaks out of the detected range.
仕様と特徴
このインジケーターは、トレンドの初動(スクイーズ)、重要な反発ポイント(レジサポ)、**現在の相場環境(レンジ解析)**を1つのチャートで監視するための複合ツールです。Pine Script v6に対応しています。
1. 10本の移動平均線 (MA)
仕様: 合計10本の移動平均線を表示します。
初期設定: すべて**EMA(指数平滑移動平均線)**で、期間は 20, 25, 30, 35, 40, 45, 50, 55, 60, 65(5刻み)に設定されています。
カスタマイズ: 各ラインの期間、種類(SMA, EMA, SMMA, WMA)、色、太さは設定画面から変更可能です。
表示制御: MA01〜MA08はデフォルトで表示、MA09〜MA10は非表示設定です。
2. MA収縮(スクイーズ)検知アラート
特徴: 10本のMAが密集し、かつ傾きが平坦になった状態(エネルギーが溜まっている状態)を検知します。
動作: チャートの背景色は変更せず、アラート通知のみを行う仕様です(設定画面でアラート条件を作成可能)。
判定ロジック: 「MA全体の最大幅がATRの一定倍率以下」かつ「長期MAの傾きがほぼゼロ」の場合に検知します。
3. スマート・レジサポ (Smart Support & Resistance)
ゾーン表示: 単なる線ではなく、価格帯(ゾーン)として描画されます。幅はボラティリティ(ATR)に基づいて自動調整されます。
ブレイクで自動消去: 価格がゾーンを実体でブレイク(上抜け/下抜け)すると、そのラインは「役割を終えた」と判断され、右側への延長が自動的に停止します。これにより、チャート上には「現在有効なレジサポ」のみが残ります。
重要度フィルター: 小さな値動きを除外し、目立つ山や谷(Pivot期間15)のみを抽出して描画します。また、既存のラインと近い場合は重複して描画しません。
マルチタイムフレーム (MTF): 現在足のレジサポに加え、上位足(例: 15分足チャートに4時間足のレジサポ)を同時に表示可能です。
4. レンジ解析 (Range Analyzer)
レンジ検出: 価格の乱高下と出来高を分析し、レンジ相場をボックスで可視化します。
情報テーブル: チャート右上に、レンジの強度や、過去の統計に基づいた**「ブレイク方向の確率(強気/弱気 %)」**を表示します。
ブレイクアウト: レンジを抜けた際に、ボックスの色を変化させ、アラートを通知します。

Institutional Confluence Mapper [JOAT]Institutional Confluence Mapper (ICM)
Introduction
The Institutional Confluence Mapper is an open-source multi-factor analysis tool that combines five analytical modules into a unified confluence scoring system. It synthesizes institutional trading concepts including Relative Rotation analysis, Smart Money flow detection, Liquidity zone mapping, Session-based timing, and Volatility regime classification.
Rather than relying on a single indicator, ICM evaluates market conditions through multiple lenses simultaneously, presenting a clear confluence score (0-100%) that reflects the alignment of various market factors.
This script is fully open-source under the Mozilla Public License 2.0.
Originality and Purpose
This indicator is NOT a random mashup of existing indicators. It is an original implementation that creates a unified institutional analysis framework:
Why Multiple Modules? Most retail traders struggle because they rely on single indicators that provide conflicting signals. Institutional traders evaluate markets through multiple frameworks simultaneously. ICM bridges this gap by providing a unified view of complementary analysis methods.
The Confluence Scoring System: Each module contributes to a weighted confluence score (0-100%). Scores above 65% indicate bullish confluence; below 35% indicates bearish confluence.
How Components Work Together:
RRG (Relative Rotation) determines macro bias - is this asset outperforming or underperforming its benchmark?
Institutional Flow confirms smart money activity - are institutions accumulating or distributing?
Volatility Regime determines strategy selection - trend-follow or mean-revert?
Liquidity Detection identifies key levels - where are the stop hunts happening?
Session Analysis optimizes timing - when should you trade?
The Five Core Modules
1. Relative Rotation Momentum Matrix (RRG)
Compares the current symbol against a benchmark (default: SPY) using the JdK RS-Ratio methodology with double-smoothed EMA. Assets rotate through four quadrants:
LEADING: Outperforming with positive momentum (strongest bullish)
WEAKENING: Outperforming but losing momentum
LAGGING: Underperforming with negative momentum (strongest bearish)
IMPROVING: Underperforming but gaining momentum
2. Institutional Flow Analysis
Analyzes volume patterns to detect smart money activity:
Volume Z-Score measures how unusual current volume is
Buy/Sell pressure estimation based on candle structure
Unusual volume detection highlights institutional activity
3. Volatility Regime System
Uses ATR percentile ranking to classify market conditions:
COMPRESSION: Low volatility (ATR < 20th percentile) - potential breakout
EXPANSION: High volatility (ATR > 80th percentile) - trending
TRENDING_BULL/BEAR: Directional trends based on EMA alignment
RANGING: Sideways consolidation
4. Liquidity Detection
Identifies institutional liquidity targets using swing point analysis:
Swing highs/lows are tracked and displayed as dashed lines
Purple dashed lines mark resistance/sell-side liquidity
Teal dashed lines mark support/buy-side liquidity
Gold diamonds appear when liquidity sweeps are detected (potential reversals)
5. Session Momentum Profiler
Tracks trading sessions based on your selected timezone:
Asian Session: 7PM - 4AM EST
London Session: 3AM - 12PM EST
New York Session: 9:30AM - 4PM EST
London/NY Overlap: 8AM - 12PM EST (peak liquidity)
Visual Elements
Main Dashboard (Top-Right):
BIAS: Overall direction with confluence percentage
RRG: Current quadrant and momentum
FLOW: Smart money bias and volume status
REGIME: Market condition and volatility percentile
SESSION: Active trading session and current time
LIQUIDITY: Active zones and grab signals
SIGNAL: Actionable recommendation
Chart Elements:
Gold Diamond: Liquidity grab (potential reversal point)
Teal Dashed Line: Support / Buy-side liquidity zone
Purple Dashed Line: Resistance / Sell-side liquidity zone
EMA 21/55/200: Trend structure with cloud fill
Volatility Bands: ATR-based channels
How to Use
Step 1: Check the BIAS row for overall market direction
Step 2: Check REGIME to understand market conditions
Step 3: Identify key levels using liquidity zones and EMAs
Step 4: Wait for confluence above 65% (bullish) or below 35% (bearish)
Step 5: Look for gold diamond signals at key levels
Best Setups
Bullish: Confluence >65%, RRG in LEADING/IMPROVING, bullish flow, price near teal support zone.
Bearish: Confluence <35%, RRG in LAGGING/WEAKENING, bearish flow, price near purple resistance zone.
Reversal: Gold diamond appears after price sweeps a liquidity zone.
Key Input Parameters
Benchmark Symbol: Compare against (default: SPY)
RS-Ratio/Momentum Lookback: RRG calculation periods
Volume Analysis Period: Flow detection lookback
Swing Length: Liquidity zone detection
ATR Period/Rank Period: Regime classification
Timezone: Session detection timezone
Alerts
Liquidity Grab Bull: Bullish sweep detected
Liquidity Grab Bear: Bearish sweep detected
High Confluence Bull: Confluence above 70%
High Confluence Bear: Confluence below 30%
Best Practices
Use on 1H, 4H, or Daily timeframes for reliable signals
Combine with price action for confirmation
Respect the regime - don't fight strong trends
Trade during London/NY overlap for best liquidity
Wait for high confluence scores before entering
Always use proper risk management
Limitations
Works best on liquid markets with sufficient volume
Session features optimized for forex/crypto markets
RRG requires a valid benchmark symbol
No indicator predicts the future - use proper risk management
Disclaimer
This indicator is for educational and informational purposes only. It is not financial advice. Trading involves substantial risk of loss. Past performance does not guarantee future results.
-Made with passion by officialjackofalltrades

Premium Money Flow Oscillator [NeuraAlgo]Premium Money Flow Oscillator (PMFO) — NeuraAlgo
The Premium Money Flow Oscillator (PMFO) is an advanced volume-weighted momentum engine designed to reveal true capital flow, not just price movement.
It combines multi-layer smoothing, zero-lag correction, and dynamic normalization to deliver a clean, responsive, and noise-resistant money flow signal suitable for both scalping and swing trading.
Unlike traditional oscillators, PMFO focuses on pressure behind price — showing when smart money accumulation or distribution is actively occurring.
🔹 Core Features
Volume-Weighted Money Flow
Measures real buying and selling pressure using price displacement × volume.
Filters out weak price moves with low participation.
Multi-Layer Smoothing Engine
EMA + SMA hybrid base smoothing
Gaussian noise reduction
Zero-Lag correction
Deep & Super smoothing layers
→ Result: ultra-smooth yet fast reaction to momentum shifts.
Dynamic Normalization
Automatically adapts to volatility.
Keeps signals consistent across all markets and timeframes.
🔹 Smart Zones & Visual Intelligence
Dynamic Overbought / Oversold Zones
Zones strengthen visually as momentum increases.
Strong zones highlight extreme institutional pressure.
Adaptive Gradient Coloring
Color intensity reflects money flow strength.
Instantly see dominance without reading numbers.
Background Pulse
Subtle market bias feedback (bullish / bearish pressure).
🔹 Multi-Timeframe Confirmation
Optional Higher Timeframe Money Flow Confirmation
Align lower-timeframe entries with higher-timeframe capital direction.
Ideal for trend validation and false-signal reduction.
🔹 Professional Dashboard
Live Money Flow Value
Market Flow State
Strength Percentage
MTF Trend Bias
Institutional-style status readout designed for quick decision making.
🔹 Best Use Cases
✔ Trend confirmation
✔ Momentum continuation entries
✔ Reversal exhaustion detection
✔ Divergence analysis
✔ Smart money flow tracking
⚠️ Notes
PMFO works best when combined with price structure, support/resistance, or trend context.
Extreme readings indicate pressure, not immediate reversal — always wait for confirmation.
Designed for traders who want clarity, not clutter.
Built for precision, not lag.

Adaptive Market Wave TheoryAdaptive Market Wave Theory
🌊 CORE INNOVATION: PROBABILISTIC PHASE DETECTION WITH MULTI-AGENT CONSENSUS
Adaptive Market Wave Theory (AMWT) represents a fundamental paradigm shift in how traders approach market phase identification. Rather than counting waves subjectively or drawing static breakout levels, AMWT treats the market as a hidden state machine —using Hidden Markov Models, multi-agent consensus systems, and reinforcement learning algorithms to quantify what traditional methods leave to interpretation.
The Wave Analysis Problem:
Traditional wave counting methodologies (Elliott Wave, harmonic patterns, ABC corrections) share fatal weaknesses that AMWT directly addresses:
1. Non-Falsifiability : Invalid wave counts can always be "recounted" or "adjusted." If your Wave 3 fails, it becomes "Wave 3 of a larger degree" or "actually Wave C." There's no objective failure condition.
2. Observer Bias : Two expert wave analysts examining the same chart routinely reach different conclusions. This isn't a feature—it's a fundamental methodology flaw.
3. No Confidence Measure : Traditional analysis says "This IS Wave 3." But with what probability? 51%? 95%? The binary nature prevents proper position sizing and risk management.
4. Static Rules : Fixed Fibonacci ratios and wave guidelines cannot adapt to changing market regimes. What worked in 2019 may fail in 2024.
5. No Accountability : Wave methodologies rarely track their own performance. There's no feedback loop to improve.
The AMWT Solution:
AMWT addresses each limitation through rigorous mathematical frameworks borrowed from speech recognition, machine learning, and reinforcement learning:
• Non-Falsifiability → Hard Invalidation : Wave hypotheses die permanently when price violates calculated invalidation levels. No recounting allowed.
• Observer Bias → Multi-Agent Consensus : Three independent analytical agents must agree. Single-methodology bias is eliminated.
• No Confidence → Probabilistic States : Every market state has a calculated probability from Hidden Markov Model inference. "72% probability of impulse state" replaces "This is Wave 3."
• Static Rules → Adaptive Learning : Thompson Sampling multi-armed bandits learn which agents perform best in current conditions. The system adapts in real-time.
• No Accountability → Performance Tracking : Comprehensive statistics track every signal's outcome. The system knows its own performance.
The Core Insight:
"Traditional wave analysis asks 'What count is this?' AMWT asks 'What is the probability we are in an impulsive state, with what confidence, confirmed by how many independent methodologies, and anchored to what liquidity event?'"
🔬 THEORETICAL FOUNDATION: HIDDEN MARKOV MODELS
Why Hidden Markov Models?
Markets exist in hidden states that we cannot directly observe—only their effects on price are visible. When the market is in an "impulse up" state, we see rising prices, expanding volume, and trending indicators. But we don't observe the state itself—we infer it from observables.
This is precisely the problem Hidden Markov Models (HMMs) solve. Originally developed for speech recognition (inferring words from sound waves), HMMs excel at estimating hidden states from noisy observations.
HMM Components:
1. Hidden States (S) : The unobservable market conditions
2. Observations (O) : What we can measure (price, volume, indicators)
3. Transition Matrix (A) : Probability of moving between states
4. Emission Matrix (B) : Probability of observations given each state
5. Initial Distribution (π) : Starting state probabilities
AMWT's Six Market States:
State 0: IMPULSE_UP
• Definition: Strong bullish momentum with high participation
• Observable Signatures: Rising prices, expanding volume, RSI >60, price above upper Bollinger Band, MACD histogram positive and rising
• Typical Duration: 5-20 bars depending on timeframe
• What It Means: Institutional buying pressure, trend acceleration phase
State 1: IMPULSE_DN
• Definition: Strong bearish momentum with high participation
• Observable Signatures: Falling prices, expanding volume, RSI <40, price below lower Bollinger Band, MACD histogram negative and falling
• Typical Duration: 5-20 bars (often shorter than bullish impulses—markets fall faster)
• What It Means: Institutional selling pressure, panic or distribution acceleration
State 2: CORRECTION
• Definition: Counter-trend consolidation with declining momentum
• Observable Signatures: Sideways or mild counter-trend movement, contracting volume, RSI returning toward 50, Bollinger Bands narrowing
• Typical Duration: 8-30 bars
• What It Means: Profit-taking, digestion of prior move, potential accumulation for next leg
State 3: ACCUMULATION
• Definition: Base-building near lows where informed participants absorb supply
• Observable Signatures: Price near recent lows but not making new lows, volume spikes on up bars, RSI showing positive divergence, tight range
• Typical Duration: 15-50 bars
• What It Means: Smart money buying from weak hands, preparing for markup phase
State 4: DISTRIBUTION
• Definition: Top-forming near highs where informed participants distribute holdings
• Observable Signatures: Price near recent highs but struggling to advance, volume spikes on down bars, RSI showing negative divergence, widening range
• Typical Duration: 15-50 bars
• What It Means: Smart money selling to late buyers, preparing for markdown phase
State 5: TRANSITION
• Definition: Regime change period with mixed signals and elevated uncertainty
• Observable Signatures: Conflicting indicators, whipsaw price action, no clear momentum, high volatility without direction
• Typical Duration: 5-15 bars
• What It Means: Market deciding next direction, dangerous for directional trades
The Transition Matrix:
The transition matrix A captures the probability of moving from one state to another. AMWT initializes with empirically-derived values then updates online:
From/To IMP_UP IMP_DN CORR ACCUM DIST TRANS
IMP_UP 0.70 0.02 0.20 0.02 0.04 0.02
IMP_DN 0.02 0.70 0.20 0.04 0.02 0.02
CORR 0.15 0.15 0.50 0.10 0.10 0.00
ACCUM 0.30 0.05 0.15 0.40 0.05 0.05
DIST 0.05 0.30 0.15 0.05 0.40 0.05
TRANS 0.20 0.20 0.20 0.15 0.15 0.10
Key Insights from Transition Probabilities:
• Impulse states are sticky (70% self-transition): Once trending, markets tend to continue
• Corrections can transition to either impulse direction (15% each): The next move after correction is uncertain
• Accumulation strongly favors IMP_UP transition (30%): Base-building leads to rallies
• Distribution strongly favors IMP_DN transition (30%): Topping leads to declines
The Viterbi Algorithm:
Given a sequence of observations, how do we find the most likely state sequence? This is the Viterbi algorithm—dynamic programming to find the optimal path through the state space.
Mathematical Formulation:
δ_t(j) = max_i × B_j(O_t)
Where:
δ_t(j) = probability of most likely path ending in state j at time t
A_ij = transition probability from state i to state j
B_j(O_t) = emission probability of observation O_t given state j
AMWT Implementation:
AMWT runs Viterbi over a rolling window (default 50 bars), computing the most likely state sequence and extracting:
• Current state estimate
• State confidence (probability of current state vs alternatives)
• State sequence for pattern detection
Online Learning (Baum-Welch Adaptation):
Unlike static HMMs, AMWT continuously updates its transition and emission matrices based on observed market behavior:
f_onlineUpdateHMM(prev_state, curr_state, observation, decay) =>
// Update transition matrix
A *= decay
A += (1.0 - decay)
// Renormalize row
// Update emission matrix
B *= decay
B += (1.0 - decay)
// Renormalize row
The decay parameter (default 0.85) controls adaptation speed:
• Higher decay (0.95): Slower adaptation, more stable, better for consistent markets
• Lower decay (0.80): Faster adaptation, more reactive, better for regime changes
Why This Matters for Trading:
Traditional indicators give you a number (RSI = 72). AMWT gives you a probabilistic state assessment :
"There is a 78% probability we are in IMPULSE_UP state, with 15% probability of CORRECTION and 7% distributed among other states. The transition matrix suggests 70% chance of remaining in IMPULSE_UP next bar, 20% chance of transitioning to CORRECTION."
This enables:
• Position sizing by confidence : 90% confidence = full size; 60% confidence = half size
• Risk management by transition probability : High correction probability = tighten stops
• Strategy selection by state : IMPULSE = trend-follow; CORRECTION = wait; ACCUMULATION = scale in
🎰 THE 3-BANDIT CONSENSUS SYSTEM
The Multi-Agent Philosophy:
No single analytical methodology works in all market conditions. Trend-following excels in trending markets but gets chopped in ranges. Mean-reversion excels in ranges but gets crushed in trends. Structure-based analysis works when structure is clear but fails in chaotic markets.
AMWT's solution: employ three independent agents , each analyzing the market from a different perspective, then use Thompson Sampling to learn which agents perform best in current conditions.
Agent 1: TREND AGENT
Philosophy : Markets trend. Follow the trend until it ends.
Analytical Components:
• EMA Alignment: EMA8 > EMA21 > EMA50 (bullish) or inverse (bearish)
• MACD Histogram: Direction and rate of change
• Price Momentum: Close relative to ATR-normalized movement
• VWAP Position: Price above/below volume-weighted average price
Signal Generation:
Strong Bull: EMA aligned bull AND MACD histogram > 0 AND momentum > 0.3 AND close > VWAP
→ Signal: +1 (Long), Confidence: 0.75 + |momentum| × 0.4
Moderate Bull: EMA stack bull AND MACD rising AND momentum > 0.1
→ Signal: +1 (Long), Confidence: 0.65 + |momentum| × 0.3
Strong Bear: EMA aligned bear AND MACD histogram < 0 AND momentum < -0.3 AND close < VWAP
→ Signal: -1 (Short), Confidence: 0.75 + |momentum| × 0.4
Moderate Bear: EMA stack bear AND MACD falling AND momentum < -0.1
→ Signal: -1 (Short), Confidence: 0.65 + |momentum| × 0.3
When Trend Agent Excels:
• Trend days (IB extension >1.5x)
• Post-breakout continuation
• Institutional accumulation/distribution phases
When Trend Agent Fails:
• Range-bound markets (ADX <20)
• Chop zones after volatility spikes
• Reversal days at major levels
Agent 2: REVERSION AGENT
Philosophy: Markets revert to mean. Extreme readings reverse.
Analytical Components:
• Bollinger Band Position: Distance from bands, percent B
• RSI Extremes: Overbought (>70) and oversold (<30)
• Stochastic: %K/%D crossovers at extremes
• Band Squeeze: Bollinger Band width contraction
Signal Generation:
Oversold Bounce: BB %B < 0.20 AND RSI < 35 AND Stochastic < 25
→ Signal: +1 (Long), Confidence: 0.70 + (30 - RSI) × 0.01
Overbought Fade: BB %B > 0.80 AND RSI > 65 AND Stochastic > 75
→ Signal: -1 (Short), Confidence: 0.70 + (RSI - 70) × 0.01
Squeeze Fire Bull: Band squeeze ending AND close > upper band
→ Signal: +1 (Long), Confidence: 0.65
Squeeze Fire Bear: Band squeeze ending AND close < lower band
→ Signal: -1 (Short), Confidence: 0.65
When Reversion Agent Excels:
• Rotation days (price stays within IB)
• Range-bound consolidation
• After extended moves without pullback
When Reversion Agent Fails:
• Strong trend days (RSI can stay overbought for days)
• Breakout moves
• News-driven directional moves
Agent 3: STRUCTURE AGENT
Philosophy: Market structure reveals institutional intent. Follow the smart money.
Analytical Components:
• Break of Structure (BOS): Price breaks prior swing high/low
• Change of Character (CHOCH): First break against prevailing trend
• Higher Highs/Higher Lows: Bullish structure
• Lower Highs/Lower Lows: Bearish structure
• Liquidity Sweeps: Stop runs that reverse
Signal Generation:
BOS Bull: Price breaks above prior swing high with momentum
→ Signal: +1 (Long), Confidence: 0.70 + structure_strength × 0.2
CHOCH Bull: First higher low after downtrend, breaking structure
→ Signal: +1 (Long), Confidence: 0.75
BOS Bear: Price breaks below prior swing low with momentum
→ Signal: -1 (Short), Confidence: 0.70 + structure_strength × 0.2
CHOCH Bear: First lower high after uptrend, breaking structure
→ Signal: -1 (Short), Confidence: 0.75
Liquidity Sweep Long: Price sweeps below swing low then reverses strongly
→ Signal: +1 (Long), Confidence: 0.80
Liquidity Sweep Short: Price sweeps above swing high then reverses strongly
→ Signal: -1 (Short), Confidence: 0.80
When Structure Agent Excels:
• After liquidity grabs (stop runs)
• At major swing points
• During institutional accumulation/distribution
When Structure Agent Fails:
• Choppy, structureless markets
• During news events (structure becomes noise)
• Very low timeframes (noise overwhelms structure)
Thompson Sampling: The Bandit Algorithm
With three agents giving potentially different signals, how do we decide which to trust? This is the multi-armed bandit problem —balancing exploitation (using what works) with exploration (testing alternatives).
Thompson Sampling Solution:
Each agent maintains a Beta distribution representing its success/failure history:
Agent success rate modeled as Beta(α, β)
Where:
α = number of successful signals + 1
β = number of failed signals + 1
On Each Bar:
1. Sample from each agent's Beta distribution
2. Weight agent signals by sampled probabilities
3. Combine weighted signals into consensus
4. Update α/β based on trade outcomes
Mathematical Implementation:
// Beta sampling via Gamma ratio method
f_beta_sample(alpha, beta) =>
g1 = f_gamma_sample(alpha)
g2 = f_gamma_sample(beta)
g1 / (g1 + g2)
// Thompson Sampling selection
for each agent:
sampled_prob = f_beta_sample(agent.alpha, agent.beta)
weight = sampled_prob / sum(all_sampled_probs)
consensus += agent.signal × agent.confidence × weight
Why Thompson Sampling?
• Automatic Exploration : Agents with few samples get occasional chances (high variance in Beta distribution)
• Bayesian Optimal : Mathematically proven optimal solution to exploration-exploitation tradeoff
• Uncertainty-Aware : Small sample size = more exploration; large sample size = more exploitation
• Self-Correcting : Poor performers naturally get lower weights over time
Example Evolution:
Day 1 (Initial):
Trend Agent: Beta(1,1) → samples ~0.50 (high uncertainty)
Reversion Agent: Beta(1,1) → samples ~0.50 (high uncertainty)
Structure Agent: Beta(1,1) → samples ~0.50 (high uncertainty)
After 50 Signals:
Trend Agent: Beta(28,23) → samples ~0.55 (moderate confidence)
Reversion Agent: Beta(18,33) → samples ~0.35 (underperforming)
Structure Agent: Beta(32,19) → samples ~0.63 (outperforming)
Result: Structure Agent now receives highest weight in consensus
Consensus Requirements by Mode:
Aggressive Mode:
• Minimum 1/3 agents agreeing
• Consensus threshold: 45%
• Use case: More signals, higher risk tolerance
Balanced Mode:
• Minimum 2/3 agents agreeing
• Consensus threshold: 55%
• Use case: Standard trading
Conservative Mode:
• Minimum 2/3 agents agreeing
• Consensus threshold: 65%
• Use case: Higher quality, fewer signals
Institutional Mode:
• Minimum 2/3 agents agreeing
• Consensus threshold: 75%
• Additional: Session quality >0.65, mode adjustment +0.10
• Use case: Highest quality signals only
🌀 INTELLIGENT CHOP DETECTION ENGINE
The Chop Problem:
Most trading losses occur not from being wrong about direction, but from trading in conditions where direction doesn't exist . Choppy, range-bound markets generate false signals from every methodology—trend-following, mean-reversion, and structure-based alike.
AMWT's chop detection engine identifies these low-probability environments before signals fire, preventing the most damaging trades.
Five-Factor Chop Analysis:
Factor 1: ADX Component (25% weight)
ADX (Average Directional Index) measures trend strength regardless of direction.
ADX < 15: Very weak trend (high chop score)
ADX 15-20: Weak trend (moderate chop score)
ADX 20-25: Developing trend (low chop score)
ADX > 25: Strong trend (minimal chop score)
adx_chop = (i_adxThreshold - adx_val) / i_adxThreshold × 100
Why ADX Works: ADX synthesizes +DI and -DI movements. Low ADX means price is moving but not directionally—the definition of chop.
Factor 2: Choppiness Index (25% weight)
The Choppiness Index measures price efficiency using the ratio of ATR sum to price range:
CI = 100 × LOG10(SUM(ATR, n) / (Highest - Lowest)) / LOG10(n)
CI > 61.8: Choppy (range-bound, inefficient movement)
CI < 38.2: Trending (directional, efficient movement)
CI 38.2-61.8: Transitional
chop_idx_score = (ci_val - 38.2) / (61.8 - 38.2) × 100
Why Choppiness Index Works: In trending markets, price covers distance efficiently (low ATR sum relative to range). In choppy markets, price oscillates wildly but goes nowhere (high ATR sum relative to range).
Factor 3: Range Compression (20% weight)
Compares recent range to longer-term range, detecting volatility squeezes:
recent_range = Highest(20) - Lowest(20)
longer_range = Highest(50) - Lowest(50)
compression = 1 - (recent_range / longer_range)
compression > 0.5: Strong squeeze (potential breakout imminent)
compression < 0.2: No compression (normal volatility)
range_compression_score = compression × 100
Why Range Compression Matters: Compression precedes expansion. High compression = market coiling, preparing for move. Signals during compression often fail because the breakout hasn't occurred yet.
Factor 4: Channel Position (15% weight)
Tracks price position within the macro channel:
channel_position = (close - channel_low) / (channel_high - channel_low)
position 0.4-0.6: Center of channel (indecision zone)
position <0.2 or >0.8: Near extremes (potential reversal or breakout)
channel_chop = abs(0.5 - channel_position) < 0.15 ? high_score : low_score
Why Channel Position Matters: Price in the middle of a range is in "no man's land"—equally likely to go either direction. Signals in the channel center have lower probability.
Factor 5: Volume Quality (15% weight)
Assesses volume relative to average:
vol_ratio = volume / SMA(volume, 20)
vol_ratio < 0.7: Low volume (lack of conviction)
vol_ratio 0.7-1.3: Normal volume
vol_ratio > 1.3: High volume (conviction present)
volume_chop = vol_ratio < 0.8 ? (1 - vol_ratio) × 100 : 0
Why Volume Quality Matters: Low volume moves lack institutional participation. These moves are more likely to reverse or stall.
Combined Chop Intensity:
chopIntensity = (adx_chop × 0.25) + (chop_idx_score × 0.25) +
(range_compression_score × 0.20) + (channel_chop × 0.15) +
(volume_chop × i_volumeChopWeight × 0.15)
Regime Classifications:
Based on chop intensity and component analysis:
• Strong Trend (0-20%): ADX >30, clear directional momentum, trade aggressively
• Trending (20-35%): ADX >20, moderate directional bias, trade normally
• Transitioning (35-50%): Mixed signals, regime change possible, reduce size
• Mid-Range (50-60%): Price trapped in channel center, avoid new positions
• Ranging (60-70%): Low ADX, price oscillating within bounds, fade extremes only
• Compression (70-80%): Volatility squeeze, expansion imminent, wait for breakout
• Strong Chop (80-100%): Multiple chop factors aligned, avoid trading entirely
Signal Suppression:
When chop intensity exceeds the configurable threshold (default 80%), signals are suppressed entirely. The dashboard displays "⚠️ CHOP ZONE" with the current regime classification.
Chop Box Visualization:
When chop is detected, AMWT draws a semi-transparent box on the chart showing the chop zone. This visual reminder helps traders avoid entering positions during unfavorable conditions.
💧 LIQUIDITY ANCHORING SYSTEM
The Liquidity Concept:
Markets move from liquidity pool to liquidity pool. Stop losses cluster at predictable locations—below swing lows (buy stops become sell orders when triggered) and above swing highs (sell stops become buy orders when triggered). Institutions know where these clusters are and often engineer moves to trigger them before reversing.
AMWT identifies and tracks these liquidity events, using them as anchors for signal confidence.
Liquidity Event Types:
Type 1: Volume Spikes
Definition: Volume > SMA(volume, 20) × i_volThreshold (default 2.8x)
Interpretation: Sudden volume surge indicates institutional activity
• Near swing low + reversal: Likely accumulation
• Near swing high + reversal: Likely distribution
• With continuation: Institutional conviction in direction
Type 2: Stop Runs (Liquidity Sweeps)
Definition: Price briefly exceeds swing high/low then reverses within N bars
Detection:
• Price breaks above recent swing high (triggering buy stops)
• Then closes back below that high within 3 bars
• Signal: Bullish stop run complete, reversal likely
Or inverse for bearish:
• Price breaks below recent swing low (triggering sell stops)
• Then closes back above that low within 3 bars
• Signal: Bearish stop run complete, reversal likely
Type 3: Absorption Events
Definition: High volume with small candle body
Detection:
• Volume > 2x average
• Candle body < 30% of candle range
• Interpretation: Large orders being filled without moving price
• Implication: Accumulation (at lows) or distribution (at highs)
Type 4: BSL/SSL Pools (Buy-Side/Sell-Side Liquidity)
BSL (Buy-Side Liquidity):
• Cluster of swing highs within ATR proximity
• Stop losses from shorts sit above these highs
• Breaking BSL triggers short covering (fuel for rally)
SSL (Sell-Side Liquidity):
• Cluster of swing lows within ATR proximity
• Stop losses from longs sit below these lows
• Breaking SSL triggers long liquidation (fuel for decline)
Liquidity Pool Mapping:
AMWT continuously scans for and maps liquidity pools:
// Detect swing highs/lows using pivot function
swing_high = ta.pivothigh(high, 5, 5)
swing_low = ta.pivotlow(low, 5, 5)
// Track recent swing points
if not na(swing_high)
bsl_levels.push(swing_high)
if not na(swing_low)
ssl_levels.push(swing_low)
// Display on chart with labels
Confluence Scoring Integration:
When signals fire near identified liquidity events, confluence scoring increases:
• Signal near volume spike: +10% confidence
• Signal after liquidity sweep: +15% confidence
• Signal at BSL/SSL pool: +10% confidence
• Signal aligned with absorption zone: +10% confidence
Why Liquidity Anchoring Matters:
Signals "in a vacuum" have lower probability than signals anchored to institutional activity. A long signal after a liquidity sweep below swing lows has trapped shorts providing fuel. A long signal in the middle of nowhere has no such catalyst.
📊 SIGNAL GRADING SYSTEM
The Quality Problem:
Not all signals are created equal. A signal with 6/6 factors aligned is fundamentally different from a signal with 3/6 factors aligned. Traditional indicators treat them the same. AMWT grades every signal based on confluence.
Confluence Components (100 points total):
1. Bandit Consensus Strength (25 points)
consensus_str = weighted average of agent confidences
score = consensus_str × 25
Example:
Trend Agent: +1 signal, 0.80 confidence, 0.35 weight
Reversion Agent: 0 signal, 0.50 confidence, 0.25 weight
Structure Agent: +1 signal, 0.75 confidence, 0.40 weight
Weighted consensus = (0.80×0.35 + 0×0.25 + 0.75×0.40) / (0.35 + 0.40) = 0.77
Score = 0.77 × 25 = 19.25 points
2. HMM State Confidence (15 points)
score = hmm_confidence × 15
Example:
HMM reports 82% probability of IMPULSE_UP
Score = 0.82 × 15 = 12.3 points
3. Session Quality (15 points)
Session quality varies by time:
• London/NY Overlap: 1.0 (15 points)
• New York Session: 0.95 (14.25 points)
• London Session: 0.70 (10.5 points)
• Asian Session: 0.40 (6 points)
• Off-Hours: 0.30 (4.5 points)
• Weekend: 0.10 (1.5 points)
4. Energy/Participation (10 points)
energy = (realized_vol / avg_vol) × 0.4 + (range / ATR) × 0.35 + (volume / avg_volume) × 0.25
score = min(energy, 1.0) × 10
5. Volume Confirmation (10 points)
if volume > SMA(volume, 20) × 1.5:
score = 10
else if volume > SMA(volume, 20):
score = 5
else:
score = 0
6. Structure Alignment (10 points)
For long signals:
• Bullish structure (HH + HL): 10 points
• Higher low only: 6 points
• Neutral structure: 3 points
• Bearish structure: 0 points
Inverse for short signals
7. Trend Alignment (10 points)
For long signals:
• Price > EMA21 > EMA50: 10 points
• Price > EMA21: 6 points
• Neutral: 3 points
• Against trend: 0 points
8. Entry Trigger Quality (5 points)
• Strong trigger (multiple confirmations): 5 points
• Moderate trigger (single confirmation): 3 points
• Weak trigger (marginal): 1 point
Grade Scale:
Total Score → Grade
85-100 → A+ (Exceptional—all factors aligned)
70-84 → A (Strong—high probability)
55-69 → B (Acceptable—proceed with caution)
Below 55 → C (Marginal—filtered by default)
Grade-Based Signal Brightness:
Signal arrows on the chart have transparency based on grade:
• A+: Full brightness (alpha = 0)
• A: Slight fade (alpha = 15)
• B: Moderate fade (alpha = 35)
• C: Significant fade (alpha = 55)
This visual hierarchy helps traders instantly identify signal quality.
Minimum Grade Filter:
Configurable filter (default: C) sets the minimum grade for signal display:
• Set to "A" for only highest-quality signals
• Set to "B" for moderate selectivity
• Set to "C" for all signals (maximum quantity)
🕐 SESSION INTELLIGENCE
Why Sessions Matter:
Markets behave differently at different times. The London open is fundamentally different from the Asian lunch hour. AMWT incorporates session-aware logic to optimize signal quality.
Session Definitions:
Asian Session (18:00-03:00 ET)
• Characteristics: Lower volatility, range-bound tendency, fewer institutional participants
• Quality Score: 0.40 (40% of peak quality)
• Strategy Implications: Fade extremes, expect ranges, smaller position sizes
• Best For: Mean-reversion setups, accumulation/distribution identification
London Session (03:00-12:00 ET)
• Characteristics: European institutional activity, volatility pickup, trend initiation
• Quality Score: 0.70 (70% of peak quality)
• Strategy Implications: Watch for trend development, breakouts more reliable
• Best For: Initial trend identification, structure breaks
New York Session (08:00-17:00 ET)
• Characteristics: Highest liquidity, US institutional activity, major moves
• Quality Score: 0.95 (95% of peak quality)
• Strategy Implications: Best environment for directional trades
• Best For: Trend continuation, momentum plays
London/NY Overlap (08:00-12:00 ET)
• Characteristics: Peak liquidity, both European and US participants active
• Quality Score: 1.0 (100%—maximum quality)
• Strategy Implications: Highest probability for successful breakouts and trends
• Best For: All signal types—this is prime time
Off-Hours
• Characteristics: Thin liquidity, erratic price action, gaps possible
• Quality Score: 0.30 (30% of peak quality)
• Strategy Implications: Avoid new positions, wider stops if holding
• Best For: Waiting
Smart Weekend Detection:
AMWT properly handles the Sunday evening futures open:
// Traditional (broken):
isWeekend = dayofweek == saturday OR dayofweek == sunday
// AMWT (correct):
anySessionActive = not na(asianTime) or not na(londonTime) or not na(nyTime)
isWeekend = calendarWeekend AND NOT anySessionActive
This ensures Sunday 6pm ET (when futures open) correctly shows "Asian Session" rather than "Weekend."
Session Transition Boosts:
Certain session transitions create trading opportunities:
• Asian → London transition: +15% confidence boost (volatility expansion likely)
• London → Overlap transition: +20% confidence boost (peak liquidity approaching)
• Overlap → NY-only transition: -10% confidence adjustment (liquidity declining)
• Any → Off-Hours transition: Signal suppression recommended
📈 TRADE MANAGEMENT SYSTEM
The Signal Spam Problem:
Many indicators generate signal after signal, creating confusion and overtrading. AMWT implements a complete trade lifecycle management system that prevents signal spam and tracks performance.
Trade Lock Mechanism:
Once a signal fires, the system enters a "trade lock" state:
Trade Lock Duration: Configurable (default 30 bars)
Early Exit Conditions:
• TP3 hit (full target reached)
• Stop Loss hit (trade failed)
• Lock expiration (time-based exit)
During lock:
• No new signals of same type displayed
• Opposite signals can override (reversal)
• Trade status tracked in dashboard
Target Levels:
Each signal generates three profit targets based on ATR:
TP1 (Conservative Target)
• Default: 1.0 × ATR
• Purpose: Quick partial profit, reduce risk
• Action: Take 30-40% off position, move stop to breakeven
TP2 (Standard Target)
• Default: 2.5 × ATR
• Purpose: Main profit target
• Action: Take 40-50% off position, trail stop
TP3 (Extended Target)
• Default: 5.0 × ATR
• Purpose: Runner target for trend days
• Action: Close remaining position or continue trailing
Stop Loss:
• Default: 1.9 × ATR from entry
• Purpose: Define maximum risk
• Placement: Below recent swing low (longs) or above recent swing high (shorts)
Invalidation Level:
Beyond stop loss, AMWT calculates an "invalidation" level where the wave hypothesis dies:
invalidation = entry - (ATR × INVALIDATION_MULT × 1.5)
If price reaches invalidation, the current market interpretation is wrong—not just the trade.
Visual Trade Management:
During active trades, AMWT displays:
• Entry arrow with grade label (▲A+, ▼B, etc.)
• TP1, TP2, TP3 horizontal lines in green
• Stop Loss line in red
• Invalidation line in orange (dashed)
• Progress indicator in dashboard
Persistent Execution Markers:
When targets or stops are hit, permanent markers appear:
• TP hit: Green dot with "TP1"/"TP2"/"TP3" label
• SL hit: Red dot with "SL" label
These persist on the chart for review and statistics.
💰 PERFORMANCE TRACKING & STATISTICS
Tracked Metrics:
• Total Trades: Count of all signals that entered trade lock
• Winning Trades: Signals where at least TP1 was reached before SL
• Losing Trades: Signals where SL was hit before any TP
• Win Rate: Winning / Total × 100%
• Total R Profit: Sum of R-multiples from winning trades
• Total R Loss: Sum of R-multiples from losing trades
• Net R: Total R Profit - Total R Loss
Currency Conversion System:
AMWT can display P&L in multiple formats:
R-Multiple (Default)
• Shows risk-normalized returns
• "Net P&L: +4.2R | 78 trades" means 4.2 times initial risk gained over 78 trades
• Best for comparing across different position sizes
Currency Conversion (USD/EUR/GBP/JPY/INR)
• Converts R-multiples to currency based on:
- Dollar Risk Per Trade (user input)
- Tick Value (user input)
- Selected currency
Example Configuration:
Dollar Risk Per Trade: $100
Display Currency: USD
If Net R = +4.2R
Display: Net P&L: +$420.00 | 78 trades
Ticks
• For futures traders who think in ticks
• Converts based on tick value input
Statistics Reset:
Two reset methods:
1. Toggle Reset
• Turn "Reset Statistics" toggle ON then OFF
• Clears all statistics immediately
2. Date-Based Reset
• Set "Reset After Date" (YYYY-MM-DD format)
• Only trades after this date are counted
• Useful for isolating recent performance
🎨 VISUAL FEATURES
Macro Channel:
Dynamic regression-based channel showing market boundaries:
• Upper/lower bounds calculated from swing pivot linear regression
• Adapts to current market structure
• Shows overall trend direction and potential reversal zones
Chop Boxes:
Semi-transparent overlay during high-chop periods:
• Purple/orange coloring indicates dangerous conditions
• Visual reminder to avoid new positions
Confluence Heat Zones:
Background shading indicating setup quality:
• Darker shading = higher confluence
• Lighter shading = lower confluence
• Helps identify optimal entry timing
EMA Ribbon:
Trend visualization via moving average fill:
• EMA 8/21/50 with gradient fill between
• Green fill when bullish aligned
• Red fill when bearish aligned
• Gray when neutral
Absorption Zone Boxes:
Marks potential accumulation/distribution areas:
• High volume + small body = absorption
• Boxes drawn at these levels
• Often act as support/resistance
Liquidity Pool Lines:
BSL/SSL levels with labels:
• Dashed lines at liquidity clusters
• "BSL" label above swing high clusters
• "SSL" label below swing low clusters
Six Professional Themes:
• Quantum: Deep purples and cyans (default)
• Cyberpunk: Neon pinks and blues
• Professional: Muted grays and greens
• Ocean: Blues and teals
• Matrix: Greens and blacks
• Ember: Oranges and reds
🎓 PROFESSIONAL USAGE PROTOCOL
Phase 1: Learning the System (Week 1)
Goal: Understand AMWT concepts and dashboard interpretation
Setup:
• Signal Mode: Balanced
• Display: All features enabled
• Grade Filter: C (see all signals)
Actions:
• Paper trade ONLY—no real money
• Observe HMM state transitions throughout the day
• Note when agents agree vs disagree
• Watch chop detection engage and disengage
• Track which grades produce winners vs losers
Key Learning Questions:
• How often do A+ signals win vs B signals? (Should see clear difference)
• Which agent tends to be right in current market? (Check dashboard)
• When does chop detection save you from bad trades?
• How do signals near liquidity events perform vs signals in vacuum?
Phase 2: Parameter Optimization (Week 2)
Goal: Tune system to your instrument and timeframe
Signal Mode Testing:
• Run 5 days on Aggressive mode (more signals)
• Run 5 days on Conservative mode (fewer signals)
• Compare: Which produces better risk-adjusted returns?
Grade Filter Testing:
• Track A+ only for 20 signals
• Track A and above for 20 signals
• Track B and above for 20 signals
• Compare win rates and expectancy
Chop Threshold Testing:
• Default (80%): Standard filtering
• Try 70%: More aggressive filtering
• Try 90%: Less filtering
• Which produces best results for your instrument?
Phase 3: Strategy Development (Weeks 3-4)
Goal: Develop personal trading rules based on system signals
Position Sizing by Grade:
• A+ grade: 100% position size
• A grade: 75% position size
• B grade: 50% position size
• C grade: 25% position size (or skip)
Session-Based Rules:
• London/NY Overlap: Take all A/A+ signals
• NY Session: Take all A+ signals, selective on A
• Asian Session: Only A+ signals with extra confirmation
• Off-Hours: No new positions
Chop Zone Rules:
• Chop >70%: Reduce position size 50%
• Chop >80%: No new positions
• Chop <50%: Full position size allowed
Phase 4: Live Micro-Sizing (Month 2)
Goal: Validate paper trading results with minimal risk
Setup:
• 10-20% of intended full position size
• Take ONLY A+ signals initially
• Follow trade management religiously
Tracking:
• Log every trade: Entry, Exit, Grade, HMM State, Chop Level, Agent Consensus
• Calculate: Win rate by grade, by session, by chop level
• Compare to paper trading (should be within 15%)
Red Flags:
• Win rate diverges significantly from paper trading: Execution issues
• Consistent losses during certain sessions: Adjust session rules
• Losses cluster when specific agent dominates: Review that agent's logic
Phase 5: Scaling Up (Months 3-6)
Goal: Gradually increase to full position size
Progression:
• Month 3: 25-40% size (if micro-sizing profitable)
• Month 4: 40-60% size
• Month 5: 60-80% size
• Month 6: 80-100% size
Scale-Up Requirements:
• Minimum 30 trades at current size
• Win rate ≥50%
• Net R positive
• No revenge trading incidents
• Emotional control maintained
💡 DEVELOPMENT INSIGHTS
Why HMM Over Simple Indicators:
Early versions used standard indicators (RSI >70 = overbought, etc.). Win rates hovered at 52-55%. The problem: indicators don't capture state. RSI can stay "overbought" for weeks in a strong trend.
The insight: markets exist in states, and state persistence matters more than indicator levels. Implementing HMM with state transition probabilities increased signal quality significantly. The system now knows not just "RSI is high" but "we're in IMPULSE_UP state with 70% probability of staying in IMPULSE_UP."
The Multi-Agent Evolution:
Original version used a single analytical methodology—trend-following. Performance was inconsistent: great in trends, destroyed in ranges. Added mean-reversion agent: now it was inconsistent the other way.
The breakthrough: use multiple agents and let the system learn which works . Thompson Sampling wasn't the first attempt—tried simple averaging, voting, even hard-coded regime switching. Thompson Sampling won because it's mathematically optimal and automatically adapts without manual regime detection.
Chop Detection Revelation:
Chop detection was added almost as an afterthought. "Let's filter out obviously bad conditions." Testing revealed it was the most impactful single feature. Filtering chop zones reduced losing trades by 35% while only reducing total signals by 20%. The insight: avoiding bad trades matters more than finding good ones.
Liquidity Anchoring Discovery:
Watched hundreds of trades. Noticed pattern: signals that fired after liquidity events (stop runs, volume spikes) had significantly higher win rates than signals in quiet markets. Implemented liquidity detection and anchoring. Win rate on liquidity-anchored signals: 68% vs 52% on non-anchored signals.
The Grade System Impact:
Early system had binary signals (fire or don't fire). Adding grading transformed it. Traders could finally match position size to signal quality. A+ signals deserved full size; C signals deserved caution. Just implementing grade-based sizing improved portfolio Sharpe ratio by 0.3.
🚨 LIMITATIONS & CRITICAL ASSUMPTIONS
What AMWT Is NOT:
• NOT a Holy Grail : No system wins every trade. AMWT improves probability, not certainty.
• NOT Fully Automated : AMWT provides signals and analysis; execution requires human judgment.
• NOT News-Proof : Exogenous shocks (FOMC surprises, geopolitical events) invalidate all technical analysis.
• NOT for Scalping : HMM state estimation needs time to develop. Sub-minute timeframes are not appropriate.
Core Assumptions:
1. Markets Have States : Assumes markets transition between identifiable regimes. Violation: Random walk markets with no regime structure.
2. States Are Inferable : Assumes observable indicators reveal hidden states. Violation: Market manipulation creating false signals.
3. History Informs Future : Assumes past agent performance predicts future performance. Violation: Regime changes that invalidate historical patterns.
4. Liquidity Events Matter : Assumes institutional activity creates predictable patterns. Violation: Markets with no institutional participation.
Performs Best On:
• Liquid Futures : ES, NQ, MNQ, MES, CL, GC
• Major Forex Pairs : EUR/USD, GBP/USD, USD/JPY
• Large-Cap Stocks : AAPL, MSFT, TSLA, NVDA (>$5B market cap)
• Liquid Crypto : BTC, ETH on major exchanges
Performs Poorly On:
• Illiquid Instruments : Low volume stocks, exotic pairs
• Very Low Timeframes : Sub-5-minute charts (noise overwhelms signal)
• Binary Event Days : Earnings, FDA approvals, court rulings
• Manipulated Markets : Penny stocks, low-cap altcoins
Known Weaknesses:
• Warmup Period : HMM needs ~50 bars to initialize properly. Early signals may be unreliable.
• Regime Change Lag : Thompson Sampling adapts over time, not instantly. Sudden regime changes may cause short-term underperformance.
• Complexity : More parameters than simple indicators. Requires understanding to use effectively.
⚠️ RISK DISCLOSURE
Trading futures, stocks, options, forex, and cryptocurrencies involves substantial risk of loss and is not suitable for all investors. Adaptive Market Wave Theory, while based on rigorous mathematical frameworks including Hidden Markov Models and multi-armed bandit algorithms, does not guarantee profits and can result in significant losses.
AMWT's methodologies—HMM state estimation, Thompson Sampling agent selection, and confluence-based grading—have theoretical foundations but past performance is not indicative of future results.
Hidden Markov Model assumptions may not hold during:
• Major news events disrupting normal market behavior
• Flash crashes or circuit breaker events
• Low liquidity periods with erratic price action
• Algorithmic manipulation or spoofing
Multi-agent consensus assumes independent analytical perspectives provide edge. Market conditions change. Edges that existed historically can diminish or disappear.
Users must independently validate system performance on their specific instruments, timeframes, and broker execution environment. Paper trade extensively before risking capital. Start with micro position sizing.
Never risk more than you can afford to lose completely. Use proper position sizing. Implement stop losses without exception.
By using this indicator, you acknowledge these risks and accept full responsibility for all trading decisions and outcomes.
"Elliott Wave was a first-order approximation of market phase behavior. AMWT is the second—probabilistic, adaptive, and accountable."
Initial Public Release
Core Engine:
• True Hidden Markov Model with online Baum-Welch learning
• Viterbi algorithm for optimal state sequence decoding
• 6-state market regime classification
Agent System:
• 3-Bandit consensus (Trend, Reversion, Structure)
• Thompson Sampling with true Beta distribution sampling
• Adaptive weight learning based on performance
Signal Generation:
• Quality-based confluence grading (A+/A/B/C)
• Four signal modes (Aggressive/Balanced/Conservative/Institutional)
• Grade-based visual brightness
Chop Detection:
• 5-factor analysis (ADX, Choppiness Index, Range Compression, Channel Position, Volume)
• 7 regime classifications
• Configurable signal suppression threshold
Liquidity:
• Volume spike detection
• Stop run (liquidity sweep) identification
• BSL/SSL pool mapping
• Absorption zone detection
Trade Management:
• Trade lock with configurable duration
• TP1/TP2/TP3 targets
• ATR-based stop loss
• Persistent execution markers
Session Intelligence:
• Asian/London/NY/Overlap detection
• Smart weekend handling (Sunday futures open)
• Session quality scoring
Performance:
• Statistics tracking with reset functionality
• 7 currency display modes
• Win rate and Net R calculation
Visuals:
• Macro channel with linear regression
• Chop boxes
• EMA ribbon
• Liquidity pool lines
• 6 professional themes
Dashboards:
• Main Dashboard: Market State, Consensus, Trade Status, Statistics
📋 AMWT vs AMWT-PRO:
This version includes all core AMWT functionality:
✓ Full Hidden Markov Model state estimation
✓ 3-Bandit Thompson Sampling consensus system
✓ Complete 5-factor chop detection engine
✓ All four signal modes
✓ Full trade management with TP/SL tracking
✓ Main dashboard with complete statistics
✓ All visual features (channels, zones, pools)
✓ Identical signal generation to PRO
✓ Six professional themes
✓ Full alert system
The PRO version adds the AMWT Advisor panel—a secondary dashboard providing:
• Real-time Market Pulse situation assessment
• Agent Matrix visualization (individual agent votes)
• Structure analysis breakdown
• "Watch For" upcoming setups
• Action Command coaching
Both versions generate identical signals . The Advisor provides additional guidance for interpreting those signals.
Taking you to school. - Dskyz, Trade with probability. Trade with consensus. Trade with AMWT.

FVG & OB [odnac]This indicator is a sophisticated tool designed for Smart Money Concepts (SMC) traders. It automates the detection of two critical institutional footprints: Order Blocks (OB) and Fair Value Gaps (FVG), with a focus on candle momentum and mitigation tracking.
Key Features
1. Advanced Momentum Filtering (3 Versions)
Unlike basic indicators, this script uses three different mathematical approaches to ensure the middle candle represents a "strong" move:
V1 (Body Focus): Compares the bodies of the surrounding candles to the middle candle.
V2 (Hybrid): Uses a mix of candle ranges and bodies to identify expansion.
V3 (Range Focus): The most aggressive filter; it ensures the total range of the middle candle dwarfs the surrounding candles.
2. Automatic Mitigation Tracking
The indicator doesn't just draw static boxes. It tracks price action in real-time:
Dynamic Extension: Boxes extend to the right automatically as long as price has not returned to "test" or "fill" the zone.
Smart Clean-up: Once the price touches the zone (Mitigation), the box stops extending or is removed. This keeps your chart clean and focused only on "fresh" (unmitigated) levels.
3. Smart Money Concept Integration
Order Blocks (White Boxes): Identifies where institutional buying or selling occurred before a strong move.
Fair Value Gaps (Yellow Boxes): Highlights price imbalances where the market moved too fast, leaving a gap that often acts as a magnet for future price action.
Technical Logic Breakdown
Detection Logic
The script looks at a 3-candle sequence:
Candle (The Origin): Defines the boundary of the OB or FVG.
Candle (The Expansion): Must be a "Strong Candle" based on your selected setting (V1, V2, or V3).
Candle (The Confirmation): Ensures that the "Tail Gap" condition is met (the wick of Candle 2 and Candle 0 do not touch).
Box Management
The script uses Pine Script Arrays to manage up to 500 boxes. It constantly loops through active boxes to check:
Time Limit: If a box exceeds the max_bars_extend limit, it is removed to save memory.
Price Touch: If low or high enters the box coordinates, the zone is considered "mitigated" and the extension stops.

TrendMaster [Scalping-Algo]═══════════════════════════════════════════════════════════════
📈 TrendMaster
═══════════════════════════════════════════════════════════════
🔹 WHAT IS IT?
A smarter Supertrend that filters out fake signals in choppy markets.
No more whipsaws. No more overtrading. Just clean entries.
🔹 HOW IT WORKS
🟢 GREEN line below price = BULLISH (look for longs)
🔴 RED line above price = BEARISH (look for shorts)
Signals only appear when:
✓ ADX > 20 (market is trending)
✓ Minimum 5 bars since last signal (no rapid flips)
🔹 SETTINGS
| Setting | Default | Range |
|-------------|---------|------------|
| ATR Period | 12 | 10-14 |
| Factor | 3.0 | 2.5-3.5 |
| Min ADX | 20 | 15-25 |
| Min Bars | 5 | 3-8 |
Lower ADX = more signals (noisier)
Higher ADX = fewer signals (cleaner)
═══════════════════════════════════════════════════════════════
🎯 SCALPING STRATEGY
═══════════════════════════════════════════════════════════════
▶ LONG SETUP
1. Wait for 🟢 ▲ signal
2. Enter next candle
3. SL: Below green line
4. TP: 1.5-2R
▶ SHORT SETUP
1. Wait for 🔴 ▼ signal
2. Enter next candle
3. SL: Above red line
4. TP: 1.5-2R
═══════════════════════════════════════════════════════════════
💡 PRO TIPS
═══════════════════════════════════════════════════════════════
✅ DO:
• Use on 5m, 15m, 1H
• Trade with the trend
• Combine with S/R levels
• Risk 1% per trade
• Wait for clean signal
❌ DON'T:
• Trade flat markets
• Chase after big moves
• Ignore HTF trend
• Overtrade
═══════════════════════════════════════════════════════════════
⚡ QUICK REFERENCE
═══════════════════════════════════════════════════════════════
GREEN LINE = BUY ZONE | RED LINE = SELL ZONE
▲ = Long entry | ▼ = Short entry
Line = Stop loss | Line = Stop loss
════════════════════════════════════════════
👍 Like if useful
💬 Comment your results
🔔 Follow for more

Jake's Candle by Candle UpgradedJake's Candle by Candle Upgraded
The "Story of the Market" Automated
This is not just another signal indicator. Jake's Candle by Candle Upgraded is a complete institutional trading framework designed for high-precision scalping on the 1-minute and 5-minute timeframes.
Built strictly on the principles of Al Brooks Price Action and Smart Money Concepts (SMC), this tool automates the rigorous "Candle-by-Candle" analysis used by professional floor traders. It moves beyond simple pattern recognition to read the "Story" of the market—Context, Setup, and Pressure—before ever allowing a trade.
The Philosophy: Why This Tool Was Built
Most retail traders fail for two reasons:
Getting Trapped: They enter on the first sign of a reversal (H1/L1), which is often an institutional trap.
Trading Chop: They bleed capital during low-volume, sideways markets.
This tool solves both problems with an Algorithmic Discipline Engine. It does not guess. It waits for the specific "Second Leg" criteria used by institutions and physically disables itself during dangerous market conditions.
Key Features
1. The Context Dashboard (HUD)
A professional Heads-Up Display in the top-right corner keeps you focused on the macro picture while you scalp.
FLOW: Monitors the 20-period Institutional EMA. (Green = Bull Flow, Red = Bear Flow). You are prevented from trading against the dominant trend.
STATE: A built-in "Volatility Compressor." If it says "⚠️ CHOP / RANGE", the algorithm is disabled. It protects you from overtrading during lunch hours or low-volume zones.
SETUP: Live tracking of the Al Brooks leg count. It tells you exactly when the algorithm is "Waiting for Pullback" or "Searching for Entry."
2. Smart "Trap Avoidance" Logic (H2/L2)
This tool uses the "Gold Standard" of scalping setups: The High 2 (H2) and Low 2 (L2).
It ignores the first breakout attempt (Leg 1), acknowledging it as a potential trap.
It waits for the pullback and only signals on the Second Leg, statistically increasing the probability of a successful trend resumption.
3. Volatility-Adaptive Risk Management
Stop calculating pips in your head. The moment a signal is valid, the tool draws your business plan on the chart:
Stop Loss (Red Line): Automatically placed behind the "Signal Bar" (the candle that created the setup) based on strict price action rules.
Take Profit (Green Line): Automatically projected at a 1.5 Risk-to-Reward Ratio.
Smart Adaptation: The targets expand and contract based on real-time market volatility. If the market is quiet, targets are tighter. If explosive, targets are wider.
4. The "Snap Entry" Signal
The BUY and SELL badges are not lagging. They are programmed with "Stop Entry" logic—appearing the exact moment price breaks the structure of the Signal Bar, ensuring you enter on momentum, not hope.
How to Trade Strategy
Check the HUD: Ensure FLOW matches your direction and STATE says "✅ VOLATILE".
Wait for the Badge: Do not front-run the tool. Wait for the BUY or SELL badge to print.
Set Your Orders: Once the signal candle closes:
Place your Stop Loss at the Red Line.
Place your Take Profit at the Green Line.
Walk Away: The trade is now a probability event. Let the math play out.
Technical Specifications
Engine: Pine Script v6 (Strict Compliance).
Best Timeframes: 1m, 5m.
Best Assets: Indices (NQ, ES), Gold (XAUUSD), and high-volume Crypto (BTC, ETH).
