Hyper Frame Fibo MA RibbonsIntroduction
Moving averages are an integral part of the TA world. There are different types of moving averages and each person uses them depending on their strategy and market conditions.
Meanwhile, the main variable in calculating the averages is their LENGTH. This value is optional, but not every value is applicable.
After much experience in the world of financial markets, I came to the conclusion that although the most popular length values are 20, 50, 100, and 200, the Fibonacci number come with surprising results .
Description
The following script calculates seven averages with the length of Fibonacci numbers (34, 55, 89, 144, 233, 377 and 610) with the formula of your choice (SMA, EMA, WMA, HMA) and shows that we named it FiboMa .
You can also have Bollinger Bands with the desired frame at the same time.
This is not the whole story...
You can see the same values from smaller or larger frames at the same time!
We named this feature Hyper Frame Vision .
It is possible to display values for FiboMa up to three hyper frames (with the main frame a total of 4 levels) and in the Bollinger Bands one hyper frame (with the main frame a total of 2 levels).
By default, the display of FiboMa hyper frame values is limited to the last 10 bars, which you can change to an arbitrary value by changing the source code.
The display of hyper frame values is not limited for Bollinger Band.
What is its use? What is it good for?
Support and Resistance
Using dynamic support / resistance is much smarter than static! This protects you from the risk of many fake breaks, and your profit and loss limits will be more flexible and more efficient.
The intersection of FiboMa ribbons are potential points of support / resistance.
We use colors to easily identify supports / resistances.
Any average lower than the price is assumed as support and displayed in green, and any average above the price is assumed as resistance so displayed in red.
So the color of the averages is dynamic.
The color of FiboMa is a range from red to green. Whatever colors get saturated , the lenght is longer and the more power it has as support / resistance.
Volatility
With this script, you also have the ability to monitor the amount of market volatility ! The combination of Bollinger Bands and FiboMa provides a clear view of the market volatility.
The decrease and compression of the FiboMa width is a sign of a decrease in volatility and vice versa.
Trend
I don't see the need for additional explanation, only whenever the price is higher than the middle band , the BB cloud is green , and whenever it is lower , is red .
The wider FiboMa means the stronger trend.
How to use
In the script settings you have the ability to enable or disable anything except.
---------------------------------------------
Similar scripts have been published before and we were inspired by them and tried to improve idea and code uniqe one.
I hope it will be useful .. Support us with your likes and comments .. We have anothers great script .. Just started.
在腳本中搜尋"smart"

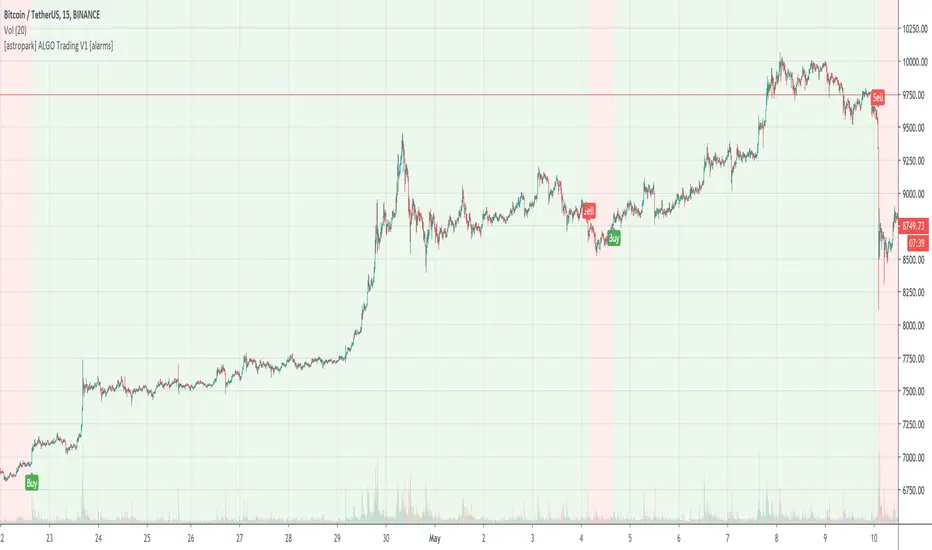
[astropark] ALGO Trading V3 [alarms]Dear Followers,
today another awesome Swing and Scalping Trading Strategy indicator, runnable on a bot , which works great on many timeframes (from 1h and above is suggested), just write me in order to help you find correct settings).
It must be said that this strategy works even better on 1m Renko chart!
If you are a scalper or you are a swing trader, you will love suggested entries for fast and long-lasting profit.
Keep in mind that a proper trailing stop strategy and risk management and money management strategies are very important (DM me if you need any clarification on these points).
This is not an evolution of "ALGO Trading V1" or "ALGO Trading V2" , but a twin sister of them.
For your reference, here it is the "ALGO Trading V1" indicator
and here the "ALGO Trading V2"
This strategy has the following options:
enable/disable signals on chart
enable/disable bars and background coloring based on trend
enable/disable a "filter noise" option , which try to reduce overtrading (you can easily check it on backtesting)
enable/disable a Take Profit / Stop Loss option (you can easily check it on backtesting too)
enable/disable a secret SmartOption which may improve profit on your chart (again, check it on you chart if it helps or not)
This strategy only trigger 1 buy or 1 sell. If you enable Take Profit / Stop Loss option, consider that many TP can be triggered before trend reversal, so take partial profit on every TP an eventually buy/sell back lower/higher to maximize your profit.
This script will let you set all notifications you may need in order to be alerted on each triggered signals.
The one for backtesting purpose can be found by searching for the astropark's "ALGO Trading V3" and then choosing the indicator with "strategy" suffix in the name, or you can find here below
Strategy results are calculated on the time window from 1995 to now, so on more than 15 years, using 1000$ as initial capital and working at 1x leverage (so no leverage at all! If you like to use leverage, be sure to use a safe option, like 3x or 5x at most in order to have liquidation price very far).
This is not the "Holy Grail", so use a proper risk management strategy.
This script will let you backtest how the indicator will perform on any chart and timeframe you may like to test and/or trade. Of course results will be very different depending on the chart and timeframe you will open. I tested a lot of charts and always you can find a combination that keep this strategy in profit on swing trading style (and this means that if you can have a daily look at the chart you can always manage to maximize your profit on each trade!)
This is a premium indicator , so send me a private message in order to get access to this script.

[astropark] ALGO Trading V2 [alarms]Dear Followers,
today another awesome Swing and Scalping Trading Strategy indicator, runnable on a bot , which works great on many timeframes (ones between 1h and 1D are suggested, but just write me in order to help you find correct settings).
It must be said that this strategy works even better on 1m Renko chart!
If you are a scalper or you are a swing trader, you will love suggested entries for fast and long-lasting profit.
Keep in mind that a proper trailing stop strategy and risk management and money management strategies are very important (DM me if you need any clarification on these points).
This is not an evolution of "ALGO Trading V1" or "ALGO Trading V3" , but a twin sister of them. Search them on TradingView to know them better.
Here you can find ALGO Trading V1
This strategy has the following options:
enable/disable signals on chart
enable/disable bars and background coloring based on trend
enable/disable a "filter noise" option , which try to reduce overtrading (you can easily check it on backtesting)
enable/disable a Take Profit / Stop Loss option (you can easily check it on backtesting too)
enable/disable a secret SmartOption which may improve profit on your chart (again, check it on you chart if it helps or not)
This strategy only trigger 1 buy or 1 sell. If you enable Take Profit / Stop Loss option, consider that many TP can be triggered before trend reversal, so take partial profit on every TP an eventually buy/sell back lower/higher to maximize your profit.
This script will let you set all notifications you may need in order to be alerted on each triggered signals.
The one for backtesting purpose can be found by searching for the astropark's "ALGO Trading V2" and then choosing the indicator with "strategy" suffix in the name, or you can find here below
Strategy results are calculated on the time window from January 2018 to now, so on more than 2 years, using 1000$ as initial capital and working at 1x leverage (so no leverage at all! If you like to use leverage, be sure to use a safe option, like 3x or 5x at most in order to have liquidation price very far).
This is not the "Holy Grail", so use a proper risk management strategy.
This is a premium indicator , so send me a private message in order to get access to this script.

[astropark] ALGO Trading V1 [alarms]Dear Followers,
today another awesome Swing and Scalping Trading Strategy indicator, runnable on a bot , which works great on Low Timeframes (1h is suggested) but also on even lower ones (till 15m) and on higher ones (no further than 1D), just write me in order to help you find correct settings).
It must be said that this strategy works even better on 1m Renko chart!
If you are a scalper or you are a swing trader, you will love suggested entries for fast and long-lasting profit.
Keep in mind that a proper trailing stop strategy and risk management and money management strategies are very important (DM me if you need any clarification on these points).
This is not an evolution of "ALGO Trading V2" or "ALGO Trading V3" , but a twin sister of them. Search them on TradingView to know them better.
This strategy has the following options:
enable/disable signals on chart
enable/disable bars and background coloring based on trend
enable/disable a "filter noise" option , which try to reduce overtrading (you can easily check it on backtesting)
enable/disable a Take Profit / Stop Loss option (you can easily check it on backtesting too)
enable/disable a secret SmartOption which may improve profit on your chart (again, check it on you chart if it helps or not)
This strategy only trigger 1 buy or 1 sell. If you enable Take Profit / Stop Loss option, consider that many TP can be triggered before trend reversal, so take partial profit on every TP an eventually buy/sell back lower/higher to maximize your profit.
This script will let you set all notifications you may need in order to be alerted on each triggered signals.
The one for backtesting purpose can be found by searching for the astropark's "ALGO Trading V1" and then choosing the indicator with "strategy" suffix in the name, or you can find here below
Strategy results are calculated on the time window from January 2019 to now, so on more than 1 year, using 1000$ as initial capital and working at 1x leverage (so no leverage at all! If you like to use leverage, be sure to use a safe option, like 3x or 5x at most in order to have liquidation price very far).
This is not the "Holy Grail", so use a proper risk management strategy.
This is a premium indicator , so send me a private message in order to get access to this script.
Vilarso PROThis indicator ( Vilarso PRO script) is based on mathematical calculations of the average price on the chart for a certain period of time. Trading volumes, volatility and candlestick patterns are taken into account. For active trading, there is a linear regression channel that calculates the price correlation coefficient.
The indicator shows entry points to the zones of active purchases and sales. Detects high and low price values. It takes into account the direction of the trend and repaints candles / bars in a given direction. An exception to the trend is present (locally) in the lateral “flat” movement - this must be taken into account in the framework of technical analysis.
Indicator signals appear on the chart with increased volumes of the candle in the moment and without delay. Signal fixing occurs from the moment a new candle is opened. In the meantime, the current one is open - the signal may cancel according to logic (volume, candlestick model, breakdown of the level above the average price, period of volatility, etc.).
Thanks to this function (signals at the moment the candle opens), you can configure the alert signals from the indicator to fit your trading strategy and receive in the form of sound notifications on the monitor or in the tradingview application on your smartphone. This is done in order not to miss anything in the market.
The indicator ( Vilarso PRO script) can be used on any timeframes from 1 minute to 1 month / year. There are special settings for three main modes or trading strategies:
- Active (intraday / scalping)
- Standard (inside the week / swing)
- Aged (within a month / trend)
Note:
- Recommended for use with additional technical analysis tools.
- Before applying this indicator - be sure to study its behavior on the history of the chart!
- Tradingview users can set up personal alerts only with a paid subscription: PRO (10pcs), PRO + (30pcs), Premium (200pcs).
- Vilarso took care of those who do not have a paid subscription to tradingview. My indicator is configured for notifications in the telegram channel and is available to everyone who uses this indicator.
Access restricted!

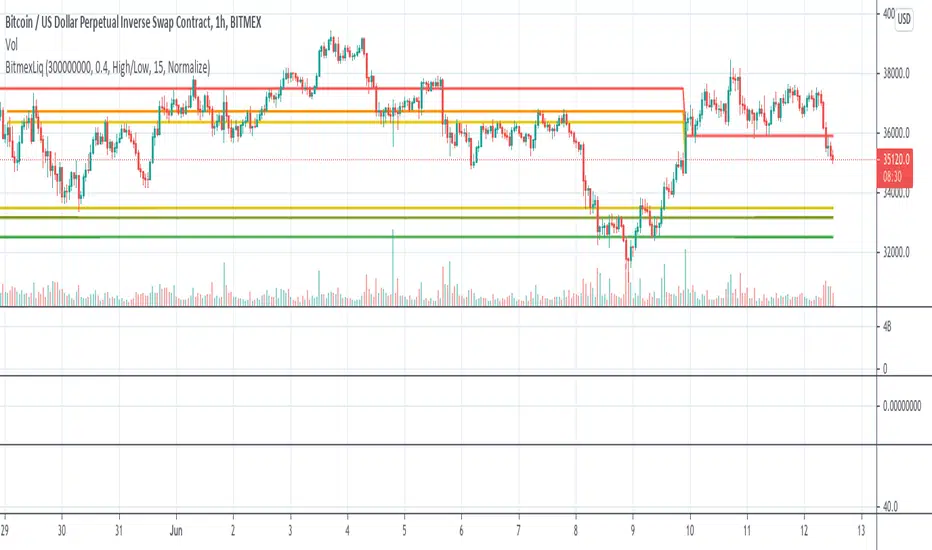
BitMEX Liquidation LevelsThis indicator plots BitMEX liquidation levels:
- 25x
- 50x
- 100x
The indicator works as following:
The underlying assumption (as with all liquidation calculations) obviously is that traders used fixed margin or go "all in" on their cross-margin account.
You then can configure a minimum trade volume and a minimum price change in percent for a candle to start computing liquidation levels from that candle
Additionally: configure the price base for the liqudation level: Candle high or low (default) works well, but you can also set "candle close" or "median high/low"
The indicator will then plot horizontal lines on the main chart showing price levels where many positions opened at the configured "start candle" will likely get liquidated.
It works for all BitMEX contracts and while it has been optimized for BitMEX, it will work on other exchanges with the same leverage levels (25x, 50x, 100x) and maintenance margin requirements too.
This indicator uses the Smart Volume indicator to compute the volume at the "start volume candle" setting where the liquidation level starts. This indicator can be found here: Smart Volume:
Bitfinex Spot vs Margin Volume - Multi-assetThe Bitfinex Spot vs Margin Volume - Multi-asset indicator was designed to help understanding how volume is composed between Spot and Margin transactions, considering all possible scenarios.
It provides valuable additional insight on how 'smarter money' is behaving in anticipation of possible upcoming moves, and can contribute to current analysis toolkits.
To request access, please send me a direct message.
Main features:
Spot vs. Margin insight for all margin-enabled Bitfinex pairs (dynamically detected from Chart).
Can be used on non-Bitfinex Charts which share same Ticker (eg. BTCUSD on Bitfinex or Bitstamp). Also dynamically detected.
Can be used in a separate pane (default) or added to main chart, as a standard volume indicator.
Shapes' meanings:
Colored bars represent scenario where maximum possible volume is attributed to Spot transactions (and its corresponding effect on Margin, if any).
Histograms (thin bars) represent scenario where maximum possible volume is attributed to Margin transactions (and its corresponding effect on Spot, if any).
When volume information leaves room for ambiguity, there will be a mismatch between maximums and minimums. Truth will be somewhere in the middle.
By default, Spot and Margin volumes are stacked up, as in traditional volume bar style.This can be disabled in Options - in which case Margin volumes are presented below zero line (this can facilitate some readings; see notes).
Standard volume for current chart's pair is presented in light gray, in the background. It helps seeing realtime volume and any surplus volume in relation to Bitfinex's.
Colors:
By default, Spot volume bars are colored in blue, but you can choose to use price closes to define them instead - as in traditional volume indicators.
You can also choose to invert Spot and Margin colors, so that Spot volumes are presented in higher contrast.
Margin volumes are, by default, colored based on whether Longs or Shorts were more relevant.
Direction attribution:
Default ratio threshold to define above-mentioned relevance is 1.1 (10%). (eg.: if Longs were greater than Shorts, Longs' volume must be at least 10% grater than Shorts' for direction of movement to be attributed to Longs). Direction then is defined based on winning side, plus whether openings or closings were dominant.
Threshold be configured from 1.01 to N. If ratio is below threshold, direction is considered neutral (yellow/orange colors).
Based on this assessment, label signals are presented at top area of chart, indicating whether opening(+) or closing(-) Longs or Shorts were the major responsibles for the move.
By default, to avoid much cluttering, labels are presented only for greater-than-average (ema 17) margin volumes. This can also be customized in Options.
Claim transactions:
Claim transactions are margin positions closed with traders' own existing assets being handed in to lenders. Thus, they do not impact order books -- and volume -- when executed.
Still, they are an additional, potentially valuable source of information, and the indicator is able to detect and report them.
Green triangle-like area shapes represent Longs closed with Claim transaction(s). Likewise, similar red shapes represent Shorts closed with Claim transactions.
This topic is explained in greater detail in this Bitfinex article .
Notes:
When using stacked up visualization, values in data window do not correspond to actual margin volumes. To see actual values, change to non-stacked up mode, and ignore negative sign.
The lower the time frame, the more precise it gets.
To request access, please send me a direct message.
For questions and feedbacks, please share them in comments section below.
Thank you, and best of success on your trades.

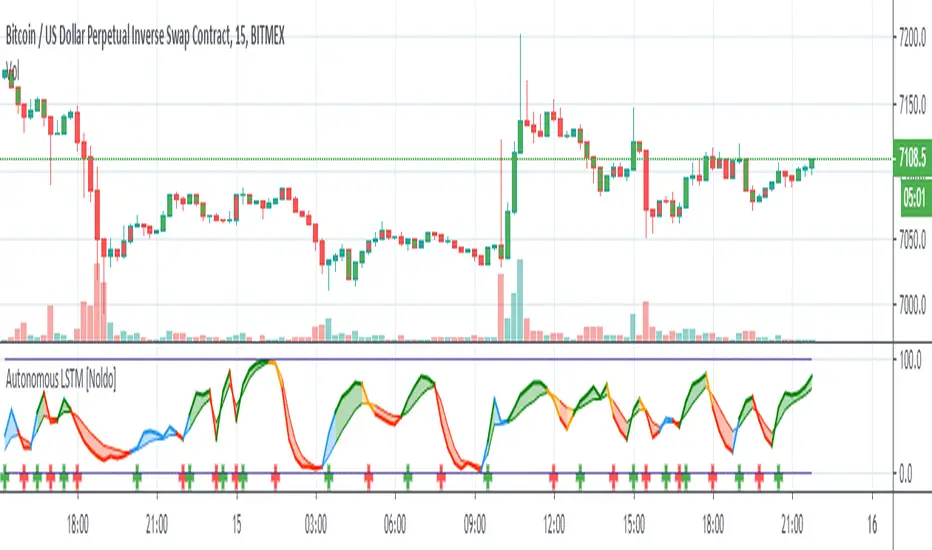
Autonomous LSTM [Noldo] Structure
Feature Layer 1 : Formulation :
The Autonomous LSTM adaptive period equation is a multivariate equation created by averaging a table based on market weights and optimizing it for each time period, by specially Artificial Neural Networks (ANN) training and taking note of the instruments chosen from Foreign exchange instruments, Stock markets , Futures and Commodities , Interest Rates and Yields all over the Global Markets.
Market weights and liquidities were taken into consideration and included in the calculations.
Feature Layer 2: Forecast Algorithm :
When we apply only the first item, we only get the buy and sell signals in reverse.
In other words, since we measure the expectation, the positive signal informs the bear market and the negative scenario informs the bull market.
If we only act according to the expectations market, our system will be very sensitive.
When we associate this with real prices, both our accuracy increases and the reverse market returns to the normal market.
In other words, as in the indicators with standard average, the upward crosses are buy and the downward crosses are sell signal.
Examples:
a -) The normal deep learning script (ANN), which is only created according to expectations:
Unlike standard market, it gives reverse signals.
Original script :
b-) Script with Forecast Algorithm but it only uses valid and standard periods for certain instruments :
Original script :
Feature Layer 3 : Composite of Two Layers : Adaptive Period (Length) Algorithm
This layer is the most important layer.
Outputs the period.
It adjusts itself to market conditions and provides a more agile trading environment under all circumstances.
Display of smart period function and standard period :
Where the market is stagnant, the period increases automatically and reduces unnecessary trade, while in trendy markets the period decreases automatically and allows to see positions first.
The degree of stagnation of the instrument concerned is not calculated solely by volatility.
We may perceive this in relation to several factors, but yes volatility is one of these factors.
When we put the script system under the MACD (Moving Average Convergence Divergence) roof, I did the tests.
Where both averages were positive, they could report accurate harsh trend news, or vice versa.
But I decided to give it up and put it on the Stochastic Money Flow Index .
First of all , Stochastic Money Flow Index function takes the volume into account.
The reason for this is a very important factor, which is naturally contained in the structure of High - Low conditions related codes.
And by using this factor, it could be superfast adaptive in both stagnant and trendy markets.
Feature Layer 4 : High - Low Selection Algorithm
The High-Low Selection Algorithm does not depend on a specific period but scans all periods backwards.(Lookback Function - Lkb )
Outputs the lowest or highest values in the specified new period.
This algorithm was written by me with the concern that if everyone trades according to the same threshold values, it will cause problems and choosing between values of the whole period length will slow down the signals.
This algorithm consists of two functions.
a - Lkb (Lookback Function) :
The lookback function scans back all periods from 0 to Smart Period bars at the same time.
In order to show the effect of the function, it was done between 0 and 84 bars.
However, the scan period of the function is normally at the same time: 0 to adaptive period time.
If the adaptive period includes a fractional day, it can also scan it.
There is no need to be an integer.
All functions are written to make mutable variables appropriate.
And what this function will scan depends on the second feature.
The special selection algorithm is in this function.And the output is given in this function.
b-) High - Low Selection Algorithm
Outputs the lowest or highest values in the specified new period.
This function allows you to select the most advantageous low or high values, even though the adaptive period remains the same.
And the signals are even more accurate.
This is a comparison of the High-Low selection algorithm and the Function: Stochastic Money Flow Index in the standard period.
For the codes of the Stochastic Money Flow Index function:
Speed may not be clear here.
So let's take a look at on chart.
So I would like to show a comparison values of the standard and special selection algorithms on Standard Highest - Lowest Function (All effort goes to RicardoSantos)
Note: This function is the standard function and freed from integer loads.
Blue = Function Highest - Lowest (length = 10 )
Yellow = Smart High-Low Selection Algorithm (length = 10 )
You can better observe the different results in the same period on the chart.
***
4 layers are interdependent.
And when the inter-layer operations are completed, output is given.
*** - Usage of Autonomous LSTM
Plot Rules
Blue Zones = Crossover condition where the average of long and short lines is less than 50.
Orange Zones = Crossunder condition where long and short lines averages more than 50.
Green Zones = Crossover condition where the average of long and short lines is greater than 50.
Red Zones = Crossunder condition where long and short lines averages less than 50.
*** Autonomous LSTM Settings :
It is just the barcolor to be colored according to the crossover and crossunder conditions or not (I / 0) option.
*** Autonomous LSTM Alerts :
As an alert, it only reports crossover and crossunder status as "Long Signal" and "Short Signal" as a warning after the first bar closure.
*** CONCLUSION :
Autonomous LSTM Designed to be used in any time frame.
Does not repaint in any time frame.
Script is independent of constant coefficients.No period adjustment is necessary.
Each layer transfers the information in its own layer to the next layer and the results are reflected in the Stochastic Money Flow Index function built on the resultant.
Regards.
Trend Pulse Pro V2Trend Pulse Pro V2 (Non Repaint)
TradingView Account Needed: Free
You don't need to be an expert to use Trend Pulse Pro.
Just follow the signals and that's all and use simple Fibonacci levels to find stop loss and take profit!
You can increase the win rate even more by following some simple technical analysis, for example, when trend breaks (price break signal level) you can use that as support become resistance level (sell) or resistance becomes support (buy):
No complex things. No waste of time.
And although you won't win 100% of the trades (no signals can guarantee that), your trading will surely improve a lot!
Even someone with almost no trading experience can read the simple trading rules given in the included user guide, watch the how-to videos and follow Trend Pulse Pro’s signals to consistently make smarter trades.
With Trend Pulse Pro you will get accurate buy and sell signals every time there is a new trading opportunity so that you never miss any big price movements and makes your trading both easier and more profitable.
How to use the signals and alerts:
Trend Pulse Pro automatically analyze trend and price action to give you a signal when there's a good trade.
These trend signals and alerts are derived from live data but the stability of our code allows it to not repaint.
Trend Pulse Pro allow you to easily determine the trend and will give you buy and sell entry levels.
Works on all markets on all time frames so it's suitable for scalpers, day and swing traders.
If you want more details, the link is in the signature.
Disclaimer:
Past performance is not indicative of future performance. No representation is being made that any results discussed within the service and its related media content will be achieved. All opinions, news, research, analyses, prices or other information is provided as general market commentary and not as investment advice. TradingWalk, their members, shareholders, employees, agents, representatives and resellers do not warrant the completeness, accuracy or timeliness of the information supplied, and they shall not be liable for any loss or damages, consequential or otherwise, which may arise from the use or reliance of the TradingWalk service and its content. © 2019 TradingWalk.
TradingWalk indicators are built for TradingView. TradingWalk is on no way a part of TradingView.

Price-Line Channel - A Friendly Support And Resistance IndicatorIntroduction
Lines are the most widely used figures in technical analysis, this is due to the linear trends that some securities posses (daily log SP500 for example), support and resistances are also responsible for the uses of lines, basically linear support and resistances are made with the assumption that the line connecting two local maximas or minimas will help the user detect a new local maxima or minima when the price will cross the line.
Technical indicators attempting to output lines have always been a concern in technical analysis, the mostly know certainly being the linear regression, however any linear models would fit in this category. In general those indicators always reevaluate their outputs values (repainting), others non repainting indicators returning lines are sometimes to impractical to set-up. This is what has encouraged me to make a simpler indicator based on the framework used in the recursive bands indicator that i published.
The proposed indicator aim to be extremely flexible and easy to use while returning linear support and resistances, an option that allow readjustment is also introduced, thus allowing for a "smarter" indicator.
The Indicator
The indicator return two extremities, the upper one aim to detect resistance points while the lower one aim to detect support points. The length setting control the steepness of the line, with higher values of length involving a lower slope, this make the indicator less reactive and interact with the price less often.
The name "price-line" comes from the fact that the channel is dependent on its own interaction with the price, therefore a breakout methodology can also be used, where price is up-trending when crossing with the upper extremity and down trending when crossing with the lower one.
Readjusted Option
The line steepness can be readjusted based on the market volatility, it make more sense for the line to be more steep when the market is more volatile, thus making it converge faster toward the price, this of course is done at the cost of some linearity. This is achieved by checking the "readjustment" option. The effects can be shown on BTCUSD, below the indicator without the readjusted option :
when the "readjustment" option is checked we have the following results :
The volatile down movement on BTCUSd make the upper extremity converge faster toward the price, this option can be great for volatile markets.
Conclusion
The recursive bands indicator prove to be an excellent framework that allow for the creation of lots of indicators, the proposed indicator is extremely efficient and provide an easy solution for returning linear support and resistances without much drawbacks, the readjusted option allow the indicator to adapt to the market volatility at the cost of linearity.
The performance of the indicator is relative to the motion of the price, however the indicator show signs of returning accurate support and resistances points. I hope the indicator find its use in the community.
Thanks for reading !
Note
Respect the house rules, always request permission before publishing open source code. This is an original work, requesting permission is the least you can do.

Volume Trailing IntegralAbout
This indicator is an attempt to quantify the volume of buying vs. selling in the last N bars. The hypothesis is that on upticks, there was more bull volume than bull volume, and vice versa. "Trailing Integral" refers to the fact that this indicator shows the sum of bear and bull volume in the last N bars, which is akin to an integral of money flow.
Method
To compute the bear vs. bull volume on a given day, the Z score of a price change is mapped to the volume. For example, for upticks, a highly negative Z score results in a ~50/50 bull/bear volume, while a highly positive Z score results in a ~(Max weighting)/(1-Max weighting) bull/bear volume (if max weighting is 0.8, then a large uptick results in 0.8V bull and 0.2V bear volume). Volume is then summed over the last N bars, where N is the length. EMAs are applied at various points to smooth things. Stdevs are calculated for upticks and downticks independently.
Usage
I like to use this like an enhanced OBV, with a smarter bias towards bull/bear ticks. Look first at the total volume and then look for follow through by bear/bull volume. For example, a rally on low volume, with bias towards bear volume is sellable; a bottom with more bull volume on consolidation is buyable, etc.

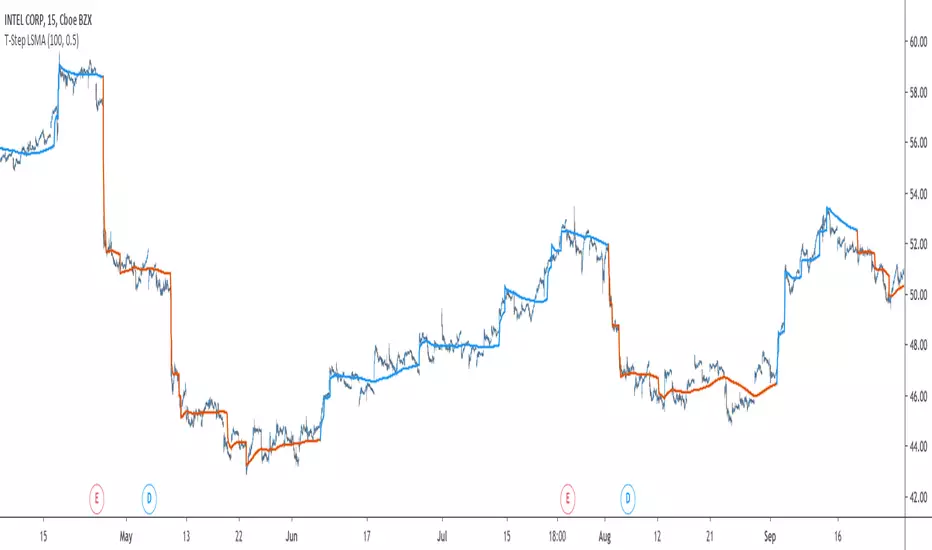
T-Step LSMAIntroduction
The trend step indicator family has produced much interest in the community, those indicators showed in certain cases robustness and reactivity. Their ease of use/interpretation is also a major advantage. Although those indicators have a relatively good fit with the input price, they can still be improved by introducing least-squares fitting on their calculations. This is why i propose a new indicator (T-Step LSMA) which aim to gather all the components of the trend-step indicator family (including the auto-line family).
The indicator will use as a threshold the mean absolute error between the input and the output (T-Channel) scaled with the efficiency ratio (Efficient Trend Step) while using least squares in order to provide a better fit with the price (Auto-Filter).
The Indicator
The interpretation of the indicator is easy, the indicator estimate an up-trending market when in blue, down-trending when in orange, the signal only depend on the trend-step part ( b in the code).
length control the period of the efficiency ratio as well as any components in the lsma calculation. The efficiency ratio allow to provide adaptivity, therefore the threshold will be lower when market is trending and higher when market is ranging.
Sc control the amount of feedback of the indicator, a value of 1 will use only the closing price as input, a value of 0.5 will use 50% of the closing price/indicator output as input, this allow to get smoother results.
It is possible to get the non-smooth version of the indicator by checking "No Smoothing".
This allow the indicator to filter more information.
Least Squares Smoothing - Benefits
One could ask why introducing least squares smoothing, there are several reasons to this choice, we have seen that trend-step indicators are boxy, they filter most of the variational information in the price, introducing least squares smoothing allow to gain back some of this variational information while providing a better fit with the price, the indicator is more noisy but also more practical in certain situations.
For example the indicator in its boxy form can't really be useful as input for other indicators, which is not the case with this version.
Relative strength index of period 14 using the proposed indicator as input.
Down-Sides
The indicator is dependent on the time frame used, larger time frames resulting in an indicator overfitting, sticking with lower time frames might be ideal. The indicator behavior might also change depending on the market in which it is applied.
Setting Up Alerts For The Indicator
Alerts conditions are already set, in order to create an alert based on the indicator follow these steps :
Go to the alert section (the alarm clock) -> create new alert -> select T-Step LSMA in condition -> Below select Up or Dn (Up for a up-trending alert and Dn for a down-trending alert)
In option select "once per bar close", change the message if you want a personalized message.
Conclusion
I don't think i'll post other indicators related to the trend-step framework for the time to comes, nonetheless the ones posted proven to have interesting results as well as many upsides. Although i don't think they would generate positive long-terms returns they could still be of use when using smarter volatility metrics as threshold. The proposed indicator conserve more information than its relatives and might find some use as input for other indicators.
Recommended Use Of The Code
Although i don't put restrictions on the code usage, i still recommend creative and pertinent changes to be made, graphical changes or any minor changes are not necessary, remember that such practice is disrespectful toward the author, you don't want to load up the tradingview servers for nothing right ?
Support Me
Making indicators sure is hard, it takes time and it can be quite lonely to, so i would love talking with you guys while making them :) There isn't better support than the one provided by your friends so drop me a message.
Linear Regression BotHello Fellow Traders!
-------------------------------------------
This is the newest addition to Gnome Alerts PRO!
This is a new trading method designed to take advantage of Linear Regression methods along with using price blocks to make smarter trades.
PineScript v4 allows us to get more creative from an indicator perspective and really make some neat stuff.
This Bot Script works on all Crypto, Leverage, Forex, & Traditional Exchanges.
FEATURES
------------------------
*Goat Alerts & Autoview Ready*
- Easy to Use
- DCA
- Avg Position Tracking
-Take Profit
- Stop Loss
You can get access to any of my scripts by visiting my Website, all links are down below....

Kaufman Adaptive Least Squares Moving AverageIntroduction
It is possible to use a wide variety of filters for the estimation of a least squares moving average, one of the them being the Kaufman adaptive moving average (KAMA) which adapt to the market trend strength, by using KAMA in an lsma we therefore allow for an adaptive low lag filter which might provide a smarter way to remove noise while preserving reactivity.
The Indicator
The lsma aim to minimize the sum of the squared residuals, paired with KAMA we obtain a great adaptive solution for smoothing while conserving reactivity. Length control the period of the efficiency ratio used in KAMA, higher values of length allow for overall smoother results. The pre-filtering option allow for even smoother results by using KAMA as input instead of the raw price.
The proposed indicator without pre-filtering in green, a simple moving average in orange, and a lsma with all of them length = 200. The proposed filter allow for fast and precise crosses with the moving average while eliminating major whipsaws.
Same setup with the pre-filtering option, the result are overall smoother.
Conclusion
The provided code allow for the implementation of any filter instead of KAMA, try using your own filters. Thanks for reading :)
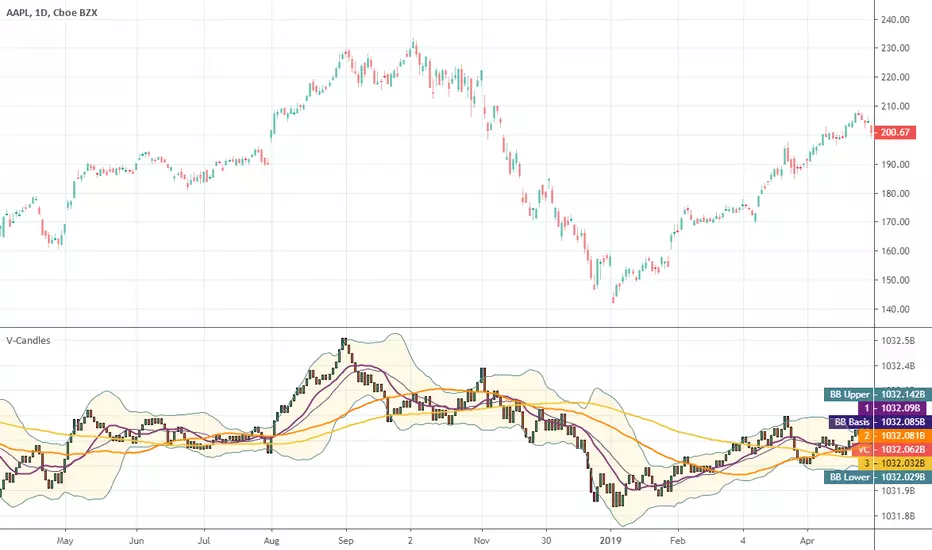
Volume CandlesHello traders!
Well, I was trying to implement EquiVolume Charts that were developed by Richard W. Arms, but unfortunately I got a poor result.
Instead, I used my groundwork on EquiVolumes to create Volume Candles indicator to help you make better, smarter trades.
What are the cool features?
Excellently filters the instrument's movements
Gives a better view of the accumulation/distribution phases
Completely removes price gaps
Works on ANY instrument that has available volume data.
Personally, I am a big fan of the volume-based indicators and to clarify my position I cite the following words of Buff Pelz Dormeier from his book "Investing with Volume Analysis: Identify, Follow, and Profit from Trends" :
A trade produces only two pieces of information: the price and price's neglected sibling, volume. Perhaps the least appreciated piece of the puzzle, volume represents fertile ground for technical analysis. Proficiency in volume analysis is a rare skill. Properly understood, though, volume analysis can provide its practitioner with the power to peer deeply into market mechanics.
Benjamin Graham, the father of value investing and a mentor of Warren Buffett, often called the market a 'voting machine'. If so, then volume is the ballot box. Volume is a literal illustration of the power behind the forces of supply and demand.
Volume is understood as the validation of price, the source of liquidity, the substantiation of information, the fulfillment of convictions, the revelation of divergent opinions, the fuel of the market, the proponent of truth, and the energy behind the velocity of money. If you believe any of this information might be important in making an investment decision, volume analysis is important to you.
I attached some screenshots to show you how it works with other instruments.
Happy Trading!
Kaufman Adaptive Moving AverageKaufman Adaptive Moving Average script.
This indicator was originally developed by Perry J. Kaufman (`Smarter Trading: Improving Performance in Changing Markets`, 1995).

zibi fib1So lets make thing smarter:)
ZIBI is volume indicator that i created which calculate prive volume per candle
it set buy point when it cross low fib =green
sell point when it cross down high fib
have fun
alerts inside

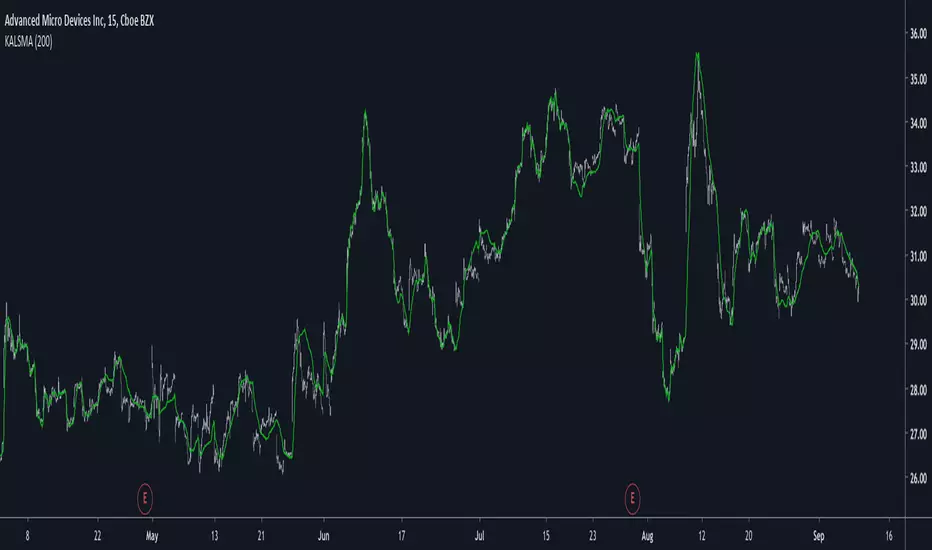
Kaufman Efficiency RateKaufman Efficiency Rate
The Efficiency Ratio (ER) was first presented by Perry Kaufman in his 1995 book ‘Smarter Trading‘.
It is calculated by dividing the price change over a period by the absolute sum of the price movements that occurred to achieve that change.
The resulting ratio ranges between 0 and 1 with higher values representing a more efficient or trending market.
The ER is actually very similar to the Chande Momentum Oscillator (CMO) presented by Tushar S. Chande in ‘The New Technical Trader‘ (1994).
The difference is that the CMO takes into account for market direction but if you take the absolute CMO and divide by 100 you you get the Efficiency Ratio.
A measure of a trends strength can be very useful as some strategies work best on a trending market and some in a range bound market.
Likewise different moving average lengths will perform better depending on the market type at that time.

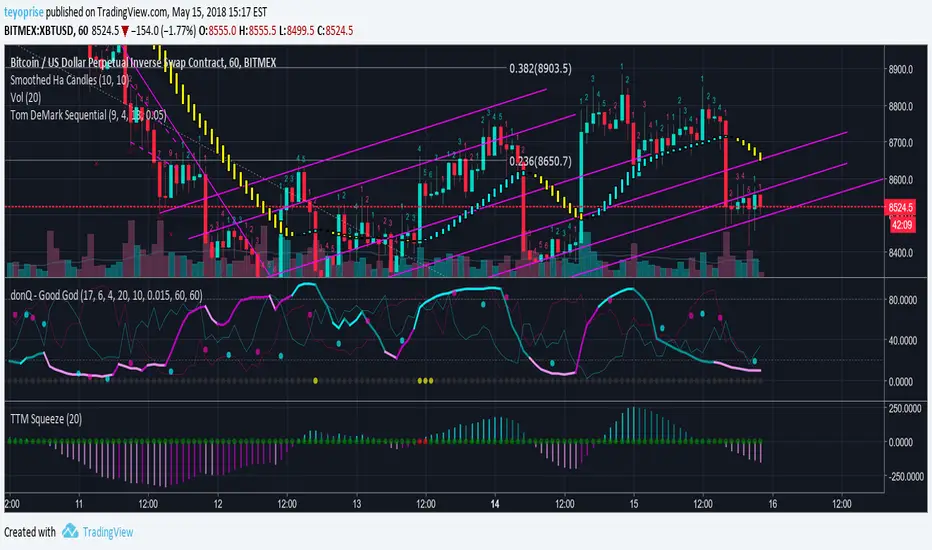
donQ - Good God
Godmode + TTM -4.50% Squeeze + Shorts and Longs (thin red and blue lines).
coming soon - distance to VWAP
- smarter buy sell logic with connection to shorts / longs / vwap / ttm -4.50%
have fun
donQ

donQ - Good GodGodmode + TTM Squeeze + Shorts and Longs (thin red and blue lines).
coming soon - distance to VWAP
- smarter buy sell logic with connection to shorts / longs / vwap / ttm
have fun
donQ
Gambit Trading Suite v3.0Gambit Trading Suite v3.0
New features:
* Better trading algorithms
* Every feature and candle color can now be fully customized
* Better RSI Divergence logic
* Built in trading alerts
* Cleaner code
& more!
The Gambit Trading Suite was designed to combine all of the best signals into one single indicator. This suite should tell you everything you need to know about price.
Try this indicator for FREE! Leave a comment below and we will give you access to the trading suite generally within 72 hours.
Quick Setup (after you have been granted access):
1. Navigate to any chart and right click on the background. Click on "Insert Indicator."
2. Click on "Invite-Only Scripts" and you will see the Gambit Trading Suite as an option. Click it to add it to your chart.
3. By default, the majority of the indicators are disabled. Click the gear icon to the right of the indicator name at the top left of your chart. It should be the second button after "Gambit Trading Suite v3.0."
4. After opening the config menu, you can enable whichever indicators you want.
(For the complete step-by-step setup guide & full indicator documentation, please send me a message)
Confirmed Reversals
These offer the best locations to buy/long with the least risk. The majority of the time they turn out to be the reversals from bearish price action. If the trade does not turn profitable immediately, the algorithm is designed to fail as soon as possible so you can close at breakeven or a very small loss. The profitable trades can be left to run. Over time and when stacked with other indicators, these entries can increase the profitability of your trades and reduce your losing ones. Confirmed Reversals on the chart show up as the letter C with an arrow upwards. They are blue in the example above.
Colored Candles
Helps you to see the strength of the trend in real-time, and helps you to make smarter trade entries and exits.
Bullish Breakout = Blue
Bullish Unconfirmed Reversal = Yellow
Bullish Trend (Weak) = Pistachio Green
Bullish Trend (Strong) = Lime Green
Bearish Breakdown = Dark Purple
Bearish Pivot (1 to 3 candles bearish bias) = Orange, shown with a downward arrow and the letter B on the chart. The signal fails if a future candle closes above the orange one.
Bearish Trend = Red
Stalled After Price Breakout = Olive Green
Neutral Pivot , Minor Bullish Bias = Bright Purple
Neutral / No Trend = Gray
Gambit Daily & Weekly Levels
These provide dynamically-updated daily and weekly support and resistance levels. It is very common to see price retest these levels, so it offers a decent place to set alarms or bids.
RSI Divergences
The Gambit Trading Suite posts green flags for bullish RSI divs, and red flags for bearish RSI divs. Both hidden and regular divergences are marked.
Gambit StochRSI Grid (This indicator is listed separately. Please visit my profile page to get it)
This indicator highlights StochRSI overbought/oversold values for 1D, 2H, 1H, & 30m timeframes (From top to bottom. Timeframes can be changed in settings).
If the lower three timeframes are all overbought/oversold, a direction arrow will show, suggesting the direction of the trend. By default, there are four available timeframes tracked, three of which are low timeframe and one is for a quick-glance at the 1D. Only the lower three are utilized for printing arrow signals.
Public indicators:
For your convenience, we have bundled the most commonly requested indicators inside the suite. They include:
Ichimoku Cloud (Optimized for the cryptocurrency markets by default but it can be optimized to any settings)
EMA #1 (Shown as purple and pink crosses in the example above)
EMA #2 (Shown as pink crosses)
Bollinger Bands
Pivot Points
For a detailed step-by-step setup guide & full documentation on the indicators, feel free to message me.

Candle CountingI was talking with one of the biggest hedge fund traders in the world the other day. He goes to me, "Brian, why don't you come and work for us, since you're a better trader than anyone at our firm?" Well I said I would, but there's no one there with an iq as high as mine, so I'd have no one to talk to when I'm eatin my sammiches. Man I'm a savant mate, I'm a f***ing CANDLE COUNTER. I tell people all the time, know your market. And that's your tip of the day really, I mean nobody out there knows Yen better than me. I mean the other day I was 70,000 in the hole, but I didn't get out, I was balls deep making a cheese sammich on the George Forman. Now I mean you can try and do what I'm doing, but understand something, I am 100% smarter than you, and your machines. In the industry, they call me Mr. Yen, I touch the sun, and my d*ck, regularly.

Gambit Trading Suite v2.49Gambit Trading Suite v2.49
The Gambit Trading Suite was designed to combine all of the best signals into one single indicator. This suite should tell you everything you need to know about price.
Try this indicator for FREE! Leave a comment below and we will give you access to the trading suite generally within 24 hours.
Quick Setup (after you have been granted access):
1. Navigate to any chart and right click on the background. Click on "Insert Indicator."
2. Click on "Invite-Only Scripts" and you will see the Gambit Trading Suite as an option. Click it to add it to your chart.
3. By default, the majority of the indicators are disabled. Click the gear icon to the right of the indicator name at the top left of your chart. It should be the second button after "Gambit Trading Suite v2.49."
4. After opening the config menu, you can enable whichever indicators you want.
(For the complete step-by-step setup guide & full indicator documentation, please send me a message)
Private indicators:
Confirmed Reversals
These offer the best locations to buy/long with the least risk. The majority of the time they turn out to be the reversals from bearish price action. If the trade does not turn profitable immediately, the algorithm is designed to fail as soon as possible so you can close at breakeven or a very small loss. The profitable trades can be left to run. Over time and when stacked with other indicators, these entries can increase the profitability of your trades and reduce your losing ones.
Colored Candles
Helps you to see the strength of the trend in real-time, and helps you to make smarter trade entries and exits.
Bullish Breakout = Blue
Bullish Unconfirmed Reversal = Yellow
Bullish Trend (Weak) = Pistachio Green
Bullish Trend (Strong) = Lime Green
Bearish Breakdown = Dark Purple
Bearish Pivot (1 to 3 candles bearish bias) = Orange
Bearish Trend = Red
Stalled After Price Breakout = Olive Green
Neutral Pivot, Minor Bullish Bias = Bright Purple
Neutral / No Trend = Gray
Daily & Weekly S&R Levels
These provide dynamically-updated daily and weekly support and resistance levels. It is very common to see price retest these levels, so it offers a decent place to set alarms or bids.
Candle Structure Labeling
For newer traders, we offer the ability to have every candle automatically labeled by its structure, whether it is a bullish harami, bearish engulfing, etc. We also offer a small bar at the bottom for price hints so you can see a quick summary of whether the current candle is bullish or bearish.
RSI Divergences
The Gambit Trading Suite posts green flags for bullish RSI divs, and red flags for bearish RSI divs. Both hidden and regular divergences are marked.
Gambit StochRSI Grid (This indicator is listed separately. Please visit my profile page to get it)
This indicator highlights StochRSI overbought/oversold values for 1D, 2H, 1H, & 30m timeframes (From top to bottom. Timeframes can be changed in settings).
If the lower three timeframes are all overbought/oversold, a direction arrow will show, suggesting the direction of the trend. By default, there are four available timeframes tracked, three of which are low timeframe and one is for a quick-glance at the 1D. Only the lower three are utilized for printing arrow signals.
Public indicators:
For your convenience, we have bundled the most commonly requested indicators inside the Gambit suite in order to allow you to get up to 10 indicators enabled at once. The public included indicators are:
Ichimoku Cloud
EMA #1
EMA #2
Bollinger Bands
Pivot Points
For a detailed step-by-step setup guide and complete documentation on the indicators (as well as best practices on how to use the Gambit Trading Suite), feel free message me.
Leave a comment below to try the Gambit Trading Suite for FREE.
