T-Step LSMAIntroduction
The trend step indicator family has produced much interest in the community, those indicators showed in certain cases robustness and reactivity. Their ease of use/interpretation is also a major advantage. Although those indicators have a relatively good fit with the input price, they can still be improved by introducing least-squares fitting on their calculations. This is why i propose a new indicator (T-Step LSMA) which aim to gather all the components of the trend-step indicator family (including the auto-line family).
The indicator will use as a threshold the mean absolute error between the input and the output (T-Channel) scaled with the efficiency ratio (Efficient Trend Step) while using least squares in order to provide a better fit with the price (Auto-Filter).
The Indicator
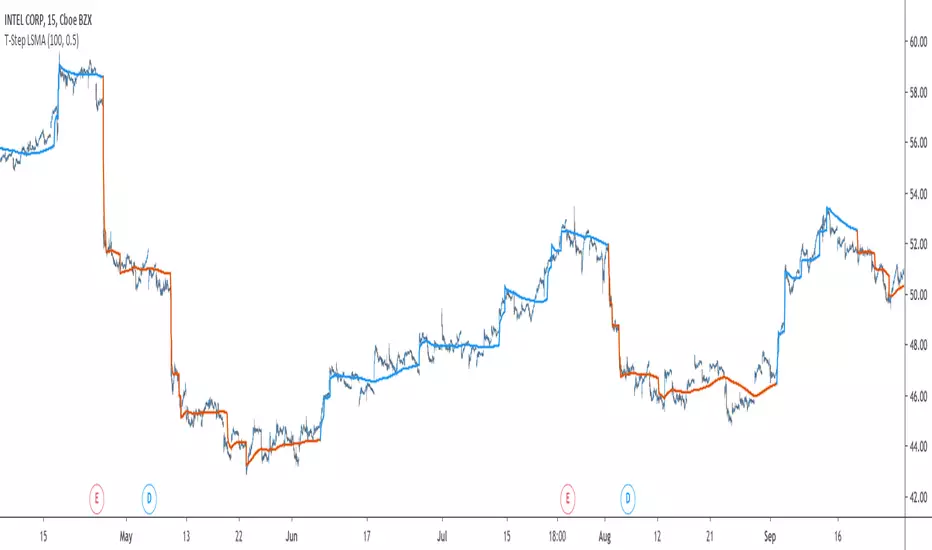
The interpretation of the indicator is easy, the indicator estimate an up-trending market when in blue, down-trending when in orange, the signal only depend on the trend-step part ( b in the code).
length control the period of the efficiency ratio as well as any components in the lsma calculation. The efficiency ratio allow to provide adaptivity, therefore the threshold will be lower when market is trending and higher when market is ranging.
Sc control the amount of feedback of the indicator, a value of 1 will use only the closing price as input, a value of 0.5 will use 50% of the closing price/indicator output as input, this allow to get smoother results.
It is possible to get the non-smooth version of the indicator by checking "No Smoothing".
This allow the indicator to filter more information.
Least Squares Smoothing - Benefits
One could ask why introducing least squares smoothing, there are several reasons to this choice, we have seen that trend-step indicators are boxy, they filter most of the variational information in the price, introducing least squares smoothing allow to gain back some of this variational information while providing a better fit with the price, the indicator is more noisy but also more practical in certain situations.
For example the indicator in its boxy form can't really be useful as input for other indicators, which is not the case with this version.
Relative strength index of period 14 using the proposed indicator as input.
Down-Sides
The indicator is dependent on the time frame used, larger time frames resulting in an indicator overfitting, sticking with lower time frames might be ideal. The indicator behavior might also change depending on the market in which it is applied.
Setting Up Alerts For The Indicator
Alerts conditions are already set, in order to create an alert based on the indicator follow these steps :
Go to the alert section (the alarm clock) -> create new alert -> select T-Step LSMA in condition -> Below select Up or Dn (Up for a up-trending alert and Dn for a down-trending alert)
In option select "once per bar close", change the message if you want a personalized message.
Conclusion
I don't think i'll post other indicators related to the trend-step framework for the time to comes, nonetheless the ones posted proven to have interesting results as well as many upsides. Although i don't think they would generate positive long-terms returns they could still be of use when using smarter volatility metrics as threshold. The proposed indicator conserve more information than its relatives and might find some use as input for other indicators.
Recommended Use Of The Code
Although i don't put restrictions on the code usage, i still recommend creative and pertinent changes to be made, graphical changes or any minor changes are not necessary, remember that such practice is disrespectful toward the author, you don't want to load up the tradingview servers for nothing right ?
Support Me
Making indicators sure is hard, it takes time and it can be quite lonely to, so i would love talking with you guys while making them :) There isn't better support than the one provided by your friends so drop me a message.
在腳本中搜尋"smart"
Linear Regression BotHello Fellow Traders!
-------------------------------------------
This is the newest addition to Gnome Alerts PRO!
This is a new trading method designed to take advantage of Linear Regression methods along with using price blocks to make smarter trades.
PineScript v4 allows us to get more creative from an indicator perspective and really make some neat stuff.
This Bot Script works on all Crypto, Leverage, Forex, & Traditional Exchanges.
FEATURES
------------------------
*Goat Alerts & Autoview Ready*
- Easy to Use
- DCA
- Avg Position Tracking
-Take Profit
- Stop Loss
You can get access to any of my scripts by visiting my Website, all links are down below....

Kaufman Adaptive Least Squares Moving AverageIntroduction
It is possible to use a wide variety of filters for the estimation of a least squares moving average, one of the them being the Kaufman adaptive moving average (KAMA) which adapt to the market trend strength, by using KAMA in an lsma we therefore allow for an adaptive low lag filter which might provide a smarter way to remove noise while preserving reactivity.
The Indicator
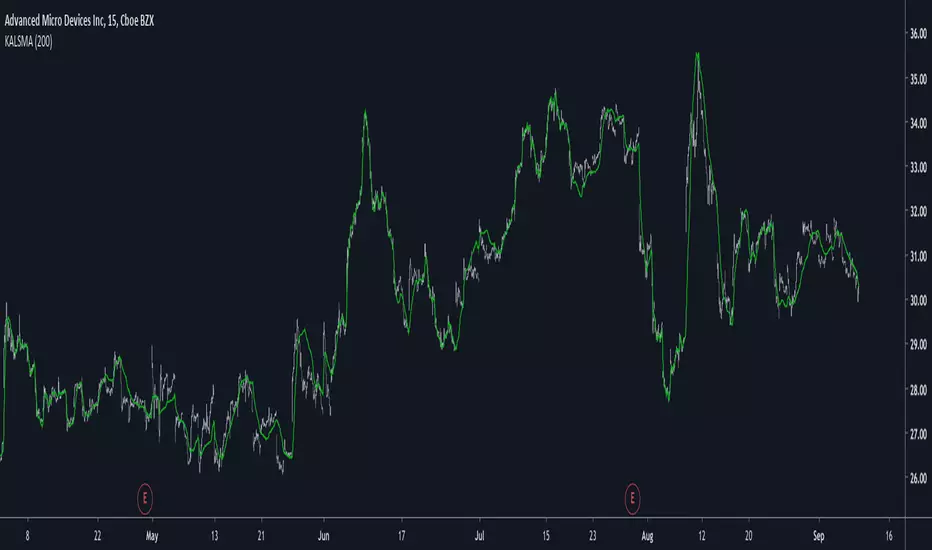
The lsma aim to minimize the sum of the squared residuals, paired with KAMA we obtain a great adaptive solution for smoothing while conserving reactivity. Length control the period of the efficiency ratio used in KAMA, higher values of length allow for overall smoother results. The pre-filtering option allow for even smoother results by using KAMA as input instead of the raw price.
The proposed indicator without pre-filtering in green, a simple moving average in orange, and a lsma with all of them length = 200. The proposed filter allow for fast and precise crosses with the moving average while eliminating major whipsaws.
Same setup with the pre-filtering option, the result are overall smoother.
Conclusion
The provided code allow for the implementation of any filter instead of KAMA, try using your own filters. Thanks for reading :)
Volume CandlesHello traders!
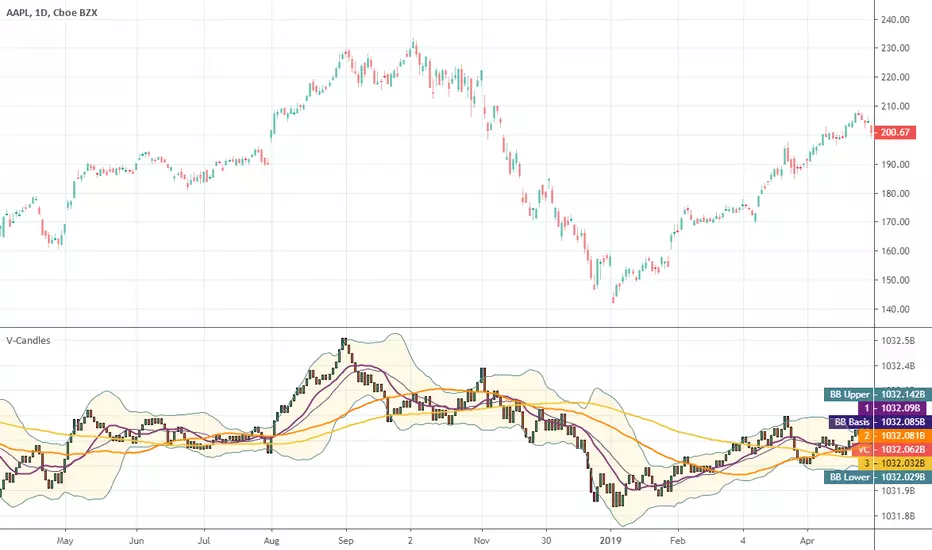
Well, I was trying to implement EquiVolume Charts that were developed by Richard W. Arms, but unfortunately I got a poor result.
Instead, I used my groundwork on EquiVolumes to create Volume Candles indicator to help you make better, smarter trades.
What are the cool features?
Excellently filters the instrument's movements
Gives a better view of the accumulation/distribution phases
Completely removes price gaps
Works on ANY instrument that has available volume data.
Personally, I am a big fan of the volume-based indicators and to clarify my position I cite the following words of Buff Pelz Dormeier from his book "Investing with Volume Analysis: Identify, Follow, and Profit from Trends" :
A trade produces only two pieces of information: the price and price's neglected sibling, volume. Perhaps the least appreciated piece of the puzzle, volume represents fertile ground for technical analysis. Proficiency in volume analysis is a rare skill. Properly understood, though, volume analysis can provide its practitioner with the power to peer deeply into market mechanics.
Benjamin Graham, the father of value investing and a mentor of Warren Buffett, often called the market a 'voting machine'. If so, then volume is the ballot box. Volume is a literal illustration of the power behind the forces of supply and demand.
Volume is understood as the validation of price, the source of liquidity, the substantiation of information, the fulfillment of convictions, the revelation of divergent opinions, the fuel of the market, the proponent of truth, and the energy behind the velocity of money. If you believe any of this information might be important in making an investment decision, volume analysis is important to you.
I attached some screenshots to show you how it works with other instruments.
Happy Trading!
Kaufman Adaptive Moving AverageKaufman Adaptive Moving Average script.
This indicator was originally developed by Perry J. Kaufman (`Smarter Trading: Improving Performance in Changing Markets`, 1995).

zibi fib1So lets make thing smarter:)
ZIBI is volume indicator that i created which calculate prive volume per candle
it set buy point when it cross low fib =green
sell point when it cross down high fib
have fun
alerts inside

Kaufman Efficiency RateKaufman Efficiency Rate
The Efficiency Ratio (ER) was first presented by Perry Kaufman in his 1995 book ‘Smarter Trading‘.
It is calculated by dividing the price change over a period by the absolute sum of the price movements that occurred to achieve that change.
The resulting ratio ranges between 0 and 1 with higher values representing a more efficient or trending market.
The ER is actually very similar to the Chande Momentum Oscillator (CMO) presented by Tushar S. Chande in ‘The New Technical Trader‘ (1994).
The difference is that the CMO takes into account for market direction but if you take the absolute CMO and divide by 100 you you get the Efficiency Ratio.
A measure of a trends strength can be very useful as some strategies work best on a trending market and some in a range bound market.
Likewise different moving average lengths will perform better depending on the market type at that time.

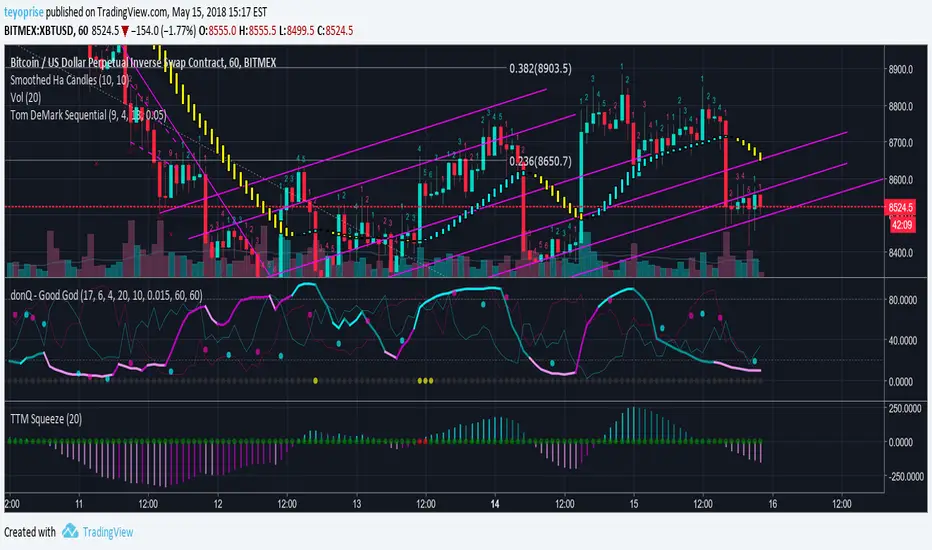
donQ - Good God
Godmode + TTM -4.50% Squeeze + Shorts and Longs (thin red and blue lines).
coming soon - distance to VWAP
- smarter buy sell logic with connection to shorts / longs / vwap / ttm -4.50%
have fun
donQ

donQ - Good GodGodmode + TTM Squeeze + Shorts and Longs (thin red and blue lines).
coming soon - distance to VWAP
- smarter buy sell logic with connection to shorts / longs / vwap / ttm
have fun
donQ
Gambit Trading Suite v3.0Gambit Trading Suite v3.0
New features:
* Better trading algorithms
* Every feature and candle color can now be fully customized
* Better RSI Divergence logic
* Built in trading alerts
* Cleaner code
& more!
The Gambit Trading Suite was designed to combine all of the best signals into one single indicator. This suite should tell you everything you need to know about price.
Try this indicator for FREE! Leave a comment below and we will give you access to the trading suite generally within 72 hours.
Quick Setup (after you have been granted access):
1. Navigate to any chart and right click on the background. Click on "Insert Indicator."
2. Click on "Invite-Only Scripts" and you will see the Gambit Trading Suite as an option. Click it to add it to your chart.
3. By default, the majority of the indicators are disabled. Click the gear icon to the right of the indicator name at the top left of your chart. It should be the second button after "Gambit Trading Suite v3.0."
4. After opening the config menu, you can enable whichever indicators you want.
(For the complete step-by-step setup guide & full indicator documentation, please send me a message)
Confirmed Reversals
These offer the best locations to buy/long with the least risk. The majority of the time they turn out to be the reversals from bearish price action. If the trade does not turn profitable immediately, the algorithm is designed to fail as soon as possible so you can close at breakeven or a very small loss. The profitable trades can be left to run. Over time and when stacked with other indicators, these entries can increase the profitability of your trades and reduce your losing ones. Confirmed Reversals on the chart show up as the letter C with an arrow upwards. They are blue in the example above.
Colored Candles
Helps you to see the strength of the trend in real-time, and helps you to make smarter trade entries and exits.
Bullish Breakout = Blue
Bullish Unconfirmed Reversal = Yellow
Bullish Trend (Weak) = Pistachio Green
Bullish Trend (Strong) = Lime Green
Bearish Breakdown = Dark Purple
Bearish Pivot (1 to 3 candles bearish bias) = Orange, shown with a downward arrow and the letter B on the chart. The signal fails if a future candle closes above the orange one.
Bearish Trend = Red
Stalled After Price Breakout = Olive Green
Neutral Pivot , Minor Bullish Bias = Bright Purple
Neutral / No Trend = Gray
Gambit Daily & Weekly Levels
These provide dynamically-updated daily and weekly support and resistance levels. It is very common to see price retest these levels, so it offers a decent place to set alarms or bids.
RSI Divergences
The Gambit Trading Suite posts green flags for bullish RSI divs, and red flags for bearish RSI divs. Both hidden and regular divergences are marked.
Gambit StochRSI Grid (This indicator is listed separately. Please visit my profile page to get it)
This indicator highlights StochRSI overbought/oversold values for 1D, 2H, 1H, & 30m timeframes (From top to bottom. Timeframes can be changed in settings).
If the lower three timeframes are all overbought/oversold, a direction arrow will show, suggesting the direction of the trend. By default, there are four available timeframes tracked, three of which are low timeframe and one is for a quick-glance at the 1D. Only the lower three are utilized for printing arrow signals.
Public indicators:
For your convenience, we have bundled the most commonly requested indicators inside the suite. They include:
Ichimoku Cloud (Optimized for the cryptocurrency markets by default but it can be optimized to any settings)
EMA #1 (Shown as purple and pink crosses in the example above)
EMA #2 (Shown as pink crosses)
Bollinger Bands
Pivot Points
For a detailed step-by-step setup guide & full documentation on the indicators, feel free to message me.

Candle CountingI was talking with one of the biggest hedge fund traders in the world the other day. He goes to me, "Brian, why don't you come and work for us, since you're a better trader than anyone at our firm?" Well I said I would, but there's no one there with an iq as high as mine, so I'd have no one to talk to when I'm eatin my sammiches. Man I'm a savant mate, I'm a f***ing CANDLE COUNTER. I tell people all the time, know your market. And that's your tip of the day really, I mean nobody out there knows Yen better than me. I mean the other day I was 70,000 in the hole, but I didn't get out, I was balls deep making a cheese sammich on the George Forman. Now I mean you can try and do what I'm doing, but understand something, I am 100% smarter than you, and your machines. In the industry, they call me Mr. Yen, I touch the sun, and my d*ck, regularly.

Gambit Trading Suite v2.49Gambit Trading Suite v2.49
The Gambit Trading Suite was designed to combine all of the best signals into one single indicator. This suite should tell you everything you need to know about price.
Try this indicator for FREE! Leave a comment below and we will give you access to the trading suite generally within 24 hours.
Quick Setup (after you have been granted access):
1. Navigate to any chart and right click on the background. Click on "Insert Indicator."
2. Click on "Invite-Only Scripts" and you will see the Gambit Trading Suite as an option. Click it to add it to your chart.
3. By default, the majority of the indicators are disabled. Click the gear icon to the right of the indicator name at the top left of your chart. It should be the second button after "Gambit Trading Suite v2.49."
4. After opening the config menu, you can enable whichever indicators you want.
(For the complete step-by-step setup guide & full indicator documentation, please send me a message)
Private indicators:
Confirmed Reversals
These offer the best locations to buy/long with the least risk. The majority of the time they turn out to be the reversals from bearish price action. If the trade does not turn profitable immediately, the algorithm is designed to fail as soon as possible so you can close at breakeven or a very small loss. The profitable trades can be left to run. Over time and when stacked with other indicators, these entries can increase the profitability of your trades and reduce your losing ones.
Colored Candles
Helps you to see the strength of the trend in real-time, and helps you to make smarter trade entries and exits.
Bullish Breakout = Blue
Bullish Unconfirmed Reversal = Yellow
Bullish Trend (Weak) = Pistachio Green
Bullish Trend (Strong) = Lime Green
Bearish Breakdown = Dark Purple
Bearish Pivot (1 to 3 candles bearish bias) = Orange
Bearish Trend = Red
Stalled After Price Breakout = Olive Green
Neutral Pivot, Minor Bullish Bias = Bright Purple
Neutral / No Trend = Gray
Daily & Weekly S&R Levels
These provide dynamically-updated daily and weekly support and resistance levels. It is very common to see price retest these levels, so it offers a decent place to set alarms or bids.
Candle Structure Labeling
For newer traders, we offer the ability to have every candle automatically labeled by its structure, whether it is a bullish harami, bearish engulfing, etc. We also offer a small bar at the bottom for price hints so you can see a quick summary of whether the current candle is bullish or bearish.
RSI Divergences
The Gambit Trading Suite posts green flags for bullish RSI divs, and red flags for bearish RSI divs. Both hidden and regular divergences are marked.
Gambit StochRSI Grid (This indicator is listed separately. Please visit my profile page to get it)
This indicator highlights StochRSI overbought/oversold values for 1D, 2H, 1H, & 30m timeframes (From top to bottom. Timeframes can be changed in settings).
If the lower three timeframes are all overbought/oversold, a direction arrow will show, suggesting the direction of the trend. By default, there are four available timeframes tracked, three of which are low timeframe and one is for a quick-glance at the 1D. Only the lower three are utilized for printing arrow signals.
Public indicators:
For your convenience, we have bundled the most commonly requested indicators inside the Gambit suite in order to allow you to get up to 10 indicators enabled at once. The public included indicators are:
Ichimoku Cloud
EMA #1
EMA #2
Bollinger Bands
Pivot Points
For a detailed step-by-step setup guide and complete documentation on the indicators (as well as best practices on how to use the Gambit Trading Suite), feel free message me.
Leave a comment below to try the Gambit Trading Suite for FREE.

Binary 15 V1 w/ AlertsSo this is my first time coding Pinescript. I used bits and pieces of idea from smarter people like JustUncle, uscgears and Chris Moody.
I then combined bits and pieces and came with my own criteria for Binary Options.
Please use and provide feedback.
Rules:
Fuschia Bar: Sell for next available 15 min expiry
Yellow Bar: Buy for next available 15 min expiry
Notes:
When Stoch is OB/OS avoid trade
Alert Capable
Avoid trading in low volume times or during new releases

🍒👽 | T | P | Q | 👽🍒🍒 T P Q is your tool for anticipating the macro market context, marking the intervals studied by Daye, with an in-depth analysis of quarterly cycles. With this indicator, you not only trade the day but also understand how it fits into the flow over longer timeframes.
What TPQ does for you:
- Liquidity Intervals: Marks quarterly intervals for Asia, London, New York AM and New York PM.
- Multifaceted Analysis: In addition to day sessions, it allows for a complete visualization, with 90-minute cycles within daily sessions and even 22/23-minute microcycles.
- AMD Synergy: Ideal for visualizing AMD/XAMD and understanding the Smart Money Technique (SMT) between cycles more clearly.
- Countdown: Includes a countdown table for all recorded quarterly cycles.
👽 Key Benefit: Structure your macro view into quarterly cycles and anticipate Smart Money Technique (SMT) between cycles with superior clarity.
❗️❗️❗️ Important Notice: This indicator is a visualization tool and does not provide trading recommendations. Prior knowledge of ICT concepts is required to use it effectively.

KML ALGO V6 – Elite Trading Bot🚀 KML ALGO - Professional Trading Bot by Ahmad Shoaib Kamal
💎 PREMIUM FEATURES:
• Advanced ATR Trailing Stop Algorithm
• Multi-Filter Smart System (RSI, MACD, Stochastic, Volume, Trend)
• Intelligent Scoring System for High-Quality Signals
• Universal: Works on ALL Markets & Timeframes
• Live Information Dashboard
• Professional Alert System
⚡️ WHAT MAKES IT SPECIAL:
✅ Eliminates False Signals with 5-Filter Validation
✅ Adaptive to Market Conditions
✅ Clean Visual Interface with Color-Coded Signals
✅ Real-time Performance Metrics
✅ Fully Customizable Parameters
✅ Works on Crypto, Forex, Stocks, Indices...
🎯 PERFECT FOR:
• Day Traders seeking precise entries/exits
• Swing Traders looking for trend confirmation
• Automated Trading Systems
• Professional Portfolio Management
⚙️ CUSTOMIZABLE SETTINGS:
• Key Value (Signal Sensitivity)
• ATR Period Configuration
• Enable/Disable Any Filter
• Fine-tune All Parameters
• Heikin Ashi Support
🎨 PROFESSIONAL DISPLAY:
• Dynamic Trailing Stop Line
• Clear BUY/SELL Labels
• Weak Signal Indicators
• Live Stats Table
• Smart Alerts
⭐️ DEVELOPED BY: Ahmad Shoaib Kamal
🔥 BATTLE-TESTED ALGORITHM
💰 INVITE-ONLY ACCESS
👉 “Exclusive Access – Apply Now to Unlock Premium Features”
Perfect for Crypto, Forex, Stocks & Indices traders seeking high-accuracy signals with ATR, RSI, MACD, Stochastic, Volume & Trend analysis.

Guppy EMA Promax V 2.1 [NMTUAN] TradingView Indicator: A Comprehensive Market Analysis Tool
Authored by NMTUAN, this all-in-one indicator is designed to provide traders with a holistic and actionable view of the market. Instead of relying on a dozen different tools, this single indicator consolidates the most crucial aspects of technical analysis to help you make more informed and confident trading decisions.
Key Features:
Smart Money Concepts (SMC) Levels: Our indicator automatically identifies key support and resistance levels based on the principles of Smart Money Concepts. This helps you spot where institutions and large players are likely to enter or exit the market, giving you a strategic edge.
Trend and Trendline Analysis: Gain a clear understanding of the market's direction with integrated trend identification and automated trendlines. This feature helps you quickly visualize the prevailing market momentum and potential areas of interest.
Volatility and Volume Insights: We've included Average True Range (ATR) to measure market volatility and Volume analysis to confirm the strength of price movements. These two metrics are essential for validating potential breakouts and reversals.
Skully ATR Stoploss LevelsA comprehensive ATR-based stop loss indicator designed for precise risk management across all trading styles.
✨ KEY FEATURES:
- Live Price Levels: Display up to 3 real-time stop loss lines above/below current candle
- Historical Analysis: Scroll back to see ATR levels at any historical candle
- Triple ATR System: Three customizable ATR multipliers (1.0x, 1.5x, 2.0x default)
- Long/Short Separation: Independent controls for bullish and bearish setups
- Clean Interface: Minimal visual clutter with smart default settings
🎯 PERFECT FOR:
- Swing traders setting daily/weekly stops
- Day traders needing quick, precise risk management
- Position sizing based on volatility
- Multi-timeframe stop analysis (customizable in settings)
📊 HOW IT WORKS:
The indicator calculates Average True Range over your chosen period and displays stop loss levels at 1x, 1.5x, and 2x ATR distances (also customizable). Toggle individual levels on/off, and use historical steplines to analyze/backtest past setups.
⚙️ SMART DEFAULTS:
- Only ATR1 Long Level (Live Price) visible by default (to keep charts clean)
- Historical data available but invisible until needed
- Works across any timeframe and asset class
- Default colors will display cleanly on both Dark and Light charts
Perfect for traders who want professional-grade stop placement without chart clutter.

Parabolic CCI Pro — Long & Short + ATR Risk — [AlphaFinansData]English Description (Enhanced)
🔹 CCI + Parabolic SAR Strategy (Long & Short, Smart Risk Management)
This indicator combines the power of CCI (Commodity Channel Index) and Parabolic SAR, creating a highly reliable trading system that adapts to market conditions.
🚀 How It Works:
Trend Hunting: CCI detects weakening momentum and potential reversal zones.
Confirmation: Parabolic SAR confirms the trend direction, reducing false signals.
Smart Risk Management: Offers both fixed-percentage and ATR-based dynamic Stop Loss & Take Profit, adjusting to volatility automatically.
Performance Dashboard: Tracks win rate, average profit/loss, max drawdown, and winning/losing streaks for deeper strategy insights.
⚡ Who Is It For?
Day traders looking for quick entries and exits,
Swing traders seeking to capture trend reversals,
Risk-conscious investors who want disciplined SL/TP management.
💡 More than just a signal generator, this indicator provides traders with a structured trading framework that helps maintain consistency and discipline.

Buyside & Sellside Liquidity by Abu-sarahThe Liquidity Zones Indicator is built to automatically identify and visualize one of the core foundations of smart money trading: liquidity pools and levels.
These are areas on the chart where clusters of orders are typically positioned – such as stop losses above highs (buyside) or below lows (sellside). Recognizing these levels can help traders anticipate where price might gravitate to, reverse, or continue its movement.
🔶 SETTINGS
🔹 Liquidity Levels
Detection Length: Number of candles used to scan and define swing points.
Margin: Adjusts how sensitive the script is when confirming a liquidity level.
🔹 Liquidity Zones
Buyside Liquidity: Activates zones above repeated highs.
Sellside Liquidity: Activates zones below repeated lows.
Margin & Colors: Fully customizable width and color display for both buyside and sellside areas.
🔹 Liquidity Voids
Option to highlight imbalances (FVGs) both bullish and bearish.
Labels can be enabled to clearly tag voids for quick recognition.
🔹 Display Options
Mode: Choose between Present (last 500 bars focus) or Historical (full chart scan).
Visible Levels: Control how many liquidity areas are shown at once.
🔶 HOW IT WORKS
Liquidity, in simple terms, is the presence of pending orders at certain price levels.
Buyside Liquidity (BLIQ): typically above swing highs, where short sellers’ stops rest.
Sellside Liquidity (SLIQ): typically under swing lows, where long traders’ stops are placed.
When price sweeps through these pools, two common reactions occur:
Reversal: Price clears liquidity then snaps back in the opposite direction.
Continuation: Price breaks through, retests, and extends further in the same direction.
Additionally, Liquidity Voids (imbalances) appear as strong displacement candles with little to no wicks, signaling inefficient trading ranges. Such gaps are often revisited and filled later by price action.
🔶 DETAILS
Helps traders spot stop hunts & fakeouts.
Shows where institutions & smart money are likely targeting orders.
Zones can double as support/resistance and provide setups for entries/exits.
Fully customizable visuals for better chart readability.
تم تصميم هذا المؤشر ليكشف بشكل تلقائي ويعرض أحد أهم مفاهيم التداول بالمال الذكي: مناطق السيولة (Liquidity Pools & Levels).
هذه المناطق تمثل تجمعات أوامر السوق المخفية، مثل أوامر إيقاف الخسارة (Stops) المتمركزة غالبًا فوق القمم (سيولة شرائية) أو تحت القيعان (سيولة بيعية). معرفة أماكنها تمنح المتداول ميزة في توقّع الأماكن التي قد ينجذب إليها السعر ويحدث عندها اختراق أو ارتداد قوي.
🔶 الإعدادات
🔹 مستويات السيولة
طول الكشف (Detection Length): عدد الشموع المستخدمة لمسح وتحديد القمم والقيعان.
الهامش (Margin): يحدد مدى حساسية المؤشر عند تأكيد المستوى.
🔹 مناطق السيولة (Liquidity Zones)
سيولة شرائية (Buyside): تفعل إظهار المناطق أعلى القمم المتكررة.
سيولة بيعية (Sellside): تفعل إظهار المناطق أسفل القيعان المتكررة.
الهامش والألوان: تحكم كامل في عرض الحدود ولون المناطق.
🔹 فجوات السيولة (Liquidity Voids)
خيار تفعيل كشف الفجوات السعرية غير المتوازنة (FVG) الصاعدة والهابطة.
إمكانية إظهار ملصق (Label) لتوضيح أماكن الفجوات بشكل مباشر.
🔹 خيارات العرض
الوضع (Mode):
الحالي (Present): يركز على آخر 500 شمعة.
التاريخي (Historical): يفحص كامل البيانات المتوفرة على الشارت.
عدد المستويات المرئية: لتحديد كم منطقة سيولة تظهر على الرسم.
🔶 آلية عمل المؤشر
ببساطة، السيولة تعني وجود أوامر معلقة عند مستويات سعرية محددة.
سيولة شرائية (Buyside): غالبًا فوق القمم حيث يتمركز ستوبات البائعين.
سيولة بيعية (Sellside): غالبًا تحت القيعان حيث يتمركز ستوبات المشترين.
عند ضرب السعر لهذه المستويات قد يحدث:
انعكاس (Reversal): السعر يخترق المنطقة سريعًا ثم ينعكس بالاتجاه المعاكس.
استمرار (Continuation): المنطقة تنكسر ويعيد السعر اختبارها ثم يكمل بنفس الاتجاه.
أما فجوات السيولة (Voids/FVGs) فتظهر كشموع قوية متتالية دون ذيول واضحة، مما يشير إلى حركة غير متوازنة غالبًا يعود إليها السعر لاحقًا لملئها.
🔶 التفاصيل
يساعد على رصد الاختراقات الوهمية (Stop Hunt).
يكشف مناطق تجميع أو توزيع المؤسسات والبنوك.
المناطق المرسومة يمكن أن تعمل كـ دعم/مقاومة ذكية.
قابل للتخصيص من حيث الشكل والألوان لتوضيح القراءة على الشارت.
🔶 التنبيهات
يمكن ضبط المؤشر لإرسال تنبيه عند:
اكتشاف/تحديث مستوى سيولة جديد.
اختراق أو كسر منطقة سيولة قائمة.
📌 للمزيد من الشروحات والتحديثات اليومية:
👉 Radar Channel
🔖 هاشتاقات:
#السيولة #التداول #الفوليوم #المؤسسات #SMC #الفوركس #الاسهم #الكريبتو #Options #ICT #Radar

OB old version by triummWhat is an Order Block?
In Smart Money Concepts (SMC), an order block (OB) is the last bullish or bearish candle before a strong impulsive move that breaks structure.
A Bullish OB → the last down candle before price moves strongly up.
A Bearish OB → the last up candle before price moves strongly down.
Order blocks represent areas where institutions or “smart money” placed large buy/sell orders.
🔹 What is a Volume Order Block?
A Volume Order Block adds a volume filter to standard order blocks.
Instead of just marking any OB, it highlights only those that are confirmed by abnormally high trading volume.
📌 Logic:
When banks/institutions create OBs, they usually inject big volume into the market.
Regular OBs may appear everywhere, but volume-based OBs filter out weak ones.
🔹 How to Identify a Volume Order Block
Find the OB normally (last opposite candle before strong move).
Check volume of that OB candle:
If volume is above average → strong OB (institutions active).
If volume is low/normal → weak OB (likely to fail).
🔹 Why Volume OB is Better
Filters fake OBs → many OBs form, but not all are institutional.
Higher probability zones → when price revisits that OB, it’s more likely to respect it.
Confluence with liquidity → strong OB + high volume often means liquidity grab + institutional entry.
🔹 Example (Bullish Volume OB)
Price is in a downtrend.
A bearish candle with unusually high volume forms.
Immediately after, price pushes up strongly, breaking structure.
That bearish candle is now a bullish volume order block.
When price returns to that level → strong buy reaction expected.
🔹 How Traders Use Volume OBs
Entries → wait for price to revisit the OB + volume support.
Stop Loss → usually below (bullish OB) or above (bearish OB).
Target → next liquidity pool, FVG, or imbalance.
Filtering → ignore OBs with low volume → less clutter on chart.
✅ In short:
A Volume Order Block = A normal OB + confirmed by unusually high volume.
It gives you higher quality supply & demand zones backed by institutional activity.

Dr. Curry Range Break# 🚀 DR. CURRY RANGE BREAK - QUICK START CHEAT SHEET
## ⚡ 5-MINUTE SETUP GUIDE
### 1️⃣ **ADD TO CHART**
- Timeframe: **5-MINUTE CHART** (MUST USE!)
- Add indicator: "Dr. Curry Range Break"
- Default settings work great!
### 2️⃣ **WAIT FOR THE BLUE BOX** (9:30-9:45 AM ET)
```
🔵 BLUE BOX = Your Trading Range
- Forms in first 15 minutes
- DO NOT TRADE until box completes!
```
### 3️⃣ **WATCH FOR BREAKOUT SIGNALS**
#### 🟢 **LONG SETUP (BUY)**
- Price CLOSES above blue box
- Look for signal on chart:
- **GREEN = GO!** (★★★ Best)
- **BLUE = GOOD** (★★)
- **GOLD = CAREFUL** (★)
#### 🔴 **SHORT SETUP (SELL)**
- Price CLOSES below blue box
- Look for signal on chart:
- **RED = GO!** (★★★ Best)
- **BLUE = GOOD** (★★)
- **GOLD = CAREFUL** (★)
## 📊 TRADE MANAGEMENT
### **ENTRY CHECKLIST** ✅
1. Blue box complete? ✓
2. Candle CLOSED outside box? ✓
3. Signal appeared? ✓
4. Volume says "HIGH VOL"? (Even better!)
### **WHERE TO EXIT**
- **Take Profit**: Green/Red TP lines on chart
- **Stop Loss**: Opposite side of blue box
- **Quick Rule**: Risk $100 to make $200+
## 🎯 THE ONLY 3 RULES YOU NEED
### RULE 1: **COLOR = ACTION**
```
GREEN/RED Candle = BEST Trade
BLUE Candle = GOOD Trade
GOLD Candle = SKIP (risky)
```
### RULE 2: **STARS = QUALITY**
```
★★★ = Full position size
★★ = Half position size
★ = Don't trade (or tiny size)
```
### RULE 3: **PANEL = CONFIRMATION**
Look for:
- **"HIGH VOL ✓"** = Strong move
- **"Bullish/Bearish"** = With trend
- **Stop Loss price** = Your exit
## 🚦 SIMPLE DECISION TREE
```
Is there a BLUE BOX?
↓ NO → Wait
↓ YES
Did price CLOSE outside box?
↓ NO → Wait
↓ YES
What COLOR is the signal?
↓ GOLD → Skip trade
↓ BLUE → Maybe trade (check stars)
↓ GREEN/RED → TRADE IT!
```
## ⏰ BEST TRADING TIMES
**BEST**: 9:45 AM - 10:30 AM ET
**GOOD**: 10:30 AM - 11:30 AM ET
**AVOID**: After 12:00 PM (lunch chop)
## 💰 POSITION SIZING (Beginners)
- **★★★ Signal**: Risk 1% of account
- **★★ Signal**: Risk 0.5% of account
- **★ Signal**: Don't trade
**Example**: $10,000 account
- ★★★ = Risk $100 per trade
- ★★ = Risk $50 per trade
## 🛑 STOP DOING THIS
❌ Trading before blue box completes
❌ Entering on wick touches (need CLOSE)
❌ Taking ★ trades
❌ Moving your stop loss
❌ Revenge trading after a loss
## ✅ START DOING THIS
✅ Wait for box completion
✅ Only trade ★★ or ★★★
✅ Use the stop loss shown
✅ Take partial profits at TP1
✅ Stop after 2 losses
## 📱 FIRST WEEK GOALS
- **Monday**: Just watch, don't trade
- **Tuesday**: Paper trade only ★★★ signals
- **Wednesday**: Paper trade ★★★ and ★★
- **Thursday**: Small real trades (★★★ only)
- **Friday**: Review and learn
## 🎪 THE "SET IT AND FORGET IT" METHOD
1. **Entry**: Market order on signal
2. **Stop**: Set at opposite box level
3. **Target**: Set at TP1 (first green/red line)
4. **Walk away**: Let it hit stop or target
## 🚨 EMERGENCY RULES
**STOP TRADING IF**:
- Lost 2 trades today
- Feeling emotional
- No clear signals appearing
- Market is choppy (no trend)
---
## 📝 YOUR DAILY ROUTINE
**9:25 AM**: Chart open, indicator on
**9:30 AM**: Watch blue box form
**9:45 AM**: Box complete, watch for breakout
**9:46 AM+**: Take signal if it appears
**10:30 AM**: Review trades, possibly done for day
## 💡 ONE LAST TIP
**Start with SIM/Paper Trading for 1 week minimum!**
The best traders are patient traders. Wait for YOUR setup - the market will always give you another chance tomorrow.
**Remember**: 1 good ★★★ trade > 5 random trades
Good luck! 🍀# Dr. Curry Range Break - Professional Trading Indicator
## Overview
The **Dr. Curry Range Break** is a comprehensive trading system designed to identify high-probability breakout opportunities during the market's opening range period. This professional-grade indicator combines volume analysis, multi-timeframe trend confirmation, and smart money concepts to give traders a complete edge in range breakout trading.
## 🎯 Key Features
### 1. **Opening Range Detection**
- Automatically identifies and marks the opening range (5, 15, or 30-minute options)
- Clear visual box showing the range high and low
- Professional blue color scheme for easy identification
### 2. **Smart Breakout Signals**
- **GREEN CANDLE + "STRONG BUY ★★★"** = High probability setup (with trend + high volume)
- **BLUE CANDLE + "BUY SIGNAL ★★"** = Good setup (with trend, normal volume)
- **GOLD CANDLE + "RISKY BUY ★"** = Caution (against trend)
### 3. **Automatic Target Levels**
- Displays TP1, TP2, TP3 levels based on previous swing points
- Clear price labels showing exact target levels
- Green lines for long targets, red lines for short targets
### 4. **Multi-Timeframe Trend Analysis**
- Analyzes 15m, 60m, and 240m timeframes simultaneously
- Shows trend strength percentage in the panel
- Confirms if your trade aligns with the bigger picture
### 5. **Volume Confirmation**
- Identifies high-volume breakouts automatically
- "HIGH VOL ✓" indicator in panel when volume exceeds threshold
- Helps filter out false breakouts
### 6. **Advanced Features**
- Fair Value Gaps (FVG) detection
- Order Block identification
- Stop loss levels clearly marked
- Professional trading panel with all key information
## 📖 How to Use
### Setup
1. **Best Timeframe**: Use on 5-minute chart (also works on 1m and 15m)
2. **Market Open**: Indicator activates at 9:30 AM ET (configurable)
3. **Range Duration**: Default 15 minutes (9:30-9:45 AM)
### Entry Rules
1. **Wait for Range Lock**: Let the opening range complete (default 15 minutes)
2. **Watch for Breakout**: Price must CLOSE above/below the range
3. **Check the Signal**:
- ★★★ = Take the trade with confidence
- ★★ = Good setup, normal position size
- ★ = Risky, reduce size or skip
### Exit Strategy
- **Take Profit**: Use the TP levels shown on chart
- **Stop Loss**: Opposite side of the range (shown in panel)
- **Trail Stop**: Move to breakeven after TP1
## 🔍 What to Look For
### Best Setups (★★★)
- Green/Red candle on breakout
- "HIGH VOL ✓" in panel
- Trend aligned (Bullish/Bearish in panel)
- Clear TP levels above/below
### Good Setups (★★)
- Blue candle on breakout
- Normal volume
- With trend direction
- Multiple TP levels available
### Avoid These (★)
- Gold/Yellow candle (against trend)
- Low volume breakouts
- Choppy market conditions
- No clear TP levels
## ⚙️ Customization Options
### Visual Settings
- **Minimal Mode**: Reduces clutter for experienced traders
- **Show/Hide**: Targets, FVG, Order Blocks, Swing Points
- **Panel Position**: Choose corner placement
### Range Settings
- **Timezone**: Adjust for your market
- **Duration**: 5, 15, or 30-minute ranges
- **Market Open**: Customize start time
### Advanced Settings
- **Volume Multiplier**: Adjust high volume threshold
- **Target Count**: Show 1-3 TP levels
- **EMA Length**: Trend calculation period
## 💡 Pro Tips
1. **Best Days**: Monday-Thursday typically have cleaner breakouts
2. **Avoid Fridays**: Often choppy with less follow-through
3. **News Days**: Check economic calendar - avoid FOMC days
4. **Time It**: Best breakouts often occur 30-60 minutes after open
5. **Volume Matters**: Never take a ★ trade on low volume
## 🚨 Risk Management
- **Position Size**: Risk 1-2% per trade maximum
- **Stop Loss**: Always use the opposite range level
- **Scaling**: Take partial profits at each TP level
- **Daily Max**: Stop after 2-3 losses in a day
## 📊 Success Metrics
This indicator helps identify:
- High probability breakouts with 60-70% win rate on ★★★ setups
- Clear risk/reward with defined stops and targets
- Optimal entry timing with volume confirmation
- Trend alignment for higher probability trades
---
**Remember**: No indicator is perfect. Always use proper risk management and combine with your market knowledge. The Dr. Curry Range Break is a tool to enhance your decision-making, not replace it.
*Happy Trading! 📈*## 📦 Box Color Guide - Dr. Curry Range Break
### 🔵 **BLUE BOX - Opening Range**
- **What it means**: This is your main trading range (first 15/30 minutes)
- **How to use**: Wait for price to break above/below this box
- **Key levels**: Top = Range High (Long entry above), Bottom = Range Low (Short entry below)
### 🟢 **GREEN BOXES - Bullish Zones**
1. **Light Green Transparent Box (FVG - Fair Value Gap)**
- **What it means**: Bullish imbalance/gap in price
- **How to use**: Acts as support on pullbacks
- **Trading tip**: If price returns to this box after breakout, it's a good re-entry zone
2. **Very Light Green Box (Order Block)**
- **What it means**: Last bearish candle before a strong move up
- **How to use**: Major support zone
- **Trading tip**: Great area to add to positions or enter if missed initial breakout
### 🔴 **RED BOXES - Bearish Zones**
1. **Light Red Transparent Box (FVG - Fair Value Gap)**
- **What it means**: Bearish imbalance/gap in price
- **How to use**: Acts as resistance on pullbacks
- **Trading tip**: If price returns to this box after breakdown, it's a good re-entry zone for shorts
2. **Very Light Red Box (Order Block)**
- **What it means**: Last bullish candle before a strong move down
- **How to use**: Major resistance zone
- **Trading tip**: Great area to add to short positions or enter if missed initial breakdown
### 🟠 **ORANGE BOX - Breaker Block**
- **What it means**: Failed support/resistance that flipped
- **How to use**: Strong reversal zone
- **Trading tip**: Often marks the end of a move - consider taking profits
## 🎯 Quick Reference
```
BLUE = Your main range to trade
GREEN = Support zones (buy/hold)
RED = Resistance zones (sell/short)
ORANGE = Reversal warning
```
## 💡 Pro Tips for Using Boxes
1. **Multiple Green Boxes** = Stronger bullish bias
2. **Multiple Red Boxes** = Stronger bearish bias
3. **Price respecting boxes** = Higher probability trades
4. **Price ignoring boxes** = Potential trend change
### Box Stacking Priority
1. **Most Important**: Blue Opening Range
2. **Very Important**: Order Blocks (light green/red)
3. **Important**: FVG boxes
4. **Warning**: Orange breaker blocks
**Remember**: The more boxes align in one direction, the stronger the move typically is!
BOS FVG IndicatorBOS FVG Indicator (Smart Market Structure Tool)
🔎 Overview
The BOS FVG Indicator is a smart price-action–based tool that combines Break of Structure (BOS), Change of Character (CHoCH), Fair Value Gaps (FVG), Supertrend, and ADX strength into one powerful indicator.
It helps traders identify market structure shifts, imbalances, and high-probability trade setups while also highlighting no-trade zones (NTZ) where the market is choppy or lacks trend strength.
This indicator is designed for intraday and swing traders who follow ICT-style concepts or price-action based trading.
⚡ Key Features
Break of Structure (BOS) & CHoCH Detection
Labels bullish BOS (📈 BOS↑) and bearish BOS (📉 BOS↓).
Highlights structure shifts for trend confirmation.
Fair Value Gaps (FVG)
Auto-detects bullish and bearish FVGs.
Draws transparent boxes with labels where imbalances appear.
Supertrend Confirmation
Adaptive supertrend line with dynamic coloring (green = bullish, red = bearish).
No Trade Zone (NTZ)
Automatically shades background gray when ADX is weak or no BOS detected.
Helps avoid false signals in sideways/choppy markets.
Multi-Timeframe Context
Previous 4H candle range plotted as a dotted yellow box.
Useful for intraday traders tracking HTF liquidity zones.
Signal Strength
Regular and Strong Buy/Sell signals based on ADX confirmation.
Labels include entry info, RR (2:1), and trend strength.
Market Info Dashboard
Table on chart showing ADX strength, current trend, and trade zone status.
🛠 How to Use
Add to Chart → Apply the indicator to any timeframe (works best on 5m–1H for intraday, 4H–Daily for swing).
Choose Mode
Indicator Mode → Shows visual signals, BOS, FVG, NTZ zones, and dashboard.
Strategy Mode → Displays trade entry labels with RR info for backtesting setups.
Filters
Only trade signals when ADX > threshold and NTZ is inactive.
Confirm with Supertrend direction + BOS + FVG alignment.
Entries & Exits
Long Entry → Bullish BOS + Bullish FVG + Trend bullish.
Short Entry → Bearish BOS + Bearish FVG + Trend bearish.
Stop Loss: Recent swing high/low.
Take Profit: Auto-suggested 2:1 RR.
🔔 Alerts
Set alerts to never miss key signals:
✅ Bullish / Bearish BOS
✅ Bullish / Bearish FVG
✅ Strong Buy / Sell
✅ Regular Buy / Sell
✅ Long / Short Entries
✅ No Trade Zone active
Alerts are pre-configured with clear messages (📈, 📉, 🚀, 🟢, 🔴, ⚪).
📌 Best Use Cases
ICT-style liquidity and FVG traders.
Intraday traders filtering strong vs weak signals.
Swing traders using multi-timeframe confirmation.
Traders who want an all-in-one market structure toolkit.
👉 This script is not financial advice. Always backtest before using in live markets.

IFVG by Toño# IFVG by Toño - Pine Script Indicator
## Overview
This Pine Script indicator identifies and visualizes **Fair Value Gaps (FVG)** and **Inverted Fair Value Gaps (IFVG)** on trading charts. It provides advanced analysis of price inefficiencies and their subsequent inversions when mitigated.
## Key Features
### 1. Fair Value Gap (FVG) Detection
- **Bullish FVG**: Detected when `low > high ` (gap between current low and high of 2 bars ago)
- **Bearish FVG**: Detected when `high < low ` (gap between current high and low of 2 bars ago)
- Visual representation using colored rectangles (green for bullish, red for bearish)
### 2. Inverted Fair Value Gap (IFVG) Creation
- **IFVG Formation**: When a FVG gets mitigated (price fills the gap with candle body), an IFVG is created
- **Color Inversion**: The IFVG takes the opposite color of the original FVG
- Mitigated bullish FVG → Creates red (bearish) IFVG
- Mitigated bearish FVG → Creates green (bullish) IFVG
- **Mitigation Logic**: Uses only candle body (not wicks) to determine when a FVG is filled
### 3. Customizable Display Options
- **Show Normal FVG**: Toggle visibility of regular Fair Value Gaps
- **Show IFVG**: Toggle visibility of Inverted Fair Value Gaps
- **Smart FVG Display**: Even when "Show Normal FVG" is disabled, FVGs that are part of IFVGs remain visible
- **Extension Control**: Option to extend FVGs until they are mitigated
### 4. IFVG Extension Methods
- **Full Cross Method**: IFVG remains active until price completely crosses through it (including wicks)
- **Number of Bars Method**: IFVG remains active for a specified number of bars (1-100)
### 5. Visual Mitigation Signals
- **Cross Markers**: Shows X-shaped markers when IFVGs are mitigated
- Green cross above bar: Bearish IFVG mitigated
- Red cross below bar: Bullish IFVG mitigated
### 6. Comprehensive Alert System
- **IFVG Formation Alerts**: Notifications when new IFVGs are created
- **IFVG Mitigation Alerts**: Notifications when IFVGs are filled/mitigated
- **Separate Controls**: Individual toggles for bullish and bearish IFVG alerts
## How It Works
### Step-by-Step Process:
1. **FVG Detection**: Script continuously scans for 3-bar patterns that create price gaps
2. **FVG Tracking**: Each FVG is stored with its coordinates, type, and status
3. **Mitigation Monitoring**: Script watches for candle bodies that fill the FVG
4. **IFVG Creation**: Upon mitigation, creates an IFVG with opposite polarity at the same location
5. **IFVG Management**: Tracks and extends IFVGs according to chosen method
6. **Visual Updates**: Dynamically updates colors and visibility based on user settings
## Use Cases
- **Support/Resistance Analysis**: IFVGs often act as strong support/resistance levels
- **Market Structure Understanding**: Helps identify how market inefficiencies get filled and reversed
- **Entry/Exit Timing**: Can be used to time entries around IFVG formations or mitigations
- **Confluence Analysis**: Combine with other technical analysis tools for stronger signals
## Configuration Parameters
- **Colors**: Customizable colors for bullish/bearish FVGs and IFVGs
- **Extension**: Choose how long to display gaps on the chart
- **Alerts**: Full control over notification preferences
- **Visual Clarity**: Options to show/hide different gap types for cleaner charts
## Technical Specifications
- **Pine Script Version**: 5
- **Overlay**: True (displays directly on price chart)
- **Max Boxes**: 500 (supports up to 500 simultaneous gaps)
- **Performance**: Optimized array management for smooth operation
This indicator is particularly valuable for traders who use **Smart Money Concepts (SMC)** and **Inner Circle Trader (ICT)** methodologies, as it provides clear visualization of how institutional order flow creates and fills market inefficiencies.
