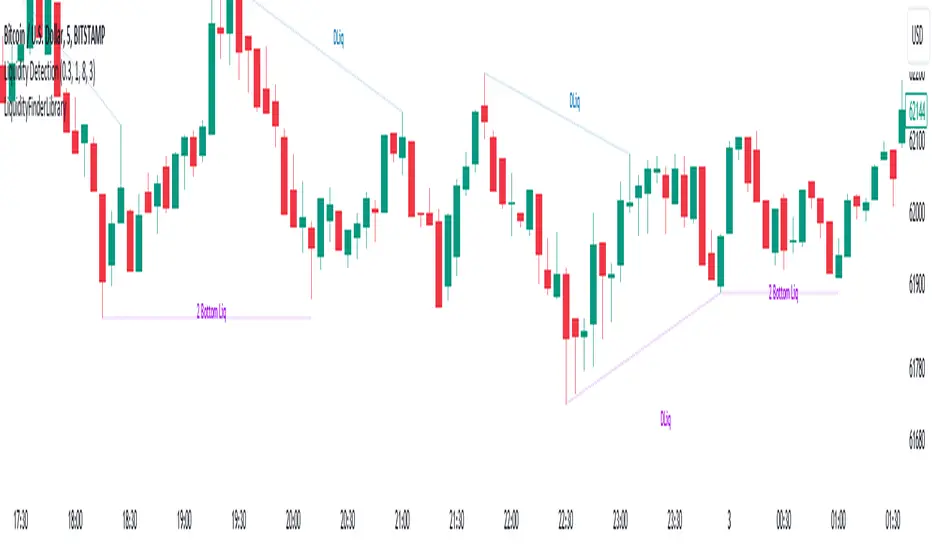
Liquidity Finder Library🔵 Introduction
You may intend to utilize the "Liquidity" detection capability in your indicators. Instead of writing it, you can import the "Liquidity Finder" library into your code. One of the advantages of this approach is time-saving and reduction in scripting errors.
🔵 Key Features
Identification of "Statics Liquidity"
Identification of "Dynamics Liquidity"
🔵 How to Use
Firstly, you can add the library to your code as shown in the example below :
import TFlab/LiquidityFinderLibrary/1 as Liq
The parameters of the "LLF" function are as follows :
sPP : A float variable ranging from 0 to 0.4. Increasing this number decreases the sensitivity of the "Statics Liquidity Line Detection" function and increases the number of detected lines. The default value is 0.3.
dPP : A float variable ranging from 0.4 to 1.95. Increasing this number increases the sensitivity of the "Dynamics Liquidity Line Detection" function and decreases the number of detected lines. The default value is 1.
SRs : An int variable. By default, it's set to 8. You can change this number to specify the periodicity of static liquidity pivot lines.
SRd : An int variable. By default, it's set to 3. You can change this number to specify the periodicity of dynamic liquidity pivot lines.
ShowHLLs : A bool variable. You can enable or disable the display of "High Statics Liquidity Line".
ShowLLLs : A bool variable. You can enable or disable the display of "Low Statics Liquidity Line".
ShowHLLd : A bool variable. You can enable or disable the display of "High Dynamics Liquidity Line".
ShowLLd : A bool variable. You can enable or disable the display of "High Dynamics Liquidity Line".
🟣Recommendation
You can use the following code snippet to import Liquidity Finder into your code for time-saving.
//import Library
import TFlab/LiquidityFinderLibrary/1 as Liq
//input
SLLS = input.float(0.30 , 'Statics Liquidity Line Sensitivity', maxval = 0.4 ,minval = 0.0, step = 0.01) // Statics Liquidity Line Sensitivity
DLLS = input.float(1.00 , 'Dynamics Liquidity Line Sensitivity', maxval = 1.95 ,minval = 0.4, step = 0.01) // Dynamics Liquidity Line Sensitivity
SPP = input.int(8 , 'Statics Period Pivot') // Statics Period Pivot
DPP = input.int(3 , 'Dynamics Period Pivot') // Dynamics Period Pivot
ShowSHLL = input.bool(true , 'Show Statics High Liquidity Line')
ShowSLLL = input.bool(true , 'Show Statics Low Liquidity Line')
ShowDHLL = input.bool(true , 'Show Dynamics High Liquidity Line')
ShowDLLL = input.bool(true , 'Show Dynamics Low Liquidity Line')
//call function
Liq.LLF(SPP,DPP,SLLS,DLLS,ShowSHLL,ShowSLLL,ShowDHLL,ShowDLLL)
在腳本中搜尋"smc"
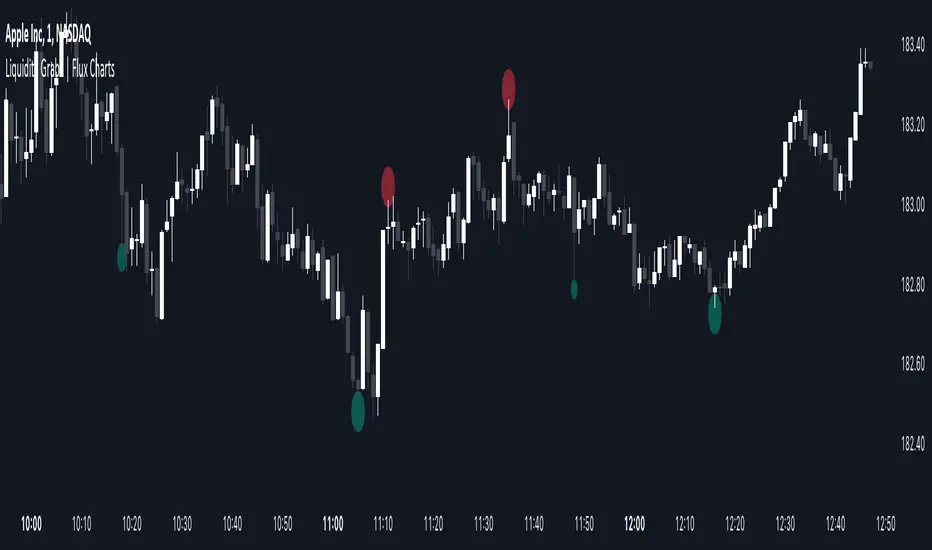
Liquidity Grabs | Flux Charts💎 GENERAL OVERVIEW
Introducing our new Liquidity Grabs indicator! This indicator can renders bubbles with different sizes at candles that have liquidity grabs, which happen when a liquidity areas (buyside / sellside liquidity) is swept. These candles often fill a lot of market orders that were sitting on the liquidity zone. You can check "How Does It Work" section for more information.
Features of the new Liquidity Grabs Indicator :
Renders Liquidity Grabs
Customizable Algorithm
Customizable Styles
Alerts
🚩UNIQUENESS
Liquidity grabs can be useful when determining candles that have executed a lot of market orders, and planning your trades accordingly. This indicator renders liquidity grabs in an unique bubble style, the size of the bubble is calculated by the size of the wick that caused the liquidity grab. The indicator also lets you customize the pivot length and the wick-body ratio for liquidity grabs.
📌 HOW DOES IT WORK ?
Liquidity grabs occur when one of the latest pivots has a false breakout. Then, if the wick to body ratio of the bar is higher than 0.5 (can be changed from the settings) a bubble is plotted. Using the wick length as a metric to measure liquidity is good because long wicks can translate to a large amount of buyers / sellers entering the market.
The bubble size is determined by the wick to body ratio of the candle.
⚙️SETTINGS
1. General Configuration
Pivot Length -> This setting determines the range of the pivots. This means a candle has to have the highest / lowest wick of the previous X bars and the next X bars to become a high / low pivot.
Wick-Body Ratio -> After a pivot has a false breakout, the wick-body ratio of the latest candle is tested. The resulting ratio must be higher than this setting for it to be considered as a liquidity grab.
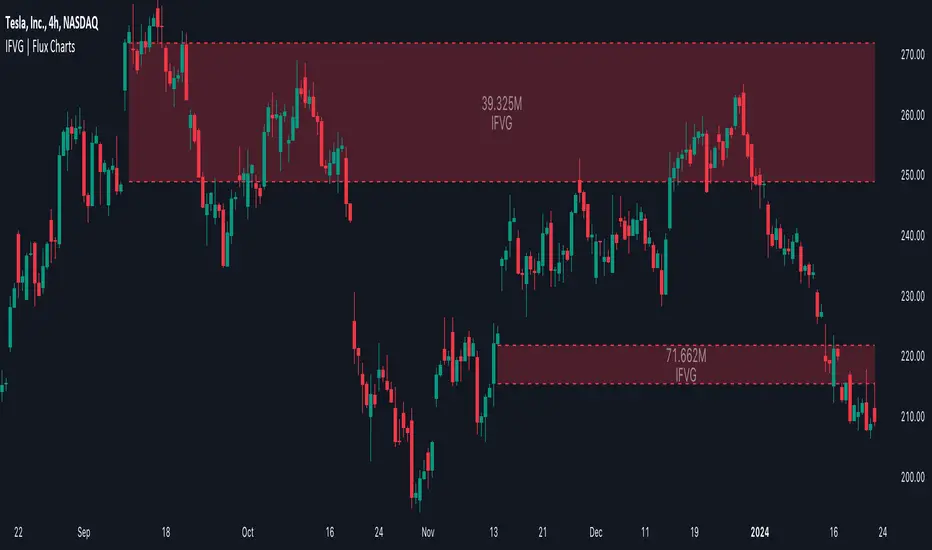
Fibonacci Inversion Fair Value Gaps | Flux Charts💎 GENERAL OVERVIEW
Introducing our new Fibonacci Inversion Fair Value Gaps (IFVG) indicator! Inverse Fair Value Gaps occur when a Fair Value Gap becomes invalidated. They reverse the role of the original Fair Value Gap, making a bullish zone bearish and vice versa. This indicator plots the Fibonacci retracement levels of the IFVG, which often act like support & resistance levels.
Features of the new Fibonacci IFVGs Indicator :
Renders Bullish / Bearish IFVG Zones
Renders Fibonacci Retracement Levels Of IFVGs
Combination Of Overlapping FVG Zones
Variety Of Zone Detection / Sensitivity / Filtering / Invalidation Settings
High Customizability
🚩UNIQUENESS
This indicator stands out with its ability to render up to 3 Fibonacci retracement levels of IFVGs. Fibonacci retracement levels are widely used within trading, and we wanted to implement them for IFVG zones. You can also customize the FVG Filtering method, FVG & IFVG Zone Invalidation, Detection Sensitivity etc. according to your needs to get the best performance from the indicator.
📌 HOW DOES IT WORK ?
A Fair Value Gap generally occur when there is an imbalance in the market. They can be detected by specific formations within the chart. An Inverse Fair Value Gap is when a FVG becomes invalidated, thus reversing the direction of the FVG.
This indicator renders 0.618, 0.5 and 0.382 (can be changed from the settings) Fibonacci retracement levels of the IFVGs, which often act as support and resistances. Check this example :
⚙️SETTINGS
1. General Configuration
FVG Zone Invalidation -> Select between Wick & Close price for FVG Zone Invalidation.
IFVG Zone Invalidation -> Select between Wick & Close price for IFVG Zone Invalidation. This setting also switches the type for IFVG consumption.
Zone Filtering -> With "Average Range" selected, algorithm will find FVG zones in comparison with average range of last bars in the chart. With the "Volume Threshold" option, you may select a Volume Threshold % to spot FVGs with a larger total volume than average.
FVG Detection -> With the "Same Type" option, all 3 bars that formed the FVG should be the same type. (Bullish / Bearish). If the "All" option is selected, bar types may vary between Bullish / Bearish.
Detection Sensitivity -> You may select between Low, Normal or High FVG detection sensitivity. This will essentially determine the size of the spotted FVGs, with lower sensitivies resulting in spotting bigger FVGs, and higher sensitivies resulting in spotting all sizes of FVGs.
Show Historic Zones -> If this option is on, the indicator will render invalidated IFVG zones as well as current IFVG zones. For a cleaner look at current IFVG zones which are not invalidated yet, you can turn this option off.
2. Fibonacci Retracement Levels
You can enable / disable up to 3 different Fibonnaci Retracement levels at this group of settings. You can also switch their line styles between solid, dashed and dotted as well as changing their colors.

Inversion Fair Value Gaps | Flux Charts💎 GENERAL OVERVIEW
Introducing our new Inversion Fair Value Gaps (IFVG) indicator! Inversion Fair Value Gaps occur when a Fair Value Gap becomes invalidated. They reverse the role of the original Fair Value Gap, making a bullish zone bearish and vice versa. With this indicator, you can now see the volume of the bar that invalidated the FVG, which is also the bar that IFVG occurred. For more information about the process, read the " HOW DOES IT WORK " section of the description.
Features of the IFVG Indicator :
Render Bullish / Bearish IFVG Zones
See The Occurrence Volume Of The IFVG Zones
Combination Of Overlapping FVG Zones
Variety Of Zone Detection / Sensitivity / Filtering / Invalidation Settings
High Customizability
🚩UNIQUENESS
This indicator stands out with its ability to render the occurrence volume of IFVGs. Also the ability to combine overlapping FVG zones will result in cleaner charts for traders. You can customize the FVG Filtering method, FVG & IFVG Zone Invalidation, Detection Sensitivity etc. according to your strategy to get the best performance from the indicator.
📌 HOW DOES IT WORK ?
A Fair Value Gap generally occur when there is an imbalance in the market. They can be detected by specific formations within the chart. An Inversion Fair Value Gap is when a FVG becomes invalidated, thus reversing the direction of the FVG.
⚙️SETTINGS
1. General Configuration
FVG Zone Invalidation -> Select between Wick & Close price for FVG Zone Invalidation.
IFVG Zone Invalidation -> Select between Wick & Close price for IFVG Zone Invalidation.
Zone Filtering -> With "Average Range" selected, algorithm will find FVG zones in comparison with average range of last bars in the chart. With the "Volume Threshold" option, you may select a Volume Threshold % to spot FVGs with a larger total volume than average.
FVG Detection -> With the "Same Type" option, all 3 bars that formed the FVG should be the same type. (Bullish / Bearish). If the "All" option is selected, bar types may vary between Bullish / Bearish.
Detection Sensitivity -> You may select between Low, Normal or High FVG detection sensitivity. This will essentially determine the size of the spotted FVGs, with lower sensitivies resulting in spotting bigger FVGs, and higher sensitivies resulting in spotting all sizes of FVGs.
Show Historic Zones -> If this option is on, the indicator will render invalidated IFVG zones as well as current IFVG zones. For a cleaner look at current IFVG zones which are not invalidated yet, you can turn this option off.
Order Blocks | Flux Charts💎 GENERAL OVERVIEW
Introducing our new Volumized Order Blocks indicator! This new indicator can render order blocks with their volumetric information. It's highly customizable with detection, invalidation and style settings.
Features of the new Volumized Order Blocks indicator :
Render Bullish & Bearish Order Blocks
Enable / Disable Volumetric Information
Enable / Disable Historic Zones
Visual Customizability
📌 HOW DOES IT WORK ?
Order blocks occur when there is a high amount of market orders exist on a price range. It is possible to find order blocks using specific formations on the chart.
The high & low volume of order blocks should be taken into consideration while determining their strengths. The determination of the high & low volume of order blocks are similar to FVGs, in a bullish order block, the high volume is the last 2 bars' total volume, while the low volume is the oldest bar's volume. In a bearish order block scenario, the low volume becomes the last 2 bars' total volume.
🚩UNIQUENESS
The ability to render the total volume of Order Blocks as well as bullish / bearish volume ratio is what sets this Order Block indicator apart from others. Also the ability to combine overlapping Order Block zones will result in cleaner charts for traders.
⚙️SETTINGS
1. General Configuration
Volumetric Info -> The volumetric information of the Order Blocks will be rendered if activated.
Zone Invalidation -> Select between Wick & Close price for Order Block Invalidation.
Swing Length -> Swing length is used when finding order block formations. Smaller values will result in finding smaller order blocks.

Breaker Blocks | Flux Charts💎 GENERAL OVERVIEW
Introducing our new Volumized Breaker Blocks indicator! This new indicator can render breaker blocks with their volumetric information. It's highly customizable with detection, invalidation and style settings.
Features of the new Volumized Breaker Block indicator :
Render Bullish & Bearish Breaker Blocks
Enable / Disable Volumetric Information
Enable / Disable Historic Zones
Visual Customizability
📌 HOW DOES IT WORK ?
Breaker blocks form when an order block fails, or "breaks". It is often associated with market going in the opposite direction of the broken order block, and they can be spotted by following order blocks and finding the point they get broken, ie. price goes below a bullish order block.
The volume of a breaker block is simply the total volume of the bar that the original order block is broken.
🚩UNIQUENESS
This indicator can not only detect breaker blocks, but it can also detect them with their volumetric information. Volumetric information can be crucial when considering an breaker block's strength, which can be a crucial form of confluence in certain trading strategies.
⚙️SETTINGS
1. General Configuration
Volumetric Info -> The volumetric information of the Breaker Blocks will be rendered if activated.
Zone Invalidation -> Select between Wick & Close price for Breaker Block Invalidation.
Swing Length -> Swing length is used when finding breaker block formations. Smaller values will result in finding smaller breaker blocks.

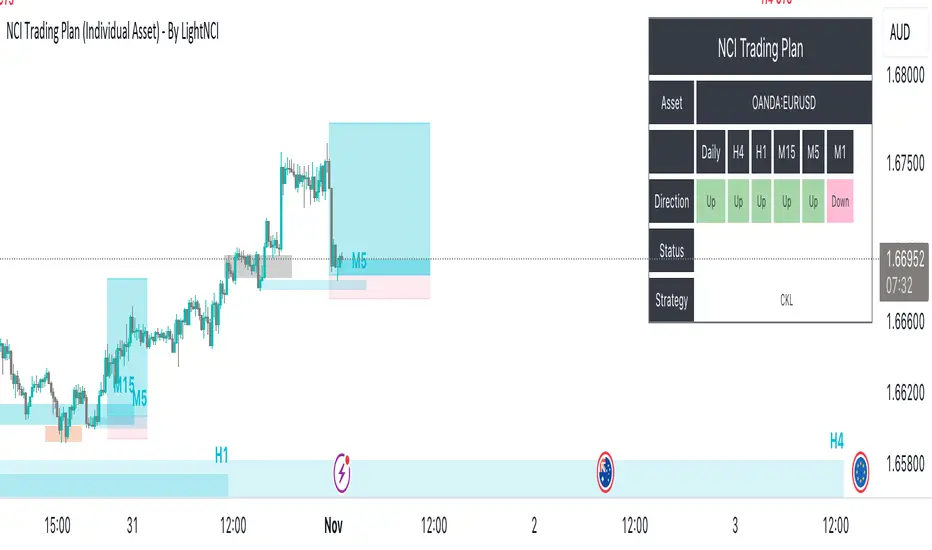
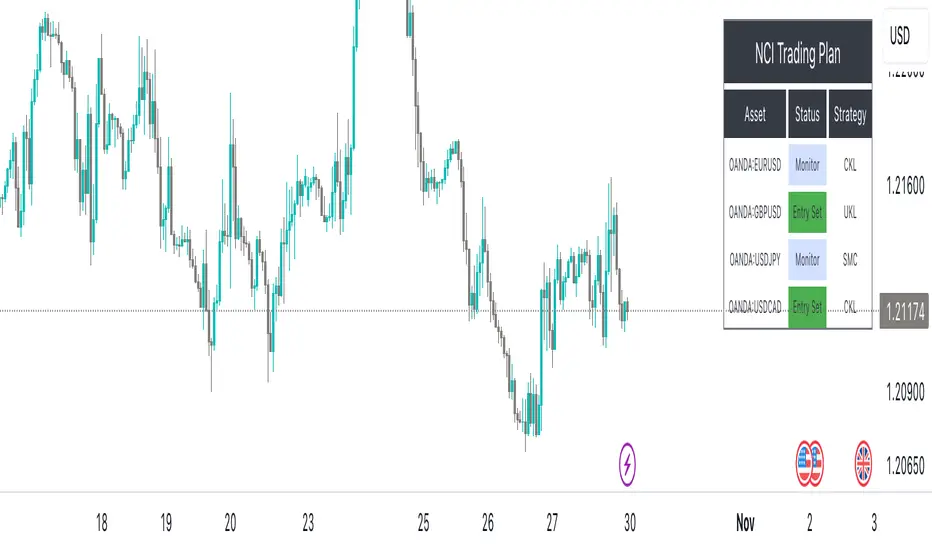
NCI Trading Plan (Individual Asset)NCI Trading Plan (Individual Asset)- By LightNCI
NCI, which stands for New Concept Integration by Jayce PHAM, is a comprehensive approach that incorporates various critical aspects of trading to provide a logical, structured, and integrated approach to the financial markets. NCI covers market structure, key levels, smart money concepts, multiple timeframes and market cycles
About the NCI Trading Plan (Individual Asset) Indicator
The NCI Trading Plan is just a table allowing traders to keep track of a single asset, but multiple timeframe status on a single table, ensuring a comprehensive overview of trading statuses and strategies for each timeframe. The status is not automatically update. Using the NCI strategy, you may update it yourself the status of each timeframe.
Features
1. Display column for Daily, H4, H1, M15, M5, M1: Designed to support multi-timeframe analysis.
2. Direction Status Indication: Visualise the direction of each timeframe.
3. Dynamic Status Indication: Visualize the trading status for each asset:
i. Monitor: Asset is under review or surveillance.
ii. Confirmation: A potential trading signal or setup is being confirmed.
iii. Entry Set: An order for the asset has been placed.
iv. Forward-Test: An asset under monitored for it to being forward test.
4. Strategy Indication: Each asset can be tagged with a specific strategy identifier:
i. CKL: Confluence Key Level
ii. UKL: Un-Confluence Key Level
iii. SMC: Smart Money Concept
iv. BRT: Break & Re-Test
v. RTNKL: Re-Test of New Key Level
5. Stylisation: Color-code the statuses, table and fonts to suit your visual preference.
How to use
1. Asset Name: Select asset from the list
2. Timeframe Direction: Choose direction for each timeframe.
3. Status Selection: Choose the current trading status for each asset.
4. Strategy Selection: Assign a trading strategy to each asset.
5. Style: Customise the appearance of your trading plan by selecting preferred colours for different statuses and headers.
Conclusion
The NCI Trading Plan ensures a systematic and organised approach to multi-time frame trading. By maintaining a visual overview of multi-time frame analysis and their corresponding trading statuses and strategies, traders can efficiently manage their portfolio and ensure timely decision-making.
Tip: To reset or modify an asset's status or strategy, simply adjust the settings in the panel on the left. The table will update in real-time.
NCI Trading Plan - By LightNCINCI Trading Plan - By LightNCI
NCI, which stands for New Concept Integration by Jayce PHAM, is a comprehensive approach that incorporates various critical aspects of trading to provide a logical, structured, and integrated approach to the financial markets. NCI covers market structure, key levels, smart money concepts, multiple timeframes and market cycles
About the NCI Trading Plan Indicator
The NCI Trading Plan is just a table allowing traders to keep track of multiple assets on a single chart, ensuring a comprehensive overview of trading statuses and strategies for each asset. The status is not automatically update. Using the NCI strategy, you may update it yourself the status of each asset.
Features
1. Display up to 10 different assets: Designed to support multi-asset trading strategies.
2. Dynamic Status Indication: Visualize the trading status for each asset:
i. Monitor: Asset is under review or surveillance.
ii. Confirmation: A potential trading signal or setup is being confirmed.
iii. Entry Set: An order for the asset has been placed.
iv. Forward-Test: An asset under monitored for it to being forward test.
3. Strategy Indication: Each asset can be tagged with a specific strategy identifier:
i. CKL: Confluence Key Level
ii. UKL: Un-Confluence Key Level
iii. SMC: Smart Money Concept
iv. BRT: Break & Re-Test
v. RTNKL: Re-Test of New Key Level
4. Customisable Display: Choose which assets you wish to display with a simple toggle on/off feature.
5. Stylisation: Color-code the statuses, table and fonts to suit your visual preference.
How to use
1. Toggle Display: Use the "Show Asset" checkboxes to determine which assets are visible.
2. Asset Name: Assign a name or symbol to each asset.
3. Status Selection: Choose the current trading status for each asset.
4. Strategy Selection: Assign a trading strategy to each asset.
5. Style: Customise the appearance of your trading plan by selecting preferred colours for different statuses and headers.
Conclusion
The NCI Trading Plan ensures a systematic and organised approach to multi-asset trading. By maintaining a visual overview of various assets and their corresponding trading statuses and strategies, traders can efficiently manage their portfolio and ensure timely decision-making.
Tip: To reset or modify an asset's status or strategy, simply adjust the settings in the panel on the left. The table will update in real-time.
Smart money conceptThe indicator tracks the smallest movements of price action. It can monitor and analyze market context, attempting to identify trends within each time frame.
If a candle has its entire body above the previous swing high, it indicates a strong upward momentum. The market is leaning towards an upward direction. If the candle remains within the range of the previous swing high, it signifies weak upward momentum. The market is reluctant to move higher.
If a candle has its entire body below the previous swing low, it reflects a strong downward momentum. The market is leaning towards a downward direction. If the candle remains within the range of the previous swing low, it indicates weak downward momentum. The market is reluctant to move lower.
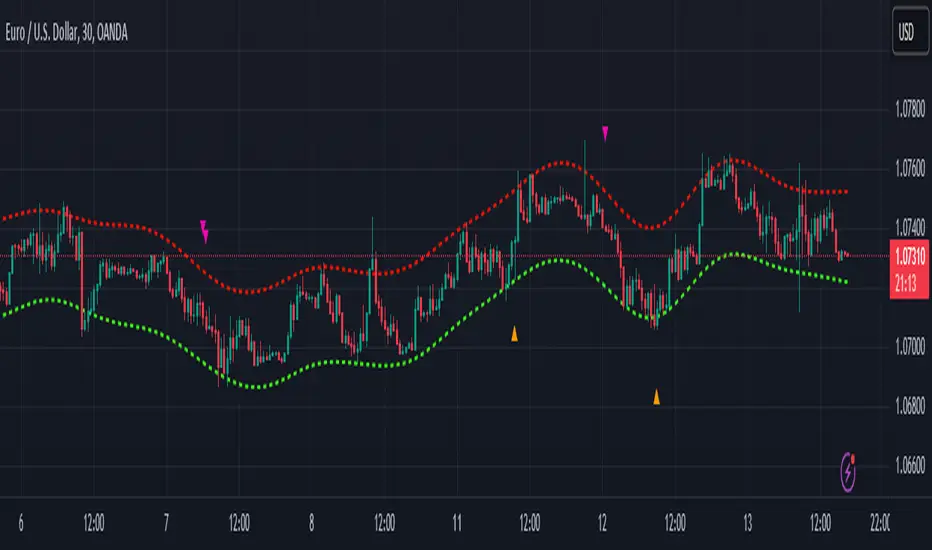
Nadaraya-Watson Envelope: Modified by YosietRange Filter indicator based on the LuxAlgo Nadaraya-Watson Envelope () indicator adding the SMA 30 high and SMA 7 low to predict the changes of the trends lines price.
WARNING: This indicator, as the same as the original, repaints the chart and could affect the exact values of the prices.
SMA Low 7 was identified using tensorflowJS years ago as accurate and abstract rsi indicator
SMA High 30 was identified using tensorflowJS years ago as accurate and strong trend line
This two SMAs were added to the original indicator Nadaraya-Watson to predict the exact points where the price will change direction or will re-test the trend to continue on.
The signals will act as the Williams Fractals, replacing the original signals of the indicator.
For those ICT/SMC traders, the bands and SMAs can toggle off in the settings of this indicator.
SETTINGS
Can set the source of the UPPER band indivuadilly
Can set the source of the LOWER band indivuadilly
Can toggle the visibility of the bands, this will not affect the calculations
Can toggle the visibility of SMAs
ALERTS AND SIGNALS
When the SMA LOW 7 cross under or over the bands, will trigger a signal orange
When the SMA 30 High cross over the upper band, will trigger a short signal purpple
HOW TO USE IT
If the both signals appears (sma 7 low and sma 30 high) crossing the upper band at the same point, this means that the price will drop strongly.
If the sma 7 low cross signal (orange triangle) appears under the price and lower band, means that the price will go up.
The separation of the signals from the chart will suggest the force of the movement. While more distance be, strongest reaction of the price.
DISCLAIMER : This indicator or script does not imply or constitute financial advice, investment advice, trading advice or any other type of advice or recommendation by and for TradingView. Use it at your own risk and your own decision.
OrderBlock [kyleAlgo]The principle of this indicator
ATR (Average True Range) Setting: The code uses ATR to help calculate the Supertrend indicator.
Supertrend Trend Direction: Identify bullish and bearish trends with the Supertrend method.
Order Block Recognition: This part of the code recognizes and creates order blocks, visualizing them as boxes on the chart. If the number of blocks exceeds the maximum limit, old blocks will be deleted.
Function to prevent overlapping: check whether the new order block overlaps with the existing order block through the isOverlapping function.
Order block color setting: The code sets the color according to whether the block is bullish or bearish, and whether it breaks above or below. Afterwards the color of the existing order blocks will be updated.
Sensitivity settings: Through the input settings of factor and atrPeriod, the sensitivity of Supertrend and the detection of order blocks can be affected.
Visualization: Use TradingView's box.new function to draw and visualize order blocks on the chart.
Practicality:
Support and Resistance Levels: Order blocks may represent areas of support and resistance in the market. By visualizing these areas, traders can better understand when price reversals are likely to occur.
Trading Signals: Traders may be able to identify trading signals based on the color changes of blocks and price breakouts. For example, if the price breaks above a bullish block, this could be a signal to buy.
Risk Management: By using ATR to adjust the sensitivity of Supertrend, the symbol helps traders to adjust their strategies according to market volatility. This can be used as a risk management tool to help identify stop loss and take profit points.
Multi-timeframe analysis: Although the code itself does not implement multi-timeframe analysis directly, it can be done by applying this indicator on different timeframes. This helps to analyze the market from different angles.
Flexibility and Customization: Through sensitivity settings, traders can customize the indicator according to their needs and trading style.
Reduced screen clutter: By removing overlapping order blocks and limiting the maximum number of order blocks, this code helps reduce clutter on charts, allowing traders to analyze the market more clearly.
Overall, this "Pine Script" can be a powerful analytical tool for trend traders and those looking to improve their trading decisions by visualizing key market areas. It can be used alone or combined with other indicators and trading systems for enhanced functionality.

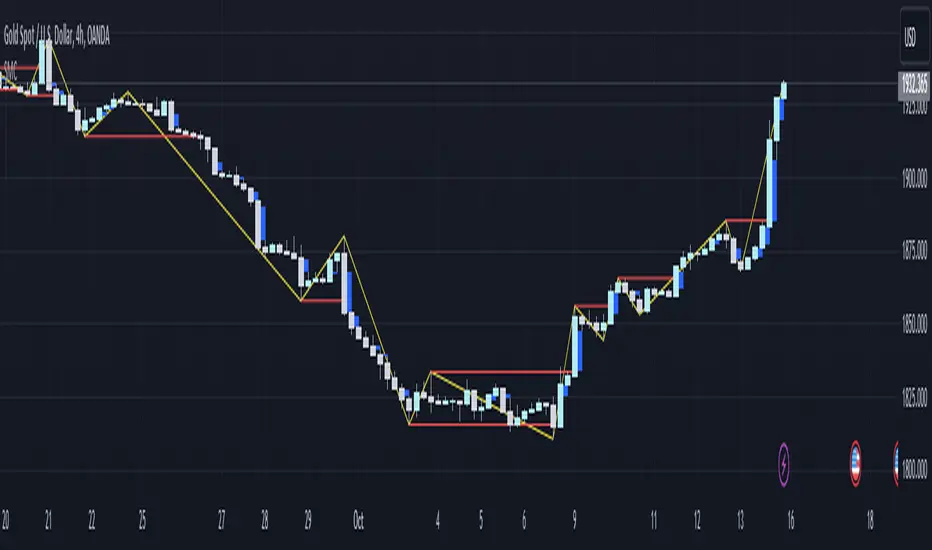
Liquidity Levels/Voids (VP) [LuxAlgo]The Liquidity Levels/Voids (VP) is a script designed to detect liquidity voids & levels by measuring traded volume at all price levels on the market between two swing points and highlighting the distribution of the liquidity voids & levels at specific price levels.
🔶 USAGE
Liquidity is a fundamental market force that shapes the trajectory of assets.
The creation of a liquidity level comes as a result of an initial imbalance of supply/demand, which forms what we know as a swing high or swing low. As more players take positions in the market, these are levels that market participants will use as a historical reference to place their stops. When the levels are then re-tested, a decision will be made. The binary outcome here can be a breakout of the level or a reversal back to the mean.
Liquidity voids are sudden price changes that occur in the market when the price jumps from one level to another with little trading activity (low volume), creating an imbalance in price. The price tends to fill or retest the liquidity voids area, and traders understand at which price level institutional players have been active.
Liquidity voids are a valuable concept in trading, as they provide insights about where many orders were injected, creating this inefficiency in the market. The price tends to restore the balance.
🔶 SETTINGS
The script takes into account user-defined parameters and detects the liquidity voids based on them, where detailed usage for each user-defined input parameter in indicator settings is provided with the related input's tooltip.
🔹 Liquidity Levels / Voids
Liquidity Levels/Voids: Color customization option for Unfilled Liquidity Levels/Voids.
Detection Length: Lookback period used for the calculation of Swing Levels.
Threshold %: Threshold used for the calculation of the Liquidity Levels & Voids.
Sensitivity: Adjusts the number of levels between two swing points, as a result, the height of a level is determined, and then based on the above-given threshold the level is checked if it matches the liquidity level/void conditions.
Filled Liquidity Levels/Voids: Toggles the visibility of the Filled Liquidity Levels/Voids and color customization option for Filled Liquidity Levels/Voids.
🔹 Other Features
Swing Highs/Lows: Toggles the visibility of the Swing Levels, where tooltips present statistical information, such as price, price change, and cumulative volume between the two swing levels detected based on the detection length specified above, Coloring options to customize swing low and swing high label colors, and Size option to adjust the size of the labels.
🔹 Display Options
Mode: Controls the lookback length of detection and visualization.
# Bars: Lookback length customization, in case Mode is set to Present.
🔶 RELATED SCRIPTS
Liquidity-Voids-FVG
Buyside-Sellside-Liquidity
Swing-Volume-Profiles

ICT Kill Zones [dR-Algo]ICT Kill Zones Indicator by dR-Algo
Introducing the dR-Algo's ICT Kill Zones Indicator – a tool meticulously crafted to blend with the elegance of the ICT Concept of Kill Zones. Built for traders who seek clarity and focus, this unique indicator is tailored to highlight the essential time frames while ensuring minimal distraction from the core price action.
Key Features:
Three Kill Zones:
London Kill Zone: Kickstart your trading day with the London Kill Zone, highlighting the critical period between 03:00 to 04:00 (UTC-4). The London session, known for its volatility due to the overlapping of the Asian session, is captured precisely for your benefit.
NY AM Session: As the European markets gear towards close and the US markets come alive, our indicator emphasizes the activity from 10:00 to 11:00 (UTC-4). It’s a window where significant market moves often originate.
NY PM Session: Capture the late-day trading action between 14:00 to 15:00 (UTC-4). As markets prepare to close, this time frame can offer last-minute opportunities.
Subtle Yet Effective Visualization: Unlike many other indicators that bombard traders with an array of colors, our ICT Kill Zones Indicator is intentionally designed to be subtle. It provides just the right amount of visual emphasis without overwhelming the chart. The primary goal is to let traders focus on what truly matters: the price action.
User-Friendly Customization: The indicator's settings can be easily tailored to align with individual trading styles, allowing traders to adjust and tweak as per their preference.
Seamless Integration with Trading View: Smoothly integrates with your TradingView charts ensuring optimal performance and real-time responsiveness.
Why Choose Our ICT Kill Zones Indicator?
The market is flooded with indicators, each promising to be the 'next big thing.' What sets dR-Algo's ICT Kill Zones Indicator apart is its dedication to simplicity and effectiveness. It's not just about adding an indicator to your chart; it's about adding value to your trading experience. By seamlessly merging vital time frames without overshadowing the price action, we ensure traders get the best of both worlds.
Join the trading revolution with dR-Algo and embrace a focused approach to the markets.

Liquidity Voids (FVG) [LuxAlgo]The Liquidity Voids (FVG) indicator is designed to detect liquidity voids/imbalances derived from the fair value gaps and highlight the distribution of the liquidity voids at specific price levels.
Fair value gaps and liquidity voids are both indicators of sell-side and buy-side imbalance in trading. The only difference is how they are represented in the trading chart. Liquidity voids occur when the price moves sharply in one direction forming long-range candles that have little trading activity, whilst a fair value is a gap in price.
🔶 USAGE
Liquidity can help you to determine where the price is likely to head next. In conjunction with higher timeframe market structure, and supply and demand, liquidity can give you insights into potential price movement. It's essential to practice using liquidity alongside trend analysis and supply and demand to read market conditions effectively.
The peculiar thing about liquidity voids is that they almost always fill up. And by “filling”, we mean the price returns to the origin of the gap. The reason for this is that during the gap, an imbalance is created in the asset that has to be made up for. The erasure of this gap is what we call the filling of the void. And while some voids waste no time in filling, some others take multiple periods before they get filled.
🔶 SETTINGS
The script takes into account user-defined parameters and detects the liquidity voids based on them, where detailed usage for each user-defined input parameter in indicator settings is provided with the related input's tooltip.
🔹 Liquidity Detection
Liquidity Voids Threshold: Act as a filter while detecting the Liquidity Voids. When set to 0 basically means no filtering is applied, increasing the value causes the script to check the width of the void compared to a fixed-length ATR value
Bullish: Color customization option for Bullish Liquidity Voids
Bearish: Color customization option for Bearish Liquidity Voids
Labels: Toggles the visibility of the Liquidity Void label
Filled Liquidity Voids: Toggles the visibility of the Filled Liquidity Voids
🔹 Display Options
Mode: Controls the lookback length of detection and visualization
# Bars: Lookback length customization, in case Mode is set to Present
🔶 RELATED SCRIPTS
Buyside-Sellside-Liquidity
Fair-Value-Gaps

ICT Silver Bullet [LuxAlgo]The ICT Silver Bullet indicator is inspired from the lectures of "The Inner Circle Trader" (ICT) and highlights the Silver Bullet (SB) window which is a specific 1-hour interval where a Fair Value Gap (FVG) pattern can be formed.
When a FVG is formed during the Silver Bullet window, Support & Resistance lines will be drawn at the end of the SB session.
There are 3 different Silver Bullet windows (New York local time):
The London Open Silver Bullet (3 AM — 4 AM ~ 03:00 — 04:00)
The AM Session Silver Bullet (10 AM — 11 AM ~ 10:00 — 11:00)
The PM Session Silver Bullet (2 PM — 3 PM ~ 14:00 — 15:00)
🔶 USAGE
The ICT Silver Bullet indicator aims to provide users a comprehensive display as similar as possible to how anyone would manually draw the concept on their charts.
It's important to use anything below the 15-minute timeframe to ensure proper setups can display. In this section, we are purely using the 3-minute timeframe.
In the image below, we can see a bullish setup whereas a FVG was successfully retested during the Silver Bullet session. This was then followed by a move upwards to liquidity as our target.
Alternatively, you can also see below a bearish setup utilizing the ICT Silver Bullet indicator outlined.
At this moment, the indicator has removed all other FVGs within the Silver Bullet session & has confirmed this FVG as the retested one.
There is also a support level marked below to be used as a liquidity target as per the ICT Silver Bullet concept suggests.
In the below chart we can see 4 separate consecutive examples of bullish & bearish setups on the 3-minute chart.
🔶 CONCEPTS
This technique can visualize potential support/resistance lines, which can be used as targets.
The script contains 2 main components:
• forming of a Fair Value Gap (FVG)
• drawing support/resistance (S/R) lines
🔹 Forming of FVG
1 basic principle: when a FVG at the end of the SB session is not retraced, it will be made invisible.
Dependable on the settings, different FVG's will be shown.
• 'All FVG': all FVG's are shown, regardless the trend
• 'Only FVG's in the same direction of trend': Only FVG's are shown that are similar to the trend at that moment (trend can be visualized by enabling ' Show ' -> ' Trend ')
-> only bearish FVG when the trend is bearish vs. bullish FVG when trend is bullish
• 'strict': Besides being similar to the trend, only FVG's are shown when the closing price at the end of the SB session is:
– below the top of the FVG box (bearish FVG)
– above bottom of the FVG box (bullish FVG)
• 'super-strict': Besides being similar to the trend, only FVG's are shown when the FVG box is NOT broken
in the opposite direction AND the closing price at the end of the SB session is:
– below bottom of the FVG box (bearish FVG)
– above the top of the FVG box (bullish FVG)
' Super-Strict ' mode resembles ICT lectures the most.
🔹 Drawing support/resistance lines
When the SB session has ended, the script draws potential support/resistance lines, again, dependable on the settings.
• Previous session (any): S/R lines are fetched between current and previous session.
For example, when current session is ' AM SB Session (10 AM — 11 AM) ', then previous session is
' London Open SB (3 AM — 4 AM) ', S/R lines between these 2 sessions alone will be included.
• Previous session (similar): S/R lines are fetched between current and previous - similar - session.
For example, when current session is ' London Open SB (3 AM — 4 AM)' , only S/R lines between
current session and previous ' London Open SB (3 AM — 4 AM) ' session are included.
When a new session starts, S/R lines will be removed, except when enabling ' Keep lines (only in strict mode) '
This is not possible in ' All FVG ' or ' Only FVG's in the same direction of trend ' mode, since the chart would be cluttered.
Note that in ' All FVG ' or ' Only FVG's in the same direction of trend ' mode, both, Support/Resistance lines will be shown,
while in Strict/Super-Strict mode:
• only Support lines will be shown if a bearish FVG appears
• only Resistance lines if a bullish FVG is shown
The lines will still be drawn the the end of the SB session, when a valid FVG appears,
but the S/R lines will remain visible and keep being updated until price reaches that line.
This publication contains a "Minimum Trade Framework (mTFW)", which represents the best-case expected price delivery, this is not your actual trade entry - exit range.
• 40 ticks for index futures or indices
• 15 pips for Forex pairs.
When on ' Strict/Super-Strict ' mode, only S/R lines will be shown which are:
• higher than the lowest FVG bottom + mTFW, in a bullish scenario
• lower than the highest FVG bottom - mTFW, in a bearish scenario
When on ' All FVG/Only FVG's in the same direction of trend ' mode, or on non-Forex/Futures/Indices symbols, S/R needs to be higher/lower than SB session high/low.
🔶 SETTINGS
(Check CONCEPTS for deeper insights and explanation)
🔹 Swing settings (left): Sets the length, which will set the lookback period/sensitivity of the Zigzag patterns (which directs the trend)
🔹 Silver Bullet Session; Show SB session: show lines and labels of SB session
Labels can be disabled separately in the ' Style ' section, color is set at the ' Inputs ' section.
🔹 FVG
– Mode
• All FVG
• Only FVG's in the same direction of trend
• Strict
• Super-Strict
– Colors
– Extend: extend till last bar of SB session
🔹 Targets – support/resistance lines
– Previous session (any): S/R lines fetched between current and previous SB session
– Previous session (similar): S/R lines fetched between current and previous similar SB session
– Colors
– Keep lines (only in strict mode)
🔹 Show
– MSS ~ Session: Show Market Structure Shift , only when this happens during a SB session
– Trend: Show trend (Zigzag, colored ~ trend)

Liquidity Sweeps and RaidsThis basic script calculates and plots runs on liquidity levels through Raids and Sweeps. When the price violates the 3 fractal level, a raid or sweep occurs. You can use it to automate markup, understand liquidity levels, and reduce human error in your analysis. Additionally, you can set up an alarm to notify you when new sweeps or raids occur. Combine it with your current strategy or try any price action theory you prefer. Essentially, the price always seeks liquidity, so when some of it is taken, it makes sense to look for a reaction and potential reversal. Stay ahead by capitalizing on liquidity insights for potential reversals. Cheers, Cancamurria.

Market Structure CHoCH/BOS (Fractal) [LuxAlgo]The Market Structure CHoCH/BOS (Fractal) indicator is an experimental take on classical market structure, whereas fractal patterns are used for their construction instead of swing points.
Compared to utilizing swing points for highlighting market structure like our Smart Money Concepts indicator , fractal-based market structure can appear as more adaptive, however, it can also be more restrictive when it comes to returning swing points which can cause the indicator to miss reversals in some cases.
If enabled from within the settings, users can see support and resistance levels returned from the detected market structure with breakouts highlighted on the chart. Alongside this feature, an additional dashboard showing the structure to fractal structure percentage is also provided.
🔶 SETTINGS
Length: Length of the fractal patterns to detect.
🔹 Style
Bullish Structures: Show bullish structures.
Bearish Structures: Show bullish structures.
Support: Show support levels.
Resistance: Show resistance levels.
🔹 Dashboard
Show Dashboard: Show structure to fractal percentage dashboard on the chart.
Location: Location of the dashboard on the chart.
Size: Dashboard size.
🔶 USAGE
Market structure is commonly used to determine trend direction by using price positions relative to prior swing points. Using fractal patterns to determine market structure can allow users to obtain shorter, more frequent structure labels.
Market structure is commonly classified as follows:
Change of Character (CHoCH), also referred to as Market Structure Shift (MSS)
Break of Structure (BOS), also referred to as Market Structure Break (MSB)
Change of Characters indicate a shift in the market trend, confirming trend reversals. Break of Structures on the other hand occur once a trend is already determined, confirming new higher highs/lower lows.
Using higher length values allow users to detect longer-term fractals, thus highlighting longer-term market structures. The image above detects fractal patterns made of 7 candles, even if the increment is only of 2 bars this significantly reduces the amount of detected market structure labels.
The result obtained by utilizing fractals and higher settings can be a more dynamic view of market structure, however, as seen in the image above this can introduce very significant delay compared to utilizing pure swing points.
🔹 Support/Resistance
The indicator also returns support/resistance levels constructed from the market structure, these levels are obtained similarly to order blocks, finding the minimum on the interval of a bullish market structure and the maximum of a bearish market structure.
Price reaching a support/resistance level can be expected to bounce from it. Once a level is broken, the support/resistance level will no longer extend, and a circle will be displayed highlighting the break.
While utilizing this script for fractal-based market structure, these levels can be useful to ensure all swing points are still considered by the user with the possibility of the indicator missing reversals due to its calculation not being based on swing points themselves.
🔹 Dashboard
The dashboard reports the structure to fractal percentage, that is the amount of bullish/bearish market structures relative to the total amount of detected bullish/bearish fractal patterns.
This allows us to see how often a detected fractal pattern is used to display a market structure.
🔶 DETAILS
🔹 Fractals
In the context of technical analysis, Fractals refer to specific patterns that exhibit self-similarity at different scales or timeframes.
The most commonly known fractal pattern consists of a consecutive sequence of candles (more commonly 5), with the central candle being the lowest (in case of a bullish fractal) or highest (in case of a bearish fractal).
A bullish fractal has candles on the right side of the central candle with increasing lows, while candles on the left side have decreasing lows.
A bearish fractal has candles on the right side of the central candle with decreasing highs, while candles on the left side have increasing highs.
🔶 RELATED SCRIPTS
🔹 Smart Money Concepts
🔹 Market Structure Trailing Stop
🔹 ICT Concepts

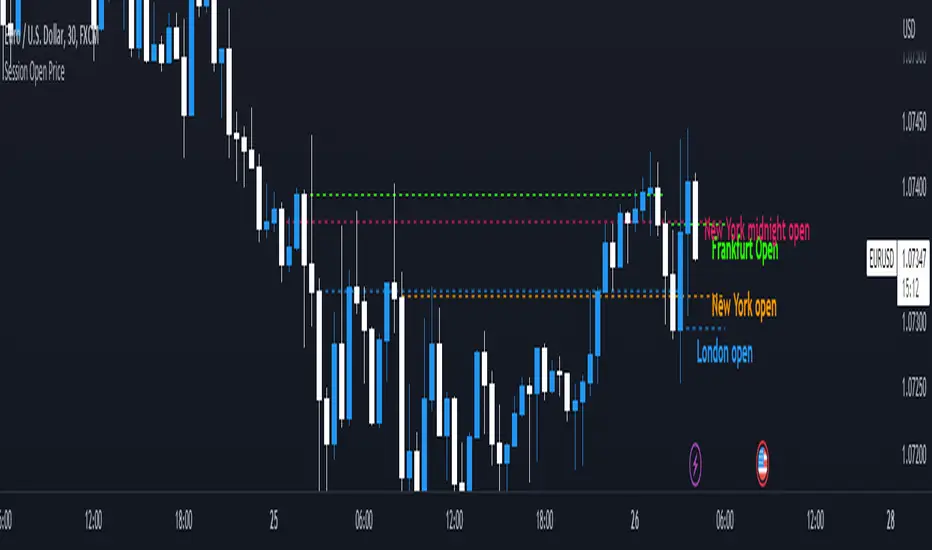
Session Open PriceThis Indicator displays the ICT kill zones' open price
You will be able to see the following open prices (ALL TIMES ARE IN NEW YORK TIME)
All times and appearances are customisable to your own liking.
The default time setting is recommended
- 00:00 AM Midnight New York Open Price (RED DASH LINE)
- 2:00 AM Frankfurt Open Price (GREEN DASH LINE)
- 3:00 AM London Open Price (BLUE DASH LINE)
- 8:30 AM New York Open Price (ORANGE DASH LINE)
HOW TO USE SESSION OPEN PRICE IN YOUR TRADING
If the price is above the opening price you only look for sells whereas if the price is under the opening price you only look for buys
BUY EXAMPLE
Wait for Midnight New York and Frankfurt open price to display
The price must be under both prices
Look for a Market maker buy model or your own entry model
Stoploss will be at the swing low and Take profit can be a fixed RR or how you calculate your take profit level
Buyside & Sellside Liquidity [LuxAlgo]The Buyside & Sellside Liquidity indicator aims to detect & highlight the first and arguably most important concept within the ICT trading methodology, Liquidity levels.
🔶 SETTINGS
🔹 Liquidity Levels
Detection Length: Lookback period
Margin: Sets margin/sensitivity for a liquidity level detection
🔹 Liquidity Zones
Buyside Liquidity Zones: Enables display of the buyside liquidity zones.
Margin: Sets margin/sensitivity for the liquidity zone boundaries.
Color: Color option for buyside liquidity levels & zones.
Sellside Liquidity Zones: Enables display of the sellside liquidity zones.
Margin: Sets margin/sensitivity for the liquidity zone boundaries.
Color: Color option for sellside liquidity levels & zones.
🔹 Liquidity Voids
Liquidity Voids: Enables display of both bullish and bearish liquidity voids.
Label: Enables display of a label indicating liquidity voids.
🔹 Display Options
Mode: Controls the lookback length of detection and visualization, where Present assumes last 500 bars and Historical assumes all data available to the user
# Visible Levels: Controls the amount of the liquidity levels/zones to be visualized.
🔶 USAGE
Definitions of Liquidity refer to the availability of orders at specific price levels in the market, allowing transactions to occur smoothly.
In the context of Inner Circle Trader's teachings, liquidity mainly relates to stop losses or pending orders and liquidity level/pool, highlighting a concentration of buy or sell orders at specific price levels. Smart money traders, such as banks and other large institutions, often target these liquidity levels/pools to accumulate or distribute their positions.
There are two types of liquidity; Buyside liquidity and Sellside liquidity .
Buyside liquidity represents a level on the chart where short sellers will have their stops positioned, and Sellside liquidity represents a level on the chart where long-biased traders will place their stops.
These areas often act as support or resistance levels and can provide trading opportunities.
When the liquidity levels are breached at which many stop/limit orders are placed have been traded through, the script will create a zone aiming to provide additional insight to figure out the odds of the next price action.
Reversal: It’s common that the price may reverse course and head in the opposite direction, seeking liquidity at the opposite extreme.
Continuation: When the zone is also broken it is a sign for continuation price action.
It's worth noting that ICT concepts are specific to the methodology developed by Michael J. Huddleston and may not align with other trading approaches or strategies.
🔶 DETAILS
Liquidity voids are sudden changes in price when the price jumps from one level to another. Liquidity voids will appear as a single or a group of candles that are all positioned in the same direction. These candles typically have large real bodies and very short wicks, suggesting very little disagreement between buyers and sellers. The peculiar thing about liquidity voids is that they almost always fill up.
🔶 ALERTS
When an alert is configured, the user will have the ability to be notified in case;
Liquidity level is detected/updated.
Liquidity level is breached.
🔶 RELATED SCRIPTS
ICT-Concepts
ICT-Macros
Imbalance-Detector

SMT Divergences [LuxAlgo]The SMT Divergences indicator highlights SMT divergences between the chart symbol and two user-selected tickers (ES and YM by default).
A dashboard returning the SMT divergences statistics is also provided within the settings.
🔶 SETTINGS
Swing Lookback: Calculation window used to detect swing points.
Comparison Ticker: If enabled, will detect SMT divergences between the chart prices and the prices of the selected ticker.
🔹 Dashboard
Show Dashboard: Displays statistics dashboard on the chart.
Location: Location of the dashboard on the chart.
Size: Size of the displayed dashboard.
🔶 USAGE
SMT Divergences are characterized by diverging swing points between two securities.
The detection of SMT Divergences is performed by detecting swing points using the user chart prices as well as the prices of the selected external tickers. If a swing point on the chart ticker is detected at the same time on external tickers, comparison is performed.
Due to the detection requiring swing point confirmation (3 candles by default), this indicator can better be used to study price behaviors on the occurrence of an SMT divergence.
The dashboard highlights the number of SMT divergences that occurred on a swing high and swing low between the chart ticker and the selected external tickers.
The returned percentage indicates the proportion of swing highs or swing lows that led to an SMT divergence.

ICT Macros [LuxAlgo]The ICT Macros indicator aims to highlight & classify ICT Macros, which are time intervals where algorithmic trading takes place to interact with existing liquidity or to create new liquidity.
🔶 SETTINGS
🔹 Macros
Macro Time options (such as '09:50 AM 10:10'): Enable specific macro display.
Top Line , Mid Line , Bottom Line and Extending Lines options: Controls the lines for the specific macro.
🔹 Macro Classification
Length : A length to detect Market Structure Brakes and classify macro type based on detection.
Swing Area : Swing or Liquidity Area selection, highest/lowest of the wick or the candle bodies.
Accumulation , Manipulation and Expansion color options for the classified macros.
🔹 Others
Macro Texts : Controls both the size and the visibility of the macro text.
Alert Macro Times in Advance (Minutes) : This option will plot a vertical line presenting the start of the next macro time. The line will not appear all the time, but it will be there based on remaining minutes specified in the option.
Daylight Saving Time (DST) : Adjust time appropriate to Daylight Saving Time of the specific region.
🔶 USAGE
A macro is a way to automate a task or procedure which you perform on a regular basis.
In the context of ICT's teachings, a macro is a small program or set of instructions that unfolds within an algorithm, which influences price movements in the market. These macros operate at specific times and can be related to price runs from one level to another or certain market behaviors during specific time intervals. They help traders anticipate market movements and potential setups during specific time intervals.
To trade these effectively, it is important to understand the time of day when certain macros come into play, and it is strongly advised to introduce the concept of liquidity in your analysis.
Macros can be classified into three categories where the Macro classification is calculated based on the Market Structure prior to macro and the Market Structure during the macro duration:
Manipulation Macro
Manipulation macros are characterized by liquidity being swept both on the buyside and sellside.
Expansion Macro
Expansion macros are characterized by liquidity being swept only on the buyside or sellside. Prices within these macros are highly correlated with the overall trend.
Accumulation Macro
Accumulation macros are characterized by an accumulation of liquidity. Prices within these macros tend to range.
The script returns the maximum/minimum price values reached during the macro interval alongside the average between the maximum/minimum and extends them until a new macro starts. These levels can act as supports and resistances.
🔶 DETAILS
All required data for the macro detection and classification is retrieved using 1 minute data sets, this includes candles as well as pivot/swing highs and lows. This approach guarantees the visually presented objects are same (same highs/lows) on higher timeframes as well as the macro classification remain same as it is in 1 min charts.
8 Macros can be displayed by the script (4 are enabled by default):
02:33 AM 03:00 London Macro
04:03 AM 04:30 London Macro
08:50 AM 09:10 New York Macro
09:50 AM 10:10 New York Macro
10:50 AM 11:10 New York Macro
11:50 AM 12:10 New York Launch Macro
13:10 PM 13:40 New York Macro
15:15 PM 15:45 New York Macro
🔶 ALERTS
When an alert is configured, the user will have the ability to be notified in advance of the next Macro time, where the value specified in 'Alert Macro Times in Advance (Minutes)' option indicates how early to be notified.
🔶 LIMITATIONS
The script is supported on 1 min, 3 mins and 5 mins charts.
🔶 RELATED SCRIPTS

FVG Sessions [LuxAlgo]The FVG Sessions indicator highlights the first fair value gap of the trading session as well as the session range. Detected fair value gaps extend to the end of the trading session.
Alerts are included on the formation of a session fair value gap, price being within a session fair value gap, mitigations, and price crossing session fair value gaps average.
🔶 USAGE
Trader ICT states that the first fair value gap of the trading session can attract the most significant reaction. Having only one FVG per session allows users to further focus on that precise imbalance as well as external elements.
The mitigation of a fair value gap is clearly indicated on the chart with a more transparent color allowing users to see inverse FVGs.
Extending the fair value gaps allows the imbalance area to provide potential support and resistance.
Do note that this script should be used on intraday charts.
🔶 ALERTS
The script includes the following alerts:
🔹 Bullish/Bearish FVG
Alerts on the formation of the first bullish or bearish FVG of the session.
🔹 Bullish/Bearish FVG Mitigation
Alerts when the first bullish or bearish FVG of the session is mitigated.
🔹 Price Within FVG
Alerts when price is within the first bullish or bearish FVG area of the session.
🔹 Price Cross FVG Average
Alerts when price cross the average level of the first bullish or bearish FVG of the session.

Breaker Blocks with Signals [LuxAlgo]The Breaker Blocks with Signals indicator aims to highlight a complete methodology based on breaker blocks. Breakout signals between the price and breaker blocks are highlighted and premium/discount swing levels are included to provide potential take profit/stop loss levels.
This script also includes alerts for each signal highlighted.
🔶 SETTINGS
🔹 Breaker Blocks
Length: Sensitivity of the detected swings used to construct breaker blocks. Higher values will return longer term breaker blocks.
Use only candle body: Only use the candle body when determining the maximum/minimum extremities of the order blocks.
Use 2 candles instead of 1: Use two candles to confirm the occurrence of a breaker block.
Stop at first break of center line: Do not highlight breakout signals after invalidation until reset.
🔹 PD Array
Only when E is in premium/discount zone: Only set breaker block if point E of wave ABCDE is within the corresponding zone.
Show premium discount zone: Show premium/discount zone.
Highlight Swing Break: Highlight occurrences of price breaking a previous swing level.
Show Swings/PD Arrays: Show swing levels/labels and pd areas.
🔶 USAGE
The Breaker Blocks with Signals indicator aims to provide users with a minimalistic display alongside optimal signals to be aware of for finding trade setups as shown below.
Here we can see a MSS occurred allowing the indicator to detect a Breaker Block (-BB) & display a red arrow to confirm this signal.
The signal(s) that can be used for potential entries are only during retests of the breaker blocks.
A potential strategy traders could use with this indicator is to target the corresponding Discount PD Arrays detected (for a short position) and Premium PD Arrays (for a long position).
In the image above we can see price generated the potential entry signals in orange & fell to the Discount PD Arrays as a logical setup to look for with this indicator.
As we can see in the image above, signals can be considered invalid when price closes above the 50% level in which it would be suggested to wait for another setup.
Users still looking for more potential setups based on the same breaker block can disable the "Stop at first break of center line" setting within the settings menu.
In the image above we can see a bullish example whereas price confirmed a bullish breaker block (+BB), had a quick pullback into it that was confirmed by the green arrow, and then reached the Premium PD Arrays.
While retests of breaker blocks can still function well if they occur later in the price action, it's most preferable for users to look for entry signals that are near confirmed breaker blocks (5-10 bars) opposed to waiting 20+ bars.
Additional take profits based on the occurence of the breaker blocks are given in order to provide targets after the occurence of a breaker block breakout.
🔶 DETAILS
Breaker blocks are formed after a mitigated order block, these can provide change of polarity opportunities, thus playing a role as a potential support/resistance. It is the re-test/retrace of price to a breaker block that will set the conditions to provide signals.
The above chart describes the creation of a breaker block.
The signal generation logic makes use of various rules described below:
Bullish Breaker Blocks:
opening price is within the breaker block, while the closing price is above the upper extremity of the breaker block.
Price did not cross the breaker block average in the interval since the previous breakout.
Bearish Breaker Blocks:
opening price is within the breaker block, while the closing price is below the lower extremity of the breaker block.
Price did not cross the breaker block average in the interval since the previous breakout.
When a new pattern is formed, all previous drawings are removed.
🔶 RELATED SCRIPTS
