ATR Stop Loss Zones [ziksfx]The indicator is a dynamic tool that helps traders identify potential stop-loss levels in trending markets. It calculates the Average True Range (ATR) and uses it to create upper and lower boxes around the closing price. These boxes visually represent potential stop-loss zones for long and short positions.
Originality and Usefulness:
This indicator stands out for its unique ability to dynamically adjust stop-loss zones based on market volatility using the ATR approach. This provides traders with a flexible and adaptable risk management tool that adapts to changing market conditions. By visually representing potential stop-loss levels, taking into account the inherent uncertainty of market movements, the indicator empowers traders to make informed decisions about placing stop loses ONLY in trend markets. This allows them to maximize profit potential while minimizing potential downside risk.
Functionality:
Calculates the ATR based on the closing price.
Creates upper and lower of box by adding and subtracting the ATR multiplied by a predefined multiplier (1.5) to the closing price, then generates dynamic boxes based on the upper and lower ATR values.
Indicator allows traders to choose to display boxes for long, short, or both positions simultaneously.
Enables customization of box colors to suit individual preferences and trading styles.
Can be used as a dynamic trailing stop-loss mechanism.
Long box: Enable or disable the display of box for long positions.
Short box: Enable or disable the display of box for short positions.
Color Long Box: Set the color of the box for long positions.
Color Short Box: Set the color of the box for short positions.
Disclaimer:
This information is for educational purposes only and should not be considered financial advice. Remember that trading involves risk, and you could lose money. Always do your own research and consult with a financial professional before making any investment decisions.
在腳本中搜尋"stop loss"

Risk Management GO8686: Stop Loss, Position Size & TargetFull Name: Risk Management GO8686: Stop Loss, Position Size & Target
What this indicator provides:
A dashboard to calculate Stop Loss, Position Size and Target, where users can customize Risk Management parameters in the setting.
Position Size: calculated from "initialCapital", "Leverage", "Max Loss", "feeMaker", "feeTaker".
Stop Loss Price: using pivots, default length is set to 3, with an extra ATR value controlled by "'Multiplier OF Extra ATR".
Target: calculated from entry price, risk reward, distance between entry and stop loss, fees
What the indicator does Not provides:
entries of positions: The Long/Short entries displayed are just MACD signal crossing zero, users can apply their own entry logic, by modifying ready2L / ready2S variables.
What the indicator does Not guarantee:
the integrity, timeliness, accuracy, and comprehensiveness of the data, calculation method, calculation results, etc.
Two types labels:
1. Automated labels: they are displayed when MACD signal crossing zero, use "Display History Labels" to toggle display or not.
2. Setup Manually label: located at the right side of the latest bar, to display results when users setup manually
The settings of the indicator:
"Toggle to Reload",
"InitialCapital", "Leverage", "Max Loss % per trade", "feeMaker", "feeTaker",
4 length inputs for Pivot, "Multiplier of Extra ATR for stop loss",
"Toggle To setup manually", "Toggle between Long / Short", "Entry Price, set manually", "Stop Loss Price, set manually", "Risk-Reward Ratio"
"Display History Labels"
---------- Disclaimer ----------
Before using or requesting access to the indicator, customers/users acknowledge that they have read and accepted that the indicator, any associated contents on all social medias and any communication with the indicator author, including but not limited to: product and service details, signals, alerts, data, calculation methods, calculation results, user manual, tutorials, ideas, videos, chats, messages, emails, blogs, tweets, etc. are provided solely for educational purpose and Not as financial advice. Customers/users understand and agree to use the aforementioned indicator and information at their own risk.
---------- Updates ----------
The latest updates override the previous content.
To activate a update, if it does not load as expected: close the indicator, save the chart, clear browser caches, restart the browser, reload the chart and apply the indicator to the chart.

Vwap Stop lossThe VWAP Stop Loss indicator is a technical analysis tool that helps traders determine where to set their stop loss levels based on the Volume-Weighted Average Price ( VWAP ).
This indicator calculates the VWAP based on a specified length and multiplies it by a factor, which helps determine the distance for the stop loss levels.
When using this indicator, the red line represents the short stop loss level and the teal line represents the long stop loss level.
The lines will adjust automatically with the changing price action to ensure they always remain at the appropriate distance from the VWAP .
This indicator can be used on any time frame and for any market, making it a versatile tool for traders.
It can help you manage your risk by providing an objective method for setting stop loss levels, which can help increase the chances of successful trades.
Additionally, this indicator can also be used in combination with other technical indicators to help make more informed trading decisions.

Trail Blaze - (Multi Function Trailing Stop Loss) - [mutantdog]Shorter version:
As the title states, this is a 'Trailing Stop' type indicator, albeit one with a whole bunch of additional functionality, making it far more versatile and customisable than a standard trailing stop.
The main set of features includes:
Three independent trailing types each with their own +/- multipliers:
- Standard % change
- ATR (aka Supertrend)
- IQR (inter-quartile range)
These can be used in isolation or summed together. A subsequent pair of direction specific multipliers are also included.
Two separate custom source inputs are available, both feature the standard options alongside a selection of 'weighted inputs' and the option to use another indicator (selected via 'AUX'):
- 'Centre' determines the value about which the trailing sum will be added to define the stop level.
- 'Trigger' determines the value used for crossing of stops, initiating trend changes and triggering alerts.
A selection of optional filters and moving averages are available for both.
Furthermore there are various useful visualisation options available, including the underlying bands that govern the stop levels. Preset alerts for trend reversals are also included.
This is not really an 'out-of-the-box' indicator. Depending upon the market and timeframe some adjustments will be necessary for it to function in a useful manner, these can be as simple or complex as the feature-set allows. Basic settings are easy to dial in however and the default state is intended as a good starting point. Alternatively with some experimentation, a plethora of unique and creative configurations are possible, making this a great tool for tweaking. Below is a more detailed overview followed by a bunch of simple example settings.
------------------------
Lengthy Version :
DESIGN & CONCEPT
Before we start breaking this down, a little background. This started off as an attempt to improve upon the ever-popular Supertrend indicator. Of course there are many excellent user created variants available utilising some interesting methods to overcome the drawbacks of the basic version. To that end, rather than copying the work of others, the direction here shifted towards a hybrid trailing stop loss with a bunch of additional user customisation options. At some point, a completely different project involving IQR got morphed into this one. After sitting through months of sideways chop (where this proved to be of limited use), at the time of publication the market has began to form some near term trend direction and it appears to be performing well in many different timeframes.
And so with that out of the way...
INPUTS
The standard Supertrend (and most other variants) includes a single source input, as default set to 'hl2' (candle mid-range). This is the centre around which the atr bands are added/subtracted to govern the stop levels. This is not however the value which is used to trigger the trend reversal, that is usually hard-coded to 'close'. For this version both source values are adjustable: labelled 'centre' and 'trigger' respectively.
Each has custom input selectors including the usual options, a selection of 'weighted inputs' and the option to use another indicator (selected from the Aux input). The 'weighted inputs' are those introduced in Weight Gain 4000, for more details please refer to that listing. These should be treated as experimental, however may prove useful in certain configurations. In this case 'hl-oc2' can be considered an estimate of the candle median and may be a good alternative to the default 'centre' setting of 'hl2', in contrast 'cc-ohlc4' can tend to favour the extremes in the trend direction so could be useful as a faster 'trigger' than the default 'close'.
To cap them off both come with a selection of moving average filters (SMA, EMA, WMA, RMA, HMA, VWMA and a simple VWEMA - note: not elastic) aswell as median and mid-range. 'Centre' can also be set to the output of 'trigger' post-filter which can be useful if working with fast/slow crosses as the basis.
DYNAMICS
This is the main section, comprised of three separate factors: 'TSL', 'ATR' and 'IQR'. The first two should be fairly obvious, 'TSL' (trailing stop loss) is simply a percentage of the 'centre' value while 'ATR' (average true range) is the standard RMA-based version as used in Supertrend, Volatility Stop etc.
The third factor is less common however: 'IQR' (inter-quartile range). In case you are unfamiliar the principle here is, for a given dataset, the greatest 25% and smallest 25% of samples are removed. The remainder is then treated as a set and the range is calculated by highest - lowest. This is a commonly used method in statistical analysis, by removing the extremes it is less prone to influence by outliers and gives a good representation of the main dispersion around the median. In practise i have found it can be a good alternative to ATR, translating better across multiple time-frames due to it representing a fraction of the total range rather than an average of per-candle range like ATR. Used in combination with the others it can also add a factor more representative of longer-term/higher-timeframe trend. By discarding outliers it also benefits from not being impacted by brief pumps/volatility, instead responding only to more sustained changes in trend, such as rallies and parabolic moves. In order to give an accurate result the IQR is calculated using a dataset of high, low and hlcc4 values for all bars within the lookback length. Once calculated this value is then halved which, strictly speaking, makes it a semi-interquartile range.
All three of these components can be used individually or summed together to create a hybrid dynamics factor. Furthermore each multiplier can be set to both positive and negative values allowing for some interesting and creative possibilities. An optional smoothing filter can be applied to the sum, this is a basic SWMA-4 which is can reduce the impact of sudden changes but does incur a noticeable lag. Finally, a basic limiter condition has been hard-coded here to prevent the sum total from ever going below zero.
Capping off this section is a pair of direction multipliers. These simply take the prior dynamics sum and allow for further multiplication applied only to one side (uptrend/lo-stop and downtrend/hi-stop). To see why this is useful consider that markets often behave differently in each direction, we've all seen prices steadily climb over several weeks and then abruptly dump in the process of a day or two, shorter time frames are no stranger to this either. A lack of downside liquidity, a panicked market, aggressive shorts. All these things contribute to significant differences in downward price action. This function allows for tighter stops in one direction compared to the other to reflect this imbalance.
VISUALISATIONS
With all of these options and possibilities, some visual aids are useful. Beneath the dynamics' section are several visual options including both sources post-filter and the actual 'bands' created by the dynamics. These are what govern the stop levels and seeing them in full can help to better understand what our various configurations actually do. We can even hide the stop levels altogether and just use the bands, making this a kind of expanded Keltner Channel. Here we can also find colour and opacity settings for everything we've discussed.
EXAMPLES
The obvious first example here is the standard %-change trailing stop loss which, from my experience, tends to be the best suited for lower time frames. Filtering should probably minimal here. In both charts here we use the default config for source inputs, the top is a standard bi-directional setup with 1.5% tsl while the bottom uses a 2.5% tsl with the histop multiplier reduced to 0 resulting in an uptrend only stoploss.
Shown here in grey is the standard Supertrend which uses 'hl2' as centre and 'close' as trigger, ATR(10) multiplied by 3. On top we have the default filtered source config with ATR(8) multiplied by 2 which gives a different yet functionally similar result, below is the same source config instead using IQR(12) multiplied by 2. Notice here the more 'stepped' response from IQR following the central rally, holding back for a while before closing in on price and ultimately initiating reversal much sooner. Unlike ATR, the length parameter for IQR is absolute and can more significantly affect its responsiveness.
Next we focus on the visualisation options, on top we have the default source config with ATR(8) multiplied by 2 and IQR(12) multiplied by 1. Here we have activated the switch to show 'bands', from this we can see the actual summed dynamics and how it influences the stop levels. Below that we have an altogether different config utilising the included filters which are now visible. In this example we have created a basic 8/21 EMA cross and set a 1% TSL, notice the brief fakeout in the middle which ordinarily might indicate a buy signal. Here the TSL functions as an additional requirement which in this case is not met and thus no buy signal is given.
Finally we have a couple of more 'experimental' examples. On top we have Lazybear's 'Variable Moving Average' in white which has been assigned via 'aux' as the centre with no additional filtering, the default config for trigger is used here and a basic TSL of 1.5% added. It's a simple example but it shows how this can be applied to other indicators. At the bottom we return to the default source config, combining a TSL of 8% with IQR(24) multiplied by -2. Note here the negative IQR with greater length which causes the stop to close in on price following significant deviations while otherwise remaining fairly wide. Combining positive and negative multiples of each factor can yield mixed results, some more useful than others depending upon suitable market conditions.
Since this has been quite lengthy, i shall leave it there. Suffice to say that there are plenty more ways to use this besides these examples. Please feel free to share any of your own ideas in the comments below. Enjoy.

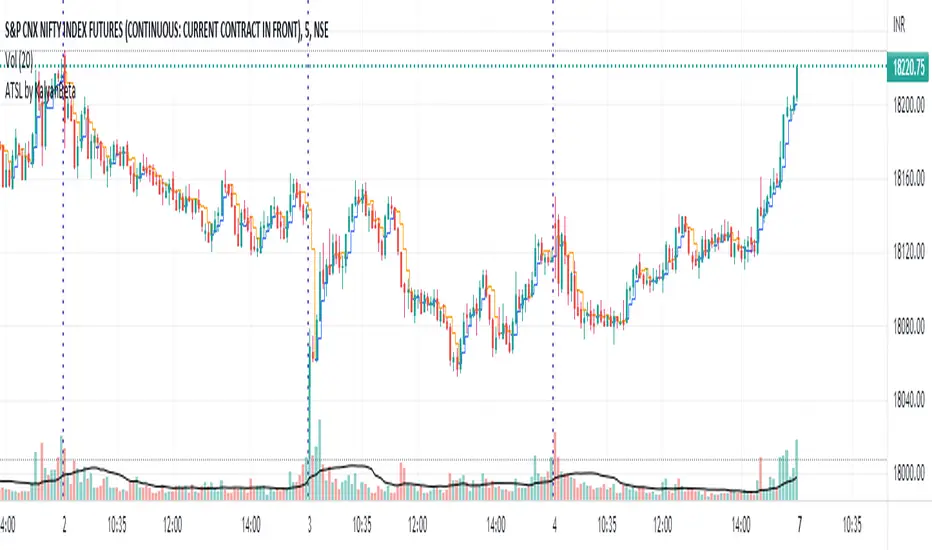
Anti-trap Trailing Stop Loss by KalyanBetaAnti-trap Trailing Stop Loss by KalyanBeta or ATSL
ATSL changes color when there it identifies price manipulation/ SL Hunting / Traps by Smart Money.
Change in color may be an exit signal for your trade in current direction.
This is a very simple indicator which can be used to predict Traps or Stop-loss hunting.
This can help in Trailing Stop-loss and in Exit decisions along with your own strategy.
ATSL may be used in all timeframes.
Please back-test it along with your strategy and then use it for Trailing the Stop-loss without getting trapped by operators and stop-loss hunters.
All the best.
Do post your feedback in comments below. Thank you.
ATR Stop Loss and Take Profit FinderThe purpose of this tool is to help the trader determine a safe stop loss price and take profit which dynamically changes due to ATR (Average True Range)
This tool uses the concept of
ATR (Average True Range)
Risk Reward Ratio (Money Management method)
How is ATR Stop Loss and Take Profit Finder working
Step 1 ) Tool will calculate TR(True Range
Step 2) Then the TR will be used to find the Average value of X time frame, using 5 math models: RMA SMA EMA WMA and LSMA
Step 3) The value from Step 2 will be multiplied by the factor, and the result is ATR
After we got ATR Value, the Tool will find 2 lines: Upper Band and Lower Band which will function as a Stoploss value for both Short and Long trade
ATR Stop Loss and Take Profit Finder will be using Upper Band and Lower Band to calculate Take profit price. A trader can set their Target Risk Reward Ratio by setting
How to use ATR Stop Loss and Take Profit Finder
ATR Stop Loss and Take Profit Finder is not an indicator, it is only a tool to help the trader quickly find their stop loss/take profit price. t
For open long position, We comment trade to switch mode of 'Type of open Position to be long. Same as short which is need to be changed to short

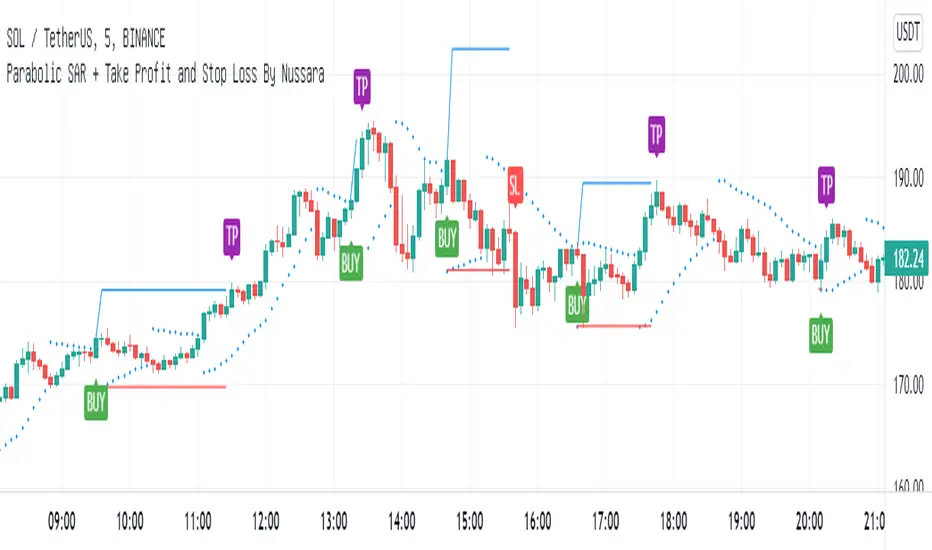
Parabolic SAR + Take Profit and Stop Loss By NussaraThis strategy uses Parabolic SAR. The Parabolic SAR is a technical indicator developed by J. Welles Wilder to determine the direction that an asset is moving. The indicator is also referred to as a stop and reverse system, which is abbreviated as SAR. It aims to identify potential reversals in the price movement of traded assets.
This indicator has a function to take profit and stop loss level.
Stop loss level = First reverse point of uptrend
Take profit level = Entry price + (Entry price-Stop loss level)
User can set a parabolic SARS and a profit point but I fixed stop loss level at first reversals point of uptrend. I also put alert for Buy, Sell, Stop Loss in this indicator.
This indicator is just a tool for technical analysis. It shouldn't be used as the only indication of trade because it causes you to lose your money. You should use other indicators to analyze together.
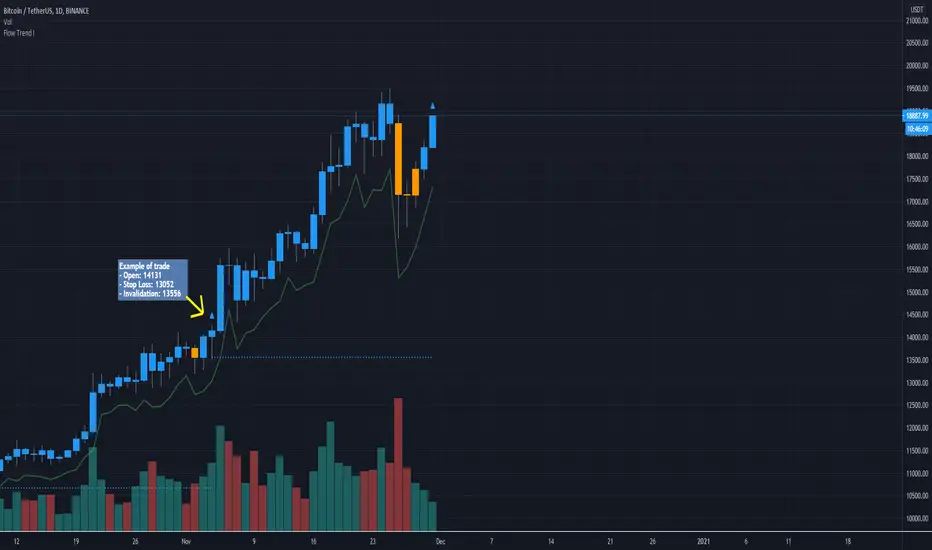
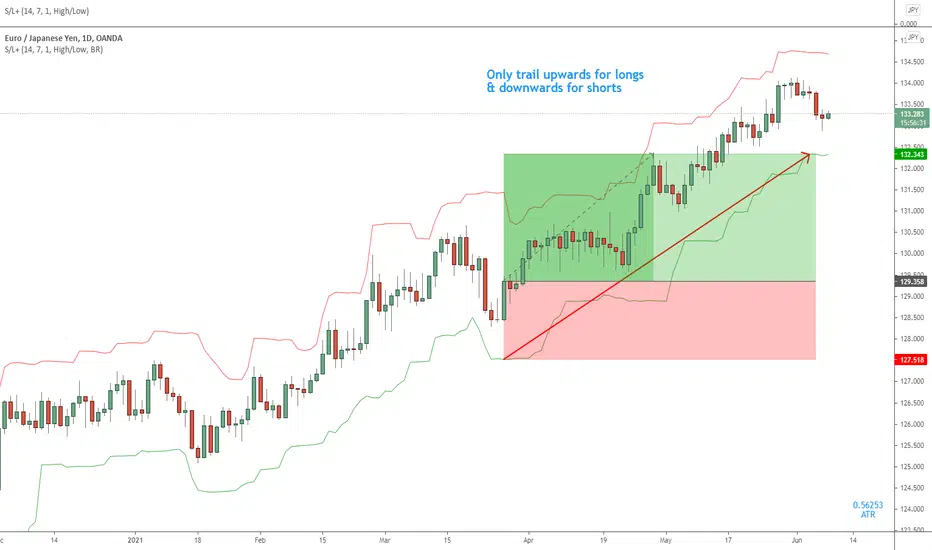
Flow Trend I: Trend Signals (with stop loss and invalidation)Description
Flow Trend I is a Trend Following & Analysis indicator.
It attempts to characterize Long or Short trends to give a trader more confidence when opening a trade.
It can also be used as an analysis tool with no direct trading or investment in mind.
The calculation is based on Support & Resistance levels: S/R levels are calculated then we assume when price breaks out of a certain level, a new trend starts.
Blue candle: LONG trend (positive returns)
Orange candle: SHORT trend (negative returns)
Grey candle: NEUTRAL trend (not conclusive, price within S/R levels)
The indicator also provides other features:
Long/Short signals (arrows): a point to buy when a trend is confirmed
Stop Loss Level (green line): volatility based stop loss
Invalidation level (dotted lines): a point to exit the trade manually
Markets
This indicator has been designed for cryptocurrency markets in mind but is useful on trending markets in general. Avoid range bound markets (low timeframes, forex...) where trends are minimal and stop will be often hit. Avoid "low satoshi" coins (for example DOGE) as they break calculations: tight ranges make it difficult to see trends.
Entry
If the indicator shows a Blue (long) arrow, taking a long position is advised.
Open price reference is the close price of a confirmed candle marked by an arrow.
Stop Loss
Position Sizing is mandatory when following a trend indicator, the following can be applied to any indicator:
- Use the Green line (volatility stop) as the Stop Loss (if price goes lower, trade will be closed)
- Trades should be sized so a fixed % of a portfolio is lost in the event of a stop being hit (1%... 2%)
Stops are meant as protection only, they should not be hit often.
Exit
If there is a candle close under the Invalidation level (dotted line), close the trade.
If there is an opposite signal (for example: yellow candle while in a long trade), close or reduce position size.
As the trade progresses, you can move the stop loss up, following the green line to secure profits!
Take profit
No take profit points are provided explicitly.
More notes
- Scaling-in: it is interesting to build a position slowly to control risk. For example, if the position to open is 1000 units. Open 1/4 after a signal, then 1/4 the next day if the trend is still long (Blue) and so on until the position has been fully built.
- Configuration:
* Long/Short signals: they can be toggled in the script options to show Long only, Short only or both.
* Trend Confirmation: defines how many periods the algo waits before showing a signal. The default is 1, meaning, 1 candle is needed after a trend starts to show a signal. Lower values creates more signals, higher values less.
* Stop Loss Factor: increasing this will increase the stop distance (which in result will lower your position size)
- Multi timeframe analysis:
Use the indicator on multiple timeframes to get the big picture: what is the current trend on the weekly? then daily? then 4h?
There are trends within trends... Does it makes sense take risk shorting the 4h if there is a long trend on the daily?
* Position sizing calculation example:
- 1000$ portfolio, RISK per trade: 2%
- RISK = 2% of 1000 = 20$
- TSLA price is 500$
- Stop price: 450$
= SIZE: RISK / (Open Price - Stop Price) = 20 / (500 - 450) = 0.4 TSLA stock
Market Adaptive Stop-LossI realized that the zone changes in the stoploss remained slow, so I couldn't make enough use of the characteristics of technical indicators when opening positions.
This pushed me to keep stop-loss under the influence of a dependent variable.
This script helped me a lot (everget) :
I've redesigned the stop-loss to be affected by intersections.
Therefore, this script is also suitable for adaptive moving averages, fractional periods.
Script features:
1.You can select calculation methods created by using various technical analysis methods from the scripts' settings:
-Moving Average Convergence Divergence ( Macd )
-Stochastic Oscillator ( Stoch )
-Stochastic Relative Strength Index (StochRSI)
-Stochastic Money Flow Index (StochMFI ) (More info : )
-Know Sure Thing ( KST )
-OBV ( On Balance Volume )
-SMA ( Simple Moving Average )
-EMA ( Exponential Moving Average )
-FISHERTRANSFORM ( Fisher Transform )
-AWESOMEOSCILLATOR( Awesome Oscillator )
-PSAR ( Parabolic Stop and Reverse - Parabolic SAR )
-HULLMA( Hull Moving Average )
-VWMA ( Volume Weighted Moving Average )
-RMA (Moving Average using in Relative Strength Index calculations.)
-COG (Center of Gravity )
-ACC-DIST ( Accumulation / Distribution Index )
2 - The region is determined according to the above calculation methods and if it is larger or smaller than the previous stop loss level.
And if the price in the negative zone is lower than the stoploss, it is the exact signal and is shown with more highlighted colors.
And, in the positive zone, where the price is greater than the stoploss, the trade zones are certain.
Shown with more highlighted colors.
If the zones are correct but stop-loss is not suitable for opening positions:
In other words, if the stop-loss is above/under the highest-lowest levels in the positive zone or if the stop loss is located in the lower zone in the negative zone, these zones are shown to be darker and dimmed so that they do not cause false movements.
*** SUMMARY : As a result, you can use this script with support and resistances,and trend lines to get good results.
I hope it helps in your analyzes. Best regards.

ATR Trailing Stop Loss IndicatorI rely on this script for both my live trading and my backtesting process. I couldn’t live without it. It’s extremely simple – all it does is calculate your trailing stop price.
How It Works
The first number in blue is the current ATR (pips). The second number in green is your trailing stop loss price for Long trades, and the third number in red is your trailing stop loss price for Short trades.
For short trades, the stop loss price is calculated by adding the current ATR value to the highest-high of the given lookback period.
For long trades, the stop loss price is calculated by subtracting the current ATR value from the lowest-low of the given lookback period.
Settings
ATR Length:
ATR period (how many candles to include in the calculation).
Use Structure?
If set to true, the script will use swing lows and highs in its calculation. If set to false, the script will ignore swing lows and highs and give you the distance of the ATR from the current candle close instead.
How Far To Look Back For High/Lows:
Candle lookback period for swing high/lows.
ATR X ?:
This controls your ATR multiplier. For example, if you want to use a 2x ATR stop, set this to 2.
Chart Companion:
Here is the chart companion script for this indicator:
Source Code:
Go to zenandtheartoftrading.com for the source code – it’s free!
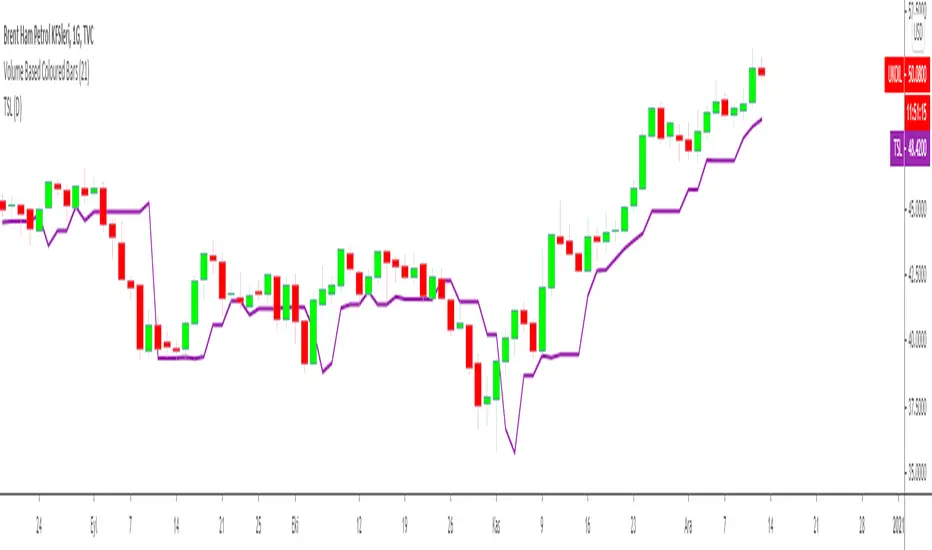
Trailing Stop Loss MTFMultiple Time Frame Version of Trailing Stop Loss Indicator
TRAILING STOP LOSS INDICATOR is a helpful tool for traders to help one of the greatest problems that they face: where to sell?
by using trailing stop loss you can easily decide and see possible downward movements and understand if you are in a safe zone.
Using Trailing Stop Loss is just simple:
Go short/ Sell when price crosses down the indicator,
Stay on long position if prices are above the indicator.
The indicator is calculated from previous Lows and doesn't the value won't change until prices makes higher lows.
TURKISH EXPLANATION:
İz Süren Stop Loss İndikatörü
Adım 1- bu günün düşük fiyatından geriye doğru, daha düşük fiyatlı bir günle karşılaşıncaya kadar yatay bir çizgi çizin
bu sizin birinci countback’ iniz olacak.
Adım 2- bu yeni düşük günün düşük fiyatından geriye doğru tekrar bir başka düşük güne gelene kadar yatay bir çizgi
çekin. Bu sizin ikinci countback’ iniz olacak.
Adım 3- bu ikinci düşük günün düşüğünden ileri bu günkü tarihe kadar yatay bir çizgi çekin bu sizin talimat
verdiğinizde stop-loss noktanız oluyor.
Kural 1- asla aşağıya doğru stop koymayın. Eğer yeni stop-loss noktanız öncekinden daha düşükse onu atıyorsunuz.
Bu kural asla bozulmamalı.
Kural 2- countback çizginiz üzerindeki aynı düşük fiyata denk gelen günleri yok sayın. İkinci contback çizginizi çekmek
için ilkinden daha düşük bir nokta bulmalısınız. Eğer aynı düşük fiyata sahip bir çubuğa denk gelirseniz daha düşüğünü
buluncaya kadar devam edin. Gerçekten hepsi bu kadar. Bu kuralları uygulayarak stop-loss noktamızı her yeni günün
datası eklendikçe uzatabiliriz.
drive.google.com

Trailing Stop Loss Indicator by KıvanÇ fr3762TRAILING STOP LOSS INDICATOR is a helpful tool for traders to help one of the greatest problems that they face: where to sell?
by using trailing stop loss you can easily decide and see possible downward movements and understand if you are in a safe zone.
Using Trailing Stop Loss is just simple:
Go short/ Sell when price crosses down the indicator,
Stay on long position if prices are above the indicator.
The indicator is calculated from previous Lows and doesn't the value won't change until prices makes higher lows.
TURKISH EXPLANATION:
İz Süren Stop Loss İndikatörü
Adım 1- bu günün düşük fiyatından geriye doğru, daha düşük fiyatlı bir günle karşılaşıncaya kadar yatay bir çizgi çizin
bu sizin birinci countback’ iniz olacak.
Adım 2- bu yeni düşük günün düşük fiyatından geriye doğru tekrar bir başka düşük güne gelene kadar yatay bir çizgi
çekin. Bu sizin ikinci countback’ iniz olacak.
Adım 3- bu ikinci düşük günün düşüğünden ileri bu günkü tarihe kadar yatay bir çizgi çekin bu sizin talimat
verdiğinizde stop-loss noktanız oluyor.
Kural 1- asla aşağıya doğru stop koymayın. Eğer yeni stop-loss noktanız öncekinden daha düşükse onu atıyorsunuz.
Bu kural asla bozulmamalı.
Kural 2- countback çizginiz üzerindeki aynı düşük fiyata denk gelen günleri yok sayın. İkinci contback çizginizi çekmek
için ilkinden daha düşük bir nokta bulmalısınız. Eğer aynı düşük fiyata sahip bir çubuğa denk gelirseniz daha düşüğünü
buluncaya kadar devam edin. Gerçekten hepsi bu kadar. Bu kuralları uygulayarak stop-loss noktamızı her yeni günün
datası eklendikçe uzatabiliriz.
drive.google.com
Trend Score with Dynamic Stop Loss HTF
How the Trend Score System Works
This indicator uses a Trend Score (TS) to measure price momentum over time. It tracks whether price is breaking higher or lower, then sums these moves into a cumulative score to define trend direction.
⸻
1. Trend Score (+1 / -1 Mechanism)
On each new bar:
• +1 point: if the current bar breaks the previous bar’s high.
• −1 point: if the current bar breaks the previous bar’s low.
• If both happen in the same bar, they cancel each other out.
• If neither happens, the score does not change.
This creates a simple running measure of bullish vs bearish pressure.
⸻
2. Cumulative Trend Score
The Trend Score is cumulative, meaning each new +1 or -1 is added to the total score, building a continuous count.
• Rising scores = buyers are consistently pushing price to higher highs.
• Falling scores = sellers are consistently pushing price to lower lows.
This smooths out noise and helps identify persistent momentum rather than single-bar spikes.
⸻
3. Trend Flip Trigger (default = 3)
A trend flip occurs when the cumulative Trend Score changes by 3 points (default setting) in the opposite direction of the current trend.
• Bullish Flip:
• Cumulative TS rises 3 points from its most recent low pivot.
• Marks a potential start of a new uptrend.
• A bullish stop-loss (SL) is set at the most recent swing low.
• Bearish Flip:
• Cumulative TS falls 3 points from its most recent high pivot.
• Marks a potential start of a new downtrend.
• A bearish SL is set at the most recent swing high.
Example:
• TS is at -2, then climbs to +1.
• That’s a +3 change, triggering a bullish flip.
⸻
4. Visual Summary
• Green background: Active bullish trend.
• Red background: Active bearish trend.
• ▲ Triangle Up: A bullish flip occurred this bar.
• Stop Loss Line: Shows the structural low used for risk management.
⸻
Why This Matters
The Trend Score measures trend pressure simply and objectively:
• +1 / -1 mechanics track real price behavior (breakouts of highs and lows).
• Cumulative changes of 3 points act like a momentum filter, ignoring small reversals.
• This helps you see true regime shifts on higher timeframes, which is especially useful for swing trades and investing decisions.
⸻
Key Takeaways
• Only flips after meaningful swings: prevents overreacting to single-bar noise.
• SL shows invalidation point: helps you know where a trend thesis fails.
• Works best on Daily or Weekly charts: for smoother, more reliable signals. Using Trend Score for Long-Term Investing
This indicator is designed to support decision-making for higher timeframe investing, such as swing trades, multi-month positions, or even multi-year holds.
It helps you:
• Identify major bullish regimes.
• Decide when to add to winning positions (DCA up).
• Know when to pause buying or consider trimming during weak periods.
• Stay disciplined while holding long-term winners.
Important Note:
These are suggestions for context. Always combine them with your own analysis, portfolio allocation rules, and risk tolerance.
⸻
1. Start With the Higher Timeframe
• Use Weekly charts for a broad investing view.
• Use Daily charts only for fine-tuning entry points or deciding when to add.
• A Bullish Flip on Weekly suggests the market may be entering a major uptrend.
• If Weekly is bullish and Daily also turns bullish, it’s extra confirmation of strength.
⸻
2. Building a Position with DCA
Goal: Grow your position gradually during strong bullish regimes while staying aware of risk.
A. Initial Buy
• Start with a small initial allocation when a Bullish Flip appears on Weekly or Daily.
• This is just a starter position to get exposure while the new trend develops.
B. Adding Through Strength (DCA Up)
• Consider adding during pullbacks, as long as price stays above the active SL line.
• Each add should be smaller or equal to your first buy.
• Spread out adds over time or price levels, instead of going all-in at once.
C. Pause Buying When:
• Price approaches or touches the SL level (trend invalidation).
• A Bearish Flip appears on Weekly or Daily — this signals potential weakness.
• Your total position size reaches your maximum allocation limit for that asset.
⸻
3. Holding Winners
When a position grows in profit:
• Stay in the trend as long as the Weekly regime remains bullish.
• The indicator’s green background acts as a reminder to hold, not panic sell.
• Use the SL bubble to monitor where the trend could potentially break.
• Avoid selling just because of small pullbacks — focus on big-picture trend health.
⸻
4. Taking Partial Profits
While this tool is designed to help hold long-term winners, there may be times to lighten risk:
• After large, rapid moves far above the SL, consider trimming a small portion of your position.
• When MFE (Maximum Favorable Excursion) in the table reaches unusually high levels, it may signal overextension.
• If the Weekly chart turns Neutral or Bearish, you can gradually reduce exposure while waiting for the next Bullish Flip.
⸻
5. Using the Stop Loss Line for Awareness
The Dynamic SL line represents a structural level that, if broken, may suggest the bullish trend is weakening.
How to think about it:
• Above SL: Market remains structurally healthy — continue holding or adding gradually.
• Close to SL: Pause adds. Be cautious and consider tightening your risk.
• Below SL: Treat this as a potential signal to reassess your position, especially if the break is confirmed on Weekly.
The SL is not a hard stop — it’s a visual guide to help you manage expectations.
⸻
6. Example Use Case
Imagine you are investing in a growth stock:
• Weekly Bullish Flip: You open a small starter position.
• Price pulls back slightly but stays above SL: You add a second, smaller tranche.
• Trend continues up for months: You hold and stop adding once your desired allocation is reached.
• Price doubles: You trim 10–20% to lock some profits, but continue holding the majority.
• Price later dips below SL: You slow down, reassess, and decide whether to reduce exposure.
This keeps you:
• Participating in major uptrends.
• Avoiding overcommitment during weak phases.
• Making adjustments gradually, not emotionally.
⸻
7. Suggested Workflow
1. Check Weekly chart → is it Bullish?
2. If yes, review Daily chart to fine-tune entry or adds.
3. Build exposure gradually while Weekly remains bullish.
4. Watch SL bubbles as awareness points for risk management.
5. Use partial trims during big rallies, but avoid exiting entirely too soon.
6. Reassess if Weekly turns Neutral or Bearish.
⸻
Key Takeaways
• Use this as a compass, not a command system.
• Weekly flips = big picture direction.
• Daily flips = timing and precision.
• Add gradually (DCA) while above SL, pause near SL, reassess below SL.
• Hold winners as long as Weekly remains bullish.

Candlestick Pattern Strategy with Smart Stop-Loss Management🔹 Strategy Overview
This strategy combines candlestick patterns with trend filtering and EMA channel confirmation to identify high-probability trading opportunities. It features a smart stop-loss management system that moves to breakeven once the trade reaches a predefined profit threshold.
📊 Key Features
✅ Multiple Candlestick Patterns – Detects classic reversal patterns like:
Hammer & Hanging Man
Bullish & Bearish Engulfing
Piercing Line & Dark Cloud Cover
Morning & Evening Star
Doji Star (Neutral Signal)
✅ Trend & EMA Channel Filters
Trend EMA (100-period) – Ensures trades align with the broader trend.
EMA Channel (50-period ± % range) – Filters trades within a defined volatility range.
✅ Flexible Trade Management
Fixed Target Points – Take profit at a predefined distance.
Trailing Stop to Cost – Moves stop-loss to breakeven after reaching a specified profit threshold.
✅ Customizable Trade Direction
Long Only / Short Only / Both – Adapt to bullish, bearish, or neutral markets.
✅ Time-Based Execution
Intraday Mode – Trades only within specified session hours.
Positional Mode – Holds trades beyond the session.
⚙️ Input Parameters
Trend Filter – Enable/disable trend alignment with EMA.
EMA Channel Filter – Adjust channel width for volatility control.
Candlestick Patterns – Toggle individual patterns on/off.
Target Points & Trail Trigger – Customize profit-taking and SL management.
Trade Type – Switch between intraday and positional trading.
📈 Entry Conditions
Long Entry:
Bullish candlestick pattern (Hammer, Bullish Engulfing, Piercing Line, Morning Star).
Price above Trend EMA (if enabled).
RSI < 30 (oversold confirmation).
Within EMA Channel (if enabled).
Short Entry:
Bearish candlestick pattern (Hanging Man, Bearish Engulfing, Dark Cloud Cover, Evening Star).
Price below Trend EMA (if enabled).
RSI > 70 (overbought confirmation).
Within EMA Channel (if enabled).
📉 Exit Conditions
Take Profit (TP): Fixed target based on points.
Stop-Loss (SL): Moves to breakeven after hitting the trail trigger.
📊 Visual Indicators
Trend EMA (Orange Line) – Main trend direction.
EMA Channel (Blue Lines) – Volatility range.
Buy/Sell Labels – Entry signals below/above bars.
Doji Star (Gray Cross) – Neutral signal.
🎯 Best Suited For
Swing Traders (Positional Mode)
Intraday Traders (Scalping with tight stops)
Price Action Enthusiasts (Candlestick-based entries)
🔗 Try it out and customize it to fit your trading style! 🚀

ATR Stop Loss Non-Decreasing & LineThe script calculates a custom stop-loss level based on the Average True Range (ATR) indicator, ensuring that this stop-loss level never decreases from one bar to the next unless a reset condition is met. It also visually displays the ATR value and the calculated stop-loss level as a line on the chart.

ORB With Buffer, Target & Stop LossThe "ORB With Buffer" is a comprehensive technical analysis tool designed to identify, plot, and visualize key levels associated with price breakouts. It offers a dynamic representation of breakout zones, buffer areas, target levels, and stop-loss levels on both sides of the market.
Key Features:
ORB Levels (Opening Range Breakout):
The indicator identifies and plots the Opening Range Breakout levels, marking the high and low points of the initial trading period. In our case the ORB range is locked to 15 Minutes irrespective of the chart's timeframe.
Buffer Areas for Breakout:
Buffer zones are displayed around the ORB levels, representing a range where traders cant wait to join the direction to counter fake ORB breakouts
Targets:
The indicator calculates and visualizes target levels. Approximately 1% of instrument's price from entry point
Stop Loss Levels:
Stop-loss levels are indicated on both sides of the market, offering traders a clear reference point to manage risk.

Take profit and Stop Loss ATR HL [Tcs] | ALGOThis indicator helps traders set stop loss and take profit levels based on either ATR or High-Low range.
The indicator calculates stop loss and take profit levels for both long and short positions, based on the user's input of ATR length, ATR smoothing method, and multiplier levels for each level. It’s possible to set 3 levels of take profit, for both long and short trades.
The indicator also includes the option to show or hide levels, bands, and labels for the calculated stop loss and take profit levels.
Additionally, the indicator has a function to calculate the user's risk based on their account balance, risk percentage, and broker fees.
Overall, this indicator can be helpful for traders who use stop loss and take profit levels in their trading strategies and want a visual representation of those levels on their charts.
Please note that this indicator is for educational purposes only and should not be used for trading without further testing and analysis.

[TTI] ATR Trailing Stop Alerts––––HISTORY & CREDITS 🏦
The Trailing Stop Alert is a TradingView indicator developed by TintinTrading, which is designed to help traders manage their positions by updating and alerting them about their trailing stop levels. This tool is a valuable addition to a trader's arsenal, as it automates the process of maintaining trailing stop levels and alerts the user when they are updated or hit.
––––WHAT IT DOES 💡
The Trailing Stop Alert indicator calculates trailing stop levels based on the Average True Range (ATR) of an asset over a specified lookback period. It takes user inputs for trail type (Long or Short), lookback period, ATR length, ATR multiplier, and bar time. The indicator can be applied to any financial instrument and will dynamically update the trailing stop level based on price action. When the trailing stop level is updated or hit, the indicator generates alerts to inform the user of these events.
––––HOW TO USE IT 🔧
1. Add the Trailing Stop Alert indicator to your TradingView chart.
2. Configure the settings according to your preferred parameters:
👉Trail Type: Choose between "Long" or "Short" based on your trading position.
👉Lookback: Set the number of bars to look back for determining the highest high or lowest low.
👉ATR Length: Set the period for calculating the Average True Range.
👉ATR Multiplier: Set the multiplier to adjust the trailing stop distance.
👉Bar Time: Set the time at which the indicator starts updating the trailing stop levels.
3. The indicator will plot the trailing stop level on the chart, and update it as the price action unfolds.
4. When the trailing stop level is updated or hit, you will receive an alert in the form of a message with the new level or a notification that the stop has been hit.
5. Adjust your stop loss orders accordingly based on the trailing stop levels provided by the indicator.
By using the Trailing Stop Alert indicator, you can effectively manage your positions and reduce the risk of giving back profits in a trade.

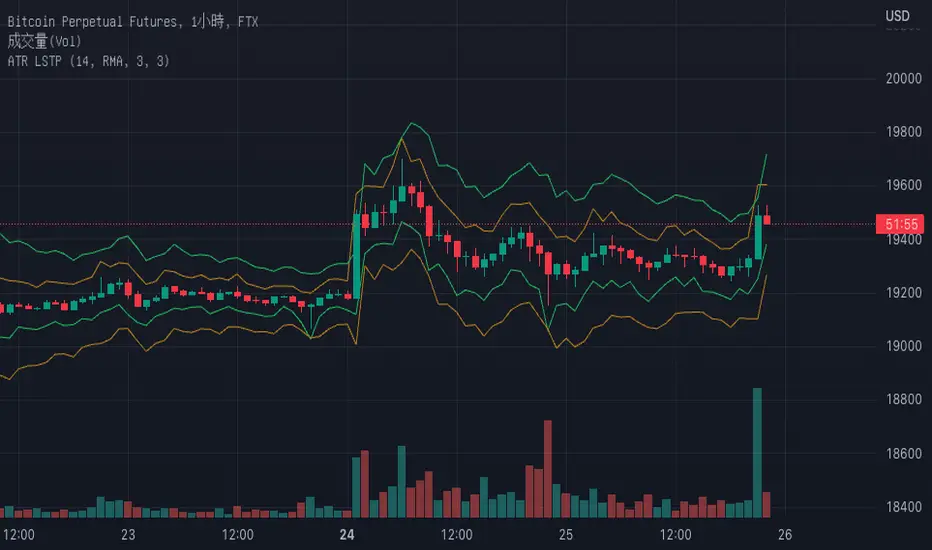
Average True Range with stop loss and take profit finderBased on the official original average true volatility (ATR), two functions have been extended.
Users can see the suggested stop loss and take profit parameters when entering a long or short order with each K-line.
Part of the settings:
Length: The preset is 14 K lines, which can help you grab the suggested stop loss point.
Long-short single profit-loss ratio: After entering the value of the profit-loss ratio (floating point) you want, it will automatically convert and calculate the past take-profit point.
The five values displayed on the chart are from left to right: ATR, Short Stop Loss, Long Stop Loss, Short Take Profit, and Long Take Profit.
PluePhantom's Trailing Stop Loss Multiple of ATRThis is a simple trailing stop loss line for long and short positions, made by Bluephantom using PS v2. I converted it onto v5
It is calculated as a multiple of the ATR instead of a percentage.
You are able to change the multiple and the ATR length.
It can be used as a guide to where you should consider putting in your stop loss on a trade and to where you should move your stop loss to as the days go by.
This indicator is experimental. Use at your own risk.

Rob Hoffman's 50/80/90/Price Trailing Stop LossA trailing stop loss method by Rob Hoffman.
Set your entry, TP, and SL.
Once price is 50% of its way to the TP, set your stop loss at the gray line.
Once price is 80% of its way to the TP, set your stop loss at the light gray line.
Once price is 90% of its way to the TP set your stop loss at the white line.

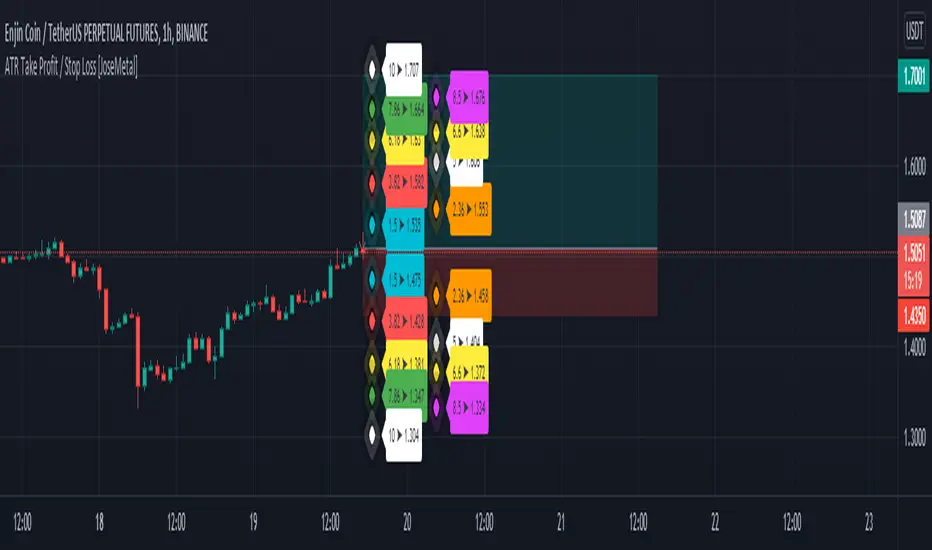
ATR Take Profit / Stop Loss [JoseMetal]============
ENGLISH
============
- Description:
This indicator is based on ATR to print current ATR multiple values for Take Profits or Stop Loss levels, it's real time, so you can use the replay feature to test it or calculate these levels anytime on any candle.
Therefore, levels are calculated by multiplying the ATR by the level multiplier.
- Visual:
Both a "diamond" and label with the ATR multiplier and price value are printed for each level.
Each level has a color for both, diamond and label to make it easier to read.
The levels are split in 2 columns for better visualization.
- Usage and recommendations:
Fibonacci's levels are used for default, but you can customize them as you like.
I usually take 3.82 level (red by default) as stop loss, and I take profit every 2 levels depending on the timeframe, is good to let a small part run until break even or ATR 10 (last level).
- Customization:
Custom ATR period, 10 is default.
Each level has custom multiplier and level.
Customizable offset for diamonds and labels.
Custom precision for prices (because it greatly depends on the asset you're working with).
============
ESPAÑOL
============
- Descripción:
Este indicador se basa en el ATR para mostrar múltiples niveles de Take Profits o Stop Loss, es en tiempo real, por lo que se puede utilizar la función de repetición para probarlo o calcular estos niveles en cualquier momento y en cualquier vela.
Por lo tanto, los niveles se calculan multiplicando el ATR por el multiplicador del nivel.
- Visual:
Tanto un "diamante" como una etiqueta con el multiplicador ATR y el valor del precio se imprimen para cada nivel.
Cada nivel tiene un color tanto para el diamante como para la etiqueta para facilitar su lectura.
Los niveles están divididos en 2 columnas para una mejor visualización.
- Uso y recomendaciones:
Se usan los niveles de Fibonacci defecto, pero puedes personalizarlos como quieras.
Yo suelo usar el nivel 3.82 (rojo por defecto) como stop loss, y tomo beneficios cada 2 niveles dependiendo de la temporalidad, es bueno dejar correr una pequeña parte hasta el break even o ATR 10 (último nivel).
- Personalización:
Periodo ATR personalizable, 10 es el predeterminado.
Cada nivel tiene multiplicador y nivel personalizables.
Desplazamiento (offset) personalizable para los diamantes y las etiquetas.
Precisión para decimales personalizada (porque depende mucho del activo con el que se trabaje).
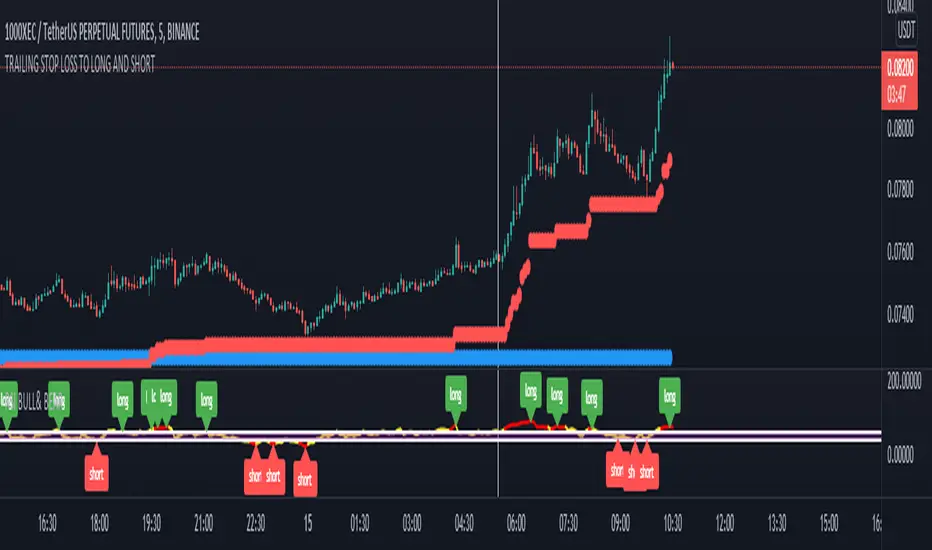
TRAILING STOP LOSS TO LONG AND SHORT LONG AND SHORT ( with stop loss) LONG AND SHORT ( with stop loss) LONG AND SHORT ( with stop loss)