Multi Timeframe Relative Strength Index {DCAquant}Overview
The Multi Timeframe Relative Strength Index (MTF RSI) is a powerful technical analysis tool designed to provide insights into market momentum and potential trend reversals across multiple timeframes. Leveraging the Relative Strength Index (RSI) formula, this indicator offers traders a comprehensive view of market sentiment and identifies overbought and oversold conditions.
Key Features
RSI Calculation:
Utilizes the standard RSI calculation formula to measure the magnitude of recent price changes and assess the strength of market trends.
Employs a user-defined length parameter to customize the sensitivity of the RSI calculation based on trading preferences.
Multiple Timeframe Analysis:
Allows traders to analyze RSI values across up to six different timeframes, ranging from minutes to days, providing a holistic perspective on market dynamics.
Calculates RSI values independently for each selected timeframe, enabling comparison and trend identification.
Threshold Levels:
Defines overbought and oversold levels to highlight potential reversal points in market trends.
Offers flexibility in adjusting threshold levels based on individual risk tolerance and trading strategies.
Neutral Zone:
Establishes upper and lower neutral thresholds to identify periods of consolidation or sideways movement in price.
Helps traders distinguish between trending and ranging market conditions for more accurate analysis.
Moving Average Smoothing:
Provides the option to apply moving average smoothing to aggregated RSI values for enhanced clarity and reduced noise.
Enables smoother visualization of RSI trends, facilitating easier interpretation for traders.
Visual Representation:
Plots the aggregated MTF RSI values on the price chart, allowing traders to visually assess market momentum and potential reversal points.
Utilizes color-coded backgrounds to indicate Long, Short, or Neutral conditions for quick identification.
Dynamic Table Display:
Displays trading signals alongside graphical indicators (rocket for Long, snowflake for Short, and star for Neutral) in a customizable table format.
Offers flexibility in table placement and size to accommodate user preferences.
How to Use:
Parameter Configuration:
Adjust the length parameter to fine-tune the sensitivity of the RSI calculation based on the desired timeframe and trading strategy.
Define overbought and oversold levels to identify potential reversal points in market trends.
Customize upper and lower neutral thresholds to differentiate between trending and ranging market conditions.
Interpretation:
Monitor the aggregated MTF RSI values plotted on the price chart for signals of overbought or oversold conditions.
Pay attention to color-coded backgrounds and graphical indicators in the table for actionable trading insights.
Trading Strategy:
Consider entering Long positions when the aggregated MTF RSI is above the upper neutral threshold, indicating potential bullish momentum.
Evaluate Short opportunities when the aggregated MTF RSI falls below the lower neutral threshold, signaling possible bearish momentum.
Exercise caution during Neutral conditions, as there may be uncertainty in market direction.
Risk Management:
Combine MTF RSI analysis with robust risk management strategies, including stop-loss and take-profit levels, to manage trading risks effectively.
Practice prudent risk management and trade within your risk tolerance to minimize potential losses.
Disclaimer
Trading in financial markets involves risk, and past performance is not indicative of future results. The use of the MTF RSI indicator does not guarantee profits or prevent losses. Traders should conduct their own analysis, exercise caution, and seek advice from qualified financial professionals before making trading decisions.
在腳本中搜尋"take profit"

B A N K $ - Advanced Session RangesThis is a simple indicator that has been designed to aid intraday trading and has a few components;
Key Features
Session Ranges + Optimal Exit Time
Asia Pip Range
New York Midnight Open Line
Session Ranges + Optimal Exit Time
Information ℹ️
This is a visual depiction of the 3 main sessions in the markets. Asia, London & New York. The default timings are set to perfectly align with each session however the Start & End times for each session can be changed in the settings. (I've added a website on the tooltip to easily convert timezones)
I have also added a 4th session range called "Optimal Exit Time". This is statistically the most probable time window for the opposite High / Low of Day to form is within this window. It helps the trader understand when they should look to take profit.
How It Works 🔑
The indicator automatically maps on two lines for the High & Low of the range between the selected Start & End time, it also colours the background.
The individual lines & background can be toggled & customised to the traders preference.
Asia Pip Range
Information ℹ️
This displays the Asia Range in pips beneath the Asia Session Low.
How It Works 🔑
This calculates the distance between the Asia High - Asia Low in pips. It will automatically recalibrate to the timings the trader sets in the settings if they change the Start / End.
New York Midnight Open Line
Information ℹ️
This helps look for Buys beneath the line for a Bullish Expansion day 📈 & Sells above the line for a Bearish Expansion day 📉
How It Works 🔑
This adds a horizontal line to the chart that is anchored to New York Midnight Open (00:00) by default. It can be changed in the settings in required. You can also toggle on the time being shown above the line.

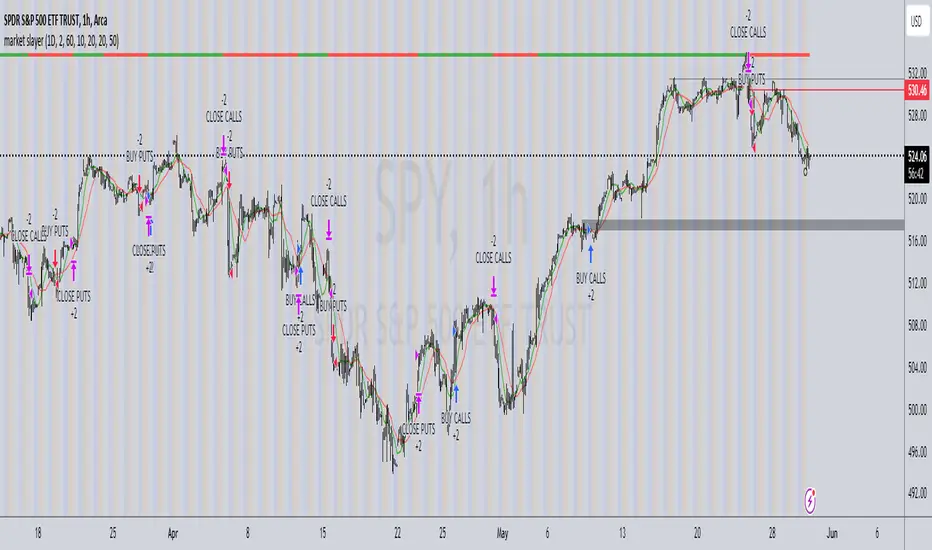
market slayerInput Parameters:
Various input parameters allow customization of the strategy, including options to show trend confirmation, specify trend timeframes and values, set SMA lengths, enable take profit and stop loss, and define their respective values.
Calculations:
Simple Moving Averages (SMAs) are calculated based on the specified lengths.
Buy and sell signals are generated based on the crossover and crossunder of the short and long SMAs.
Confirmation Bars:
Functions are defined to determine bullish or bearish confirmation bars based on certain conditions.
These confirmation bars are used to confirm trend direction and generate additional signals.
Plotting:
SMAs are plotted on the chart.
Trend labels and signal markers are plotted based on the calculated conditions.
Trade Signals:
Buy and sell conditions are defined based on the crossover/crossunder of SMAs and confirmation of trend direction.
Strategy entries and exits are executed accordingly.
Take Profit and Stop Loss:
Optional take profit and stop loss functionality is included.
Trades are automatically closed when profit or loss thresholds are reached.
Closing Trades:
Trades are also closed based on changes in trend confirmation bars to ensure alignment with the overall market direction.
Alerts:
Alert conditions are defined for opening and closing trades, providing notifications when certain conditions are met.
Overall, this script aims to provide a systematic approach to trading by combining moving average crossovers with trend confirmation bars, along with options for risk management through take profit and stop loss orders. Users can customize various parameters to adapt the strategy to different market conditions and trading preferences.
The script uses the request.security() function with the lookahead parameter set to barmerge.lookahead_on to access data from a higher timeframe within the Pine Script on TradingView. Let's break down why it's used:
Higher Timeframe Analysis:
By default, Pine Script operates on the timeframe of the chart it's applied to. However, in trading strategies, it's common to incorporate signals or data from higher timeframes to confirm or validate signals generated on lower timeframes. This helps traders to align their trades with the broader market trend.
Trend Confirmation:
In this script, the confirmationTrendTimeframe parameter allows users to specify a higher timeframe for trend confirmation. The request.security() function fetches the data from this higher timeframe and applies the defined conditions to confirm the trend direction.
Lookahead Behavior:
The lookahead parameter set to barmerge.lookahead_on ensures that the script considers the most up-to-date information available on the higher timeframe when making trading decisions on the lower timeframe. This prevents the script from lagging behind or using outdated data, enhancing the accuracy of trend confirmation.
Usage in confirmationTrendBullish and confirmationTrendBearish:
These variables are assigned the values returned by the request.security() function, which represents the bullish or bearish trend confirmation based on the conditions applied to the data from the higher timeframe.
Tetuan SniperThe TEMA and EMA Crossover Alert with SL, TP, and Order Signal strategy combines the power of Triple Exponential Moving Average (TEMA) and Exponential Moving Average (EMA) to generate high-quality trading signals. This strategy is designed to provide clear entry and exit points, manage risk through dynamic Stop Loss (SL) and Take Profit (TP) levels, and optimize trade sizes based on account balance and risk tolerance.
Key Features:
EMA and TEMA Crossover:
The strategy identifies potential buy and sell signals based on the crossover of EMA and TEMA. A buy signal is generated when TEMA crosses above EMA, and a sell signal is generated when TEMA crosses below EMA.
Dynamic Stop Loss (SL) and Take Profit (TP):
Stop Loss levels are dynamically set based on a user-defined number of pips below (for buy orders) or above (for sell orders) the lowest or highest point since the crossover.
Take Profit levels are dynamically adjusted using another TEMA, providing a flexible exit strategy that adapts to market conditions.
Lot Size Calculation:
The strategy calculates the optimal lot size based on the account balance, risk percentage per trade, and the number of maximum open orders. For JPY pairs, the lot size is adjusted by dividing by 100 to account for the different pip value.
The lot size is rounded to two decimal places for better readability and precision.
Visual Alerts and Labels:
Clear visual alerts and labels are provided for each buy and sell signal, including the recommended SL, TP, and lot size. The labels are placed in a way to avoid overlapping important chart elements.
Trend Visualization:
The area between the TEMA and EMA is colored to indicate the trend, with green for bullish trends and red for bearish trends, making it easy to visualize the market direction.
Inputs:
SL Points: Number of pips for the Stop Loss.
EMA Period: Period for the Exponential Moving Average.
TEMA Period: Period for the Triple Exponential Moving Average.
Account Balance: The total account balance for calculating the lot size.
Risk Percentage: The percentage of the account balance to risk per trade.
Take Profit TEMA Period: Period for the TEMA used to set Take Profit levels.
Lot per Pip Value: The value of 1 pip per lot.
Maximum Open Orders: The maximum number of open orders to split the balance among.
Example Usage
This strategy is suitable for traders who want to automate their trading signals and manage risk effectively. By combining TEMA and EMA crossovers with dynamic SL and TP levels and precise lot size calculation, traders can achieve a disciplined and methodical approach to trading.

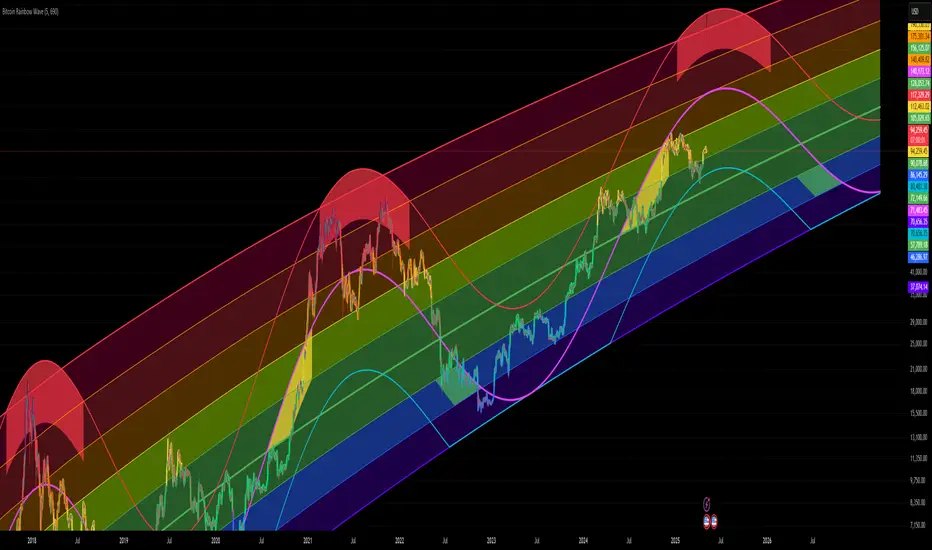
Bitcoin Rainbow WaveBitcoin ultimate price model:
1. Power Law + 2. Rainbow Narrowing Bands + 3. Halving Cycle Harmonic Wave + 3. Wave bands
This powerful tool is designed to help traders of all levels understand and navigate the Bitcoin market. It works exclusively with BTC on any timeframe, but looks best on weekly or daily charts. The indicator provides valuable insights into historical price behavior and offers forecasts for the next decade, making it essential for both mid-term and long-term strategies.
How the Model Works
Power Law (Logarithmic Trend) : The green line represents the expected long-term price trajectory of Bitcoin based on a logarithmic regression model (power law). This suggests that Bitcoin's price generally increases as a power of 5.44 over time passed.
Rainbow Chart : Colored bands around the power law trend line illustrate a range of potential price fluctuations. The bands narrow esponentially over time, indicating increasing model accuracy as Bitcoin matures. This chart visually identifies overbought and oversold zones, as well as fair value zones.
Blue Zone : Below the power law trend, indicating an undervalued condition and a potential buying zone.
Green Zone : Around the power law trend, suggesting fair value.
Yellow Zone : Above the power law trend, but within the rainbow bands. Exercise caution, as the price may be overextended.
Red Zone : Far above the power law trend, indicating strong overbought conditions. Consider taking profits or reducing exposure.
Halving Cycle Wave : The fuchsia line represents the cyclical wave component of the model, tied to Bitcoin's halving events (approximately every four years). This wave accounts for the price fluctuations that typically occur around halvings, with price tending to increase leading up to a halving and correct afterwards. The amplitude of the wave decreases over time as the impact of halvings potentially lessens. Additional bands around the wave show the expected range of price fluctuations, aiding traders in making informed decisions.
Customizing Parameters
You can fine-tune the model's appearance by adjusting these input parameters:
show Power Law (true/false): Toggle visibility of the power law trend line.
show Wave (true/false): Toggle visibility of the halving cycle wave.
show Rainbow Chart (true/false): Toggle visibility of the rainbow bands.
show Block Marks (true/false): Toggle visibility of the 70,000 block interval markers.
Using the Model in Your Trading Strategy
Combine this indicator with technical analysis, fundamental analysis, and risk management techniques to develop a comprehensive Bitcoin trading strategy. The model can help you identify potential entry and exit points, assess market sentiment, and manage risk based on Bitcoin's position relative to the power law trend, halving cycle wave, and rainbow chart zones.
Donchian Trend Ranges [AlgoAlpha]🚀🔗 Donchian Trend Ranges 🔗🚀
Elevate your trading game with the Donchian Trend Ranges indicator from AlgoAlpha! 🌟📈 This advanced tool helps you visualize market trends and potential reversal points using Donchian channels, volatility measures, and average true range (ATR).
Key Features
⚙️ Customizable Parameters: Adjust the lookback period and range multiplier to fit your trading style.
🎨 Color-Coded Trends: Easily distinguish between uptrends and downtrends with customizable colors.
📊 Dynamic Channels: Visualize multiple dynamic channels based on Donchian ranges and volatility.
☁️ Trend Clouds: See market strength and weakness with upper and lower trend clouds.
🔔 Signal Alerts: Get notified of potential trend shifts and take profit points.
How to Use
🛠 Add the Indicator: Add the indicator to favorites. Customize settings such as the lookback period and range multiplier to match your trading needs.
🔍 Analyze Trends: The indicator calculates the highest and lowest prices over a specified period to create dynamic channels. It then uses standard deviation and ATR to adjust these channels for market volatility, plotting upper and lower ranges. Green bars indicate an up trend and red bars for a down trend.
🔔 Set Alerts: Enable notifications for bullish and bearish trend shifts, as well as weak and strong take profit points, ensuring you never miss an opportunity.
How it Works
The Donchian Trend Ranges indicator calculates the highest and lowest prices over a specified period to create a basis line. It creates a range around the basis based on standard deviations and the clouds' width is determined by a 14 period ATR. The basis line and bar colors changes based on whether the closing price is above or below it, indicating trends. Clouds around these lines represent market reversal zones that can be used as entry levels when used in confluence with momentum indicators, visual signals ("X" and "◆") marking strong and weak take profit points are also printed when the prices revert from the clouds towards the basis. Integrated alerts notify you of significant events like trend shifts and take profit signals, keeping you informed without constant monitoring.
Unleash the power of the Donchian Trend Ranges in your trading strategy! 🌐📈✨

Trend Following Parabolic Buy Sell Strategy [TradeDots]The Trend Following Parabolic Buy-Sell Strategy leverages the Parabolic SAR in combination with moving average crossovers to deliver buy and sell signals within a trend-following framework.
This strategy synthesizes proven methodologies sourced from various trading tutorials available on platforms such as YouTube and blogs, enabling traders to conduct robust backtesting on their selected trading pairs to assess the strategy's effectiveness.
HOW IT WORKS
This strategy employs four key indicators to orchestrate its trading signals:
1. Trend Alignment: It first assesses the relationship between the price and the predominant trendline to determine the directional stance—taking long positions only when the price trends above the moving average, signaling an upward market trajectory.
2. Momentum Confirmation: Subsequent to trend alignment, the strategy looks for moving average crossovers as a confirmation that the price is gaining momentum in the direction of the intended trades.
3. Signal Finalization: Finally, buy or sell signals are validated using the Parabolic SAR indicator. A long order is validated when the closing price is above the Parabolic SAR dots, and similarly, conditions are reversed for short orders.
4. Risk Management: The strategy institutes a fixed stop-loss at the moving average trendline and a take-profit level determinable by a prefixed risk-reward ratio calculated from the moving average trendline. These parameters are customizable by the users within the strategy settings.
APPLICATION
Designed for assets exhibiting pronounced directional momentum, this strategy aims to capitalize on clear trend movements conducive to achieving set take-profit targets.
As a lagging strategy that waits for multiple confirmatory signals, entry into trades might occasionally lag beyond optimal timing.
Furthermore, in periods of consolidation or sideways movement, the strategy may generate several false signals, suggesting the potential need for additional market condition filters to enhance signal accuracy during volatile phases.
DEFAULT SETUP
Commission: 0.01%
Initial Capital: $10,000
Equity per Trade: 70%
Users are advised to adjust and personalize this trading strategy to better match their individual trading preferences and style.
RISK DISCLAIMER
Trading entails substantial risk, and most day traders incur losses. All content, tools, scripts, articles, and education provided by TradeDots serve purely informational and educational purposes. Past performances are not definitive predictors of future results.

[MAD] Entrytool / Bybit-LinearThis indicator, "Entry Tool," was coded at request for Sandmann .
It is designed to provide traders with real-time feedback for strategizing entries, exits, and liquidation levels for trades initiated at that given moment.
The tool visualizes average entry prices, stop-loss levels, multiple take-profit targets, and potential liquidation prices, offering a comprehensive overview of possible trade outcomes. It aids traders in pre-planning their trades by visually simulating the impact of different trading decisions directly on the live chart. Each setting and parameter can be customized to align with individual trading strategies and risk tolerances, making this tool versatile for various trading styles, including day trading, swing trading, and position trading.
------------------------------
Steps to Use the Indicator:
1. Basic Setup:
Setup Type: Choose between "Long" or "Short" to set the direction of the trade.
Leverage: Adjust the leverage to understand its impact on your potential returns and liquidation price.
Tracking follows the close price, alternative you can enter a specific price.
2. Position Setup:
Initial Entry Amount: Set the starting amount for the trade.
Distance: First Increment Percentage from Entry price
Amount: Define the increase for the first incremental addition to the position and specify the amount to be added.
Distance: Second Increment Percentage from Entry
Amount: Set the increase for the second incremental addition and the corresponding amount.
3. Risk Management:
Stop-Loss (SL) Percentage: Set the percentage below or above the average entry price at which the position should be closed to minimize losses.
Take-Profit (TP) Percentages: Define up to four different profit target levels by specifying the percentage above or below the average entry price.
4. Visual Settings:
Box Colors: Customize the colors of the boxes that represent long and short positions to differentiate easily on the chart.
Box Extension: Determine the length by which the box extends beyond the current bar, which helps in visualizing the potential price movement.
Line Colors and Extensions: Select colors for various lines such as the Average Entry Line, Stop-Loss Line, Take-Profit Lines, and Liquidations Line. Adjust the length of these lines for better visibility.
Label Settings: Configure the distance of labels from their corresponding lines and set the font size for better readability.
5. Additional Features:
Liquidation Price Visualization: This new feature calculates and displays the liquidation price based on the current leverage and margin settings, giving traders a critical insight into their risk exposure.
Interactive Drag Point: Adjust the start price manually by dragging the point on the chart, which dynamically updates entry and exit levels as well as risk metrics.
Detailed Leverage Data Array: Input different scenarios with specific leverage, initial margin, and maintenance rates to see how these factors impact potential liquidation points.
6. Informations about leverage calculation
The data used are fetched from Bybit for Linear pairs to calculate the liquidations like in their documentation.
Keep in mind that other exchanges may calulate based on another formular.

NZTInstitutionalLevelDESCRIPTION IN ENGLISH
🔶 INTRODUCTION
NZTInstitutionalLevel is an indicator for the TradingView platform designed to display institutional levels on a price chart. This script is based on the concept of calculating significant price levels that can be used for both long-term trading and intraday operations. The indicator calculates and visualizes the levels at which large market participants , such as institutional investors and large funds , can actively participate. The displayed levels are very important , as psychologically people tend to buy or sell at these levels, which makes them a reliable support in the analysis
🔶 CONTENT
The indicator uses the analysis of support and resistance levels , which are often tested by major market players . These levels represent prices that have historically experienced significant price movements due to large trading volumes, making them relevant for future trading decisions. You may notice that price often reverses or tests these round levels. These levels are a powerful pillar of price action analysis.
🔶 KEY FEATURES
The indicator displays institutional (bank) levels . Thanks to which you can easily determine the position of major players and the direction of their capital.
Visualization customization:
Users can customize the display of levels by selecting color, thickness and line style (solid, dotted, dashed).
Adaptability:
The script adapts the level step size depending on the current price of the asset and the selected time interval, which allows it to be used in various trading conditions and for assets with different volatility and price range.
Automatic scaling:
The number of displayed levels changes depending on the selected time interval, allowing traders to focus only on significant levels without overloading the chart with unnecessary information.
🔶 SETTINGS
🔹 Show Institutional Levels (Показывать институциональные уровни)
Allows you to disable or enable the display of institutional levels.
🔹 Level color (Цвет уровней)
Allows you to customize the color of the levels.
🔹 Level thickness (Толщина уровней)
Allows you to adjust the thickness of the levels.
🔹 Level style (Стиль уровней)
Allows you to customize the levels' style.
🔶 RECOMMENDATIONS FOR USE
To use the indicator, activate it on the desired price chart through the TradingView indicator menu. Once activated, adjust the visibility, color, style and thickness of the levels according to your preferences. The indicator will automatically calculate and display institutional levels based on the current asset price and configured parameters . These levels can serve as potential points for placing buy or sell orders, setting stop losses, or taking profits.
The indicator was developed by Temirlan Tolegenov for NZT Trader Community , May 2024, Prague, Czech Republic.
ОПИСАНИЕ НА РУССКОМ ЯЗЫКЕ
🔶 ВСТУПЛЕНИЕ
NZTInstitutionalLevel – это индикатор для платформы TradingView, предназначенный для отображения институциональных уровней на ценовом графике . Этот скрипт основан на концепции вычисления значимых ценовых уровней , которые могут быть использованы как для долгосрочной торговли, так и для интрадей-операций . Индикатор рассчитывает и визуализирует уровни , на которых могут активно участвовать крупные участники рынка , такие как институциональные инвесторы и большие фонды . Отображаемые уровни очень важны , так как психологически люди склонны покупать или продавать на этих уровнях , что делает их надежной опорой при анализе.
🔶 СОДЕРЖАНИЕ
Индикатор использует анализ уровней поддержки и сопротивления , которые часто тестируются крупными игроками рынка . Эти уровни представляют собой цены, на которых исторически происходили значительные движения цен за счет больших объемов торгов, что делает их релевантными для будущих торговых решений. Вы можете заметить, что цена часто разворачивается или тестирует эти круглые уровни. Эти уровни являются мощной основой анализа price action.
🔶 КЛЮЧЕВЫЕ ОСОБЕННОСТИ
Индикатор отображает институциональные (банковские/круглые) уровни. Благодаря чему вы легко сможете определить позиции крупных игроков и направление их капиталов.
Настройка визуализации:
Пользователи могут настроить отображение уровней, выбрав цвет, толщину и стиль линий (сплошные, пунктирные, точками).
Адаптивность:
Скрипт адаптирует размер шага уровня в зависимости от текущей цены актива и выбранного временного интервала, что позволяет использовать его в различных торговых условиях и для активов с разной волатильностью и ценовым диапазоном.
Автоматическое масштабирование:
Количество отображаемых уровней меняется в зависимости от выбранного временного интервала, позволяя трейдерам сосредоточиться только на значимых уровнях, не перегружая график лишней информацией.
🔶 НАСТРОЙКИ
🔹 Показывать институциональные уровни
Позволяет отключить или включить отображение институциональных уровней.
🔹 Цвет уровней
Позволяет настроить цвет уровней.
🔹 Толщина уровней
Позволяет регулировать толщину уровней.
🔹 Стиль уровней
Позволяет настроить стиль уровней.
🔶 РЕКОМЕНДАЦИИ К ИСПОЛЬЗОВАНИЮ
Для использования индикатора, активируйте его на желаемом ценовом графике через меню индикаторов TradingView. После активации, н астройте видимость, цвет, стиль и толщину уровней в соответствии с вашими предпочтениями. Индикатор автоматически рассчитает и отобразит институциональные уровни , основываясь на текущей цене актива и настроенных параметрах . Эти уровни могут служить потенциальными точками для размещения ордеров на покупку или продажу, установления стоп-лоссов или взятия прибыли.
Индикатор разработан Темирланом Толегеновым для международного сообщества NZT Trader , Май 2024, Прага, Чешская Республика.
The indicator is published in accordance and respect to all House Rules of the TradingView platform.
Индикатор опубликован в соответствии и уважением ко всем внутренним правилами платформы TradingView.

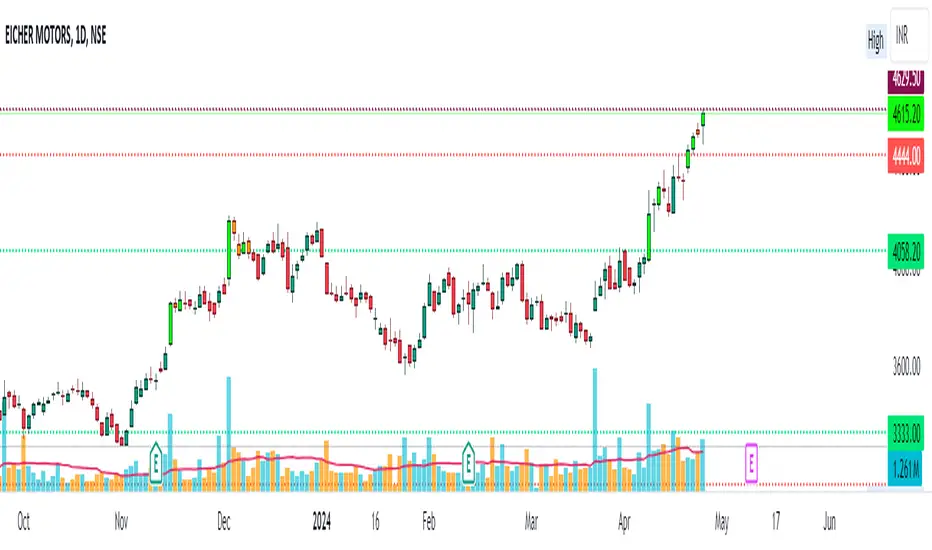
ATH/TTL & 52WH/L with Candle Coloring by RVImportance:
Identifying Key Price Levels: The indicator helps identify critical price levels such as all-time highs (ATH), all-time lows (ATL), 52-week highs (52WH), and 52-week lows (52WL). These levels often act as significant support or resistance areas.
Candle Color Insights: By coloring candles based on their relationship to these key levels, traders can quickly assess market sentiment and potential reversal points.
Visual Representation: The plotted lines and colored candles provide a visual representation of price dynamics, aiding in trend analysis and decision-making.
How to Use:
Key Level Confirmation: Confirm market trends or reversals by observing how price interacts with ATH, ATL, 52WH, and 52WL levels. Breakouts or bounces from these levels can signal strong buying or selling pressure.
Candle Color Signals: Pay attention to candle colors near key levels. For example, green candles above 52WH may indicate bullish momentum, while red candles below 52WL may suggest bearish pressure.
Confirmation with Other Indicators: Use this indicator in conjunction with other technical indicators or chart patterns to validate trading signals. For instance, combine it with moving averages or RSI to confirm potential entry or exit points.
Risk Management: Set stop-loss orders or take-profit levels based on the proximity of price to key levels. Tighten stops or consider profit-taking near significant levels to manage risk effectively.
Lines Plotted:
ATH Line: Represents the all-time high (ATH) levels.
ATL Line: Represents the all-time low (ATL) levels.
52WH Line: Represents the 52-week high (52WH) levels.
52WL Line: Represents the 52-week low (52WL) levels.
52WH 25% Low Line: Represents 25% below the 52-week high.
52WL 30% High Line: Represents 30% above the 52-week low.
Candle Coloring:
Candles are colored based on their relationship to ATH, ATL, 52WH, and 52WL levels.
Green: Close is above 52WH.
Orange: Close is above 52WH but lower than or equal to open.
Red: Close is below 52WL.
Cyan: Close is below 52WL but higher than or equal to open.
Additional Information:
Levels for coloring candles are dynamically calculated based on percentage differences from 52WH and 52WL.
Historical data is fetched to calculate ATH, ATL, 52WH, and 52WL levels.
The script provides a visual representation of key price levels and candle behavior relative to these levels.
RSI Multi Strategies With Overlay SignalsHello everyone,
In this indicator, you will find 6 different entry and exit signals based on the RSI :
Entry into overbought and oversold zones
Exit from overbought and oversold zones
Crossing the 50 level
RSI cross RSI MA below or above the 50 level
RSI cross RSI MA in the overbought or oversold zones
RSI Divergence
With the signals identified, you can create your own strategy . (If you have any suggestions, please mention them in the comments).
Beyond these signals, you can set SL (Stop Loss) and TP (Take Profit) levels to better manage your positions.
SL Methods:
Percentage: The stop loss is determined by the percentage you specify.
ATR : The stop level is determined based on the Average True Range (ATR).
TP Methods:
Percentage: The take profit is determined by the percentage you specify.
RR ( Risk Reward ): The take profit level is determined based on the distance from the stop level.
You can mix and match these options as you like.
What makes the indicator unique and effective is its ability to display the RSI in the bottom chart and the signals, SL (Stop Loss), and TP (Take Profit) levels in the overlay chart simultaneously. This feature allows you to manage your trading quickly and easily without the need for using two separate indicators.
Let's try out a few strategies together.
My entry signal: RSI Entered OS (Oversold) Zone
My exit signal: RSI Entered OB (Overbought) Zone
I'm not using a stoploss for this strategy ("Fortune favors the brave").
Let's keep ourselves safe by adding a stop loss.
I'm adding an ATR-based stop loss.
I think it's better now.
If you have any questions or suggestions about the indicator, you can contact me.
Cheers

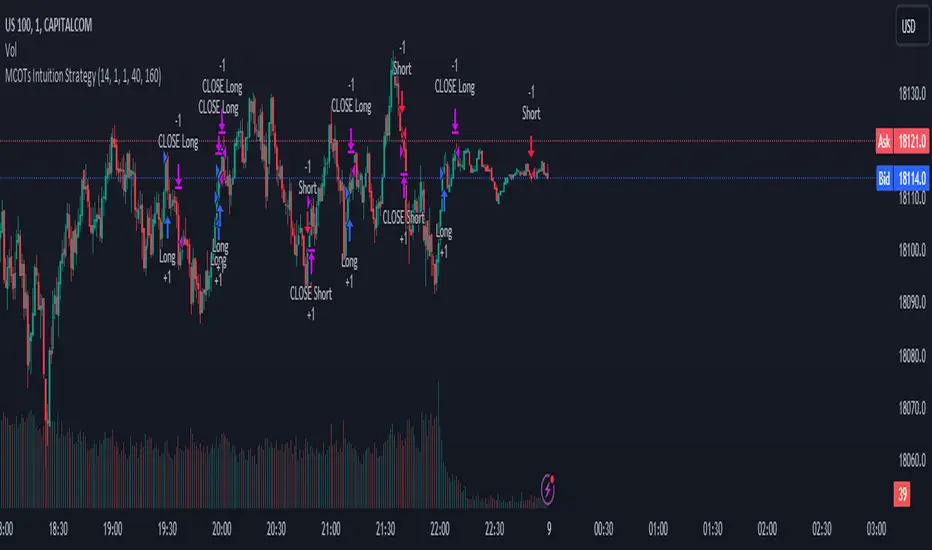
MCOTs Intuition StrategyInitial Capital: The strategy starts with an initial capital of $50,000.
Execution: Trades are executed on every price tick to capture all potential movements.
Contract Size: The default position size is one contract per trade.
Timeframe: Although not explicitly mentioned, this strategy is intended for a one-minute timeframe.
RSI Calculation: The Relative Strength Index (RSI) is calculated over a user-defined period (default is 14 periods).
Standard Deviation: The script calculates the standard deviation of the change in RSI values to determine the threshold for entering trades.
Exhaustion Detection: Before entering a long or short position, the script checks for exhaustion in the RSI’s momentum. This is to avoid entering trades during extreme conditions where a reversal is likely.
Entry Conditions: A long position is entered when the current RSI momentum exceeds the standard deviation threshold and is less than the previous momentum multiplied by an exhaustion factor. A short position is entered under the opposite conditions.
Limit Orders for Exit: Instead of traditional stop loss and take profit orders, the strategy uses limit orders to exit positions. This means the strategy sets a desired price level to close the position and waits for the market to reach this price.
Profit Target and Stop Loss: The script allows setting a profit target and stop loss in terms of ticks, which are the smallest measurable increments in price movement for the traded asset.
blah blah whatever
Evolving RThe "Evolving R" script is a script that allows to calculate a dynamic reward-to-risk ratio at any given point of time during the trade. Its fundamentals are based on Tom Dante's concept of an evolving reward-to-risk. The script requires a user to input their preferred stop loss price and the target price for a specific asset, and calculates the ratio between two differences: (a) the absolute difference between the target price and the current price and (b) the absolute difference between the stop loss price and the current price.
The output of the script displays the ratio discussed as a value called "Evolving R" in the table. In order to use it successfully, the user of the script has to input:
(a) Stop loss price for the asset
(b) Target price for the asset
Theoretically, as long as the evolving R value holds above or equal to 0.25, the trade is worth holding. However, if the evolving R value drops below 0.25, the table turns red and signifies that such a trade possesses more risk than there is a reward remaining: this alerts the user to possibly take profits prematurely without risking their unrealized gains for a minor amount of additional gain.
The graphics of the script are represented by green and red areas: the green area indicates the area between the current price and the target price, while the red area shows the distance between the current price and the stop loss price. This visual representation allows users to understand the relative reward-to-risk ratio graphically in addition to the given evolving R value output.
The script is used for any type of trading: whether trend-trading or in a ranging market, it doesn't suggest a user which market conditions they should use.

Nightrangers IndicatorDescription
This indicator combines three EMA's, Ichimoku Cloud, RSI and MACD. By combining and modifying their use case this turns into an extremely powerful and accessible indicator for finding long and short position entries, below is a description of how to use this indicator, and what makes it different.
Primary Use case
The three EMA's would be the initial indicators you would be looking at, they are based on the 7d, 25d and 200d MA - Used on their own, they would be worthless, and this is where the Ichimoku Cloud comes into it, I have removed all other aspects of the Ichimoku Cloud and only kept the baseline, combine this with the three MA's and we have a very powerful indicator for finding Long entries, that is used uniquely in a way to which the Ichimoku Cloud is not originally meant to be used for.
An early indication of a LONG entry would be when the 7d MA crosses above the Ichimoku Baseline, through this early indicator, you are able to watch and monitor the chart, you would be waiting to see if the 25d MA then also crosses above the Ichimoku Baseline, This would be the second important indication of a long entry. The 200d MA helps here when making decisions on where to set your own personal take profits - If the Ichimoku baseline, and the MA's are below the 200d MA, you would be expecting a bounce point here, or heavy resistance so the long entry could be over a shorter period, than that if it was above the 200d MA, which is why it is included here, to help make a better informed choice.
The latter is reversed for finding short positions, and entries. This indicator is completely reliant on each other to find the best possible entry/exit by complementing each other, and by using the Ichimoku Baseline on it's own, and not as the Ichimoku Cloud is intended.
Just using these though, is not enough, which is why the RSI and MACD are also combined, once the conditions are met above, You may find that there can be false positives for entries, and this is where the RSI has multiple use cases within this script.
Firstly the backdrop colour will change based on whether the chart is in an uptrend or downtrend, This is a visual indicator provided to work simultaneaously on the chart itself to help identification of entries/exits easier to identify in conjunction with the above.
Secondly, It is used to display in the top right, The current Trend in a text format, as well as if the current chart is in one of three phases, these are Overbrought, Oversold and accumulation.
And finally it will display the current RSI Value on the last candle in a clear to see blue Label, This helps with the visual accessible side, to help you make a more informed choice depending on your own personal tolerance.
This ties into the above Indicators, by combining the information, you would not be looking to take a long, if for example, the RSI showed it was over-brought, and in a downtrend, even if the MA's had crossed above the Baseline, as this would most likely be a fakeout.
However if the Indicators above, showed a potential long, and the backdrop had flipped green, indicating an uptrend, and it was in an accumulation phase, you would consider this position. and this is where the MACD comes into play.
You would use the MACD to see whether or not the Signal line has crossed over the MACD line, and vice versa - However this script uses it to simplify and portray current market sentiment, and visually display by reducing clutter on screen, and making it more accessible.
It is designed to portray an easy to read and understand visual indicator by displaying in the top right simply as Bullish or Bearish, with markers above the candles ( "M" and "MX" ).
The M indicator is to show where the MACD Crosses above the Signal, and if aligned with all the other indicators within the script, shows a very strong confirmation for a buying opportunity, and vice versa for the "MX" indicator if aligned with the other indicators in reverse, provides a very strong confirmation for opening a short position or for selling.
Secondary Use case
By combining the indicators above, the secondary conditions you would be looking for, If you opened a LONG position, would be knowing when to sell, On top of what has been described above already regarding this, you would be looking to start taking profits, when the 7d MA crosses above or across the candles, and looking to close the position, when the 25d MA also crosses above the candles, and respectively, in reverse for closing short positions. This is shown across the charts to be extremely useful, however, combine this with the other indicators, portrayed in an easy to use and understand visual representation, you are now able to make more informed decisions, on whether to close a position or not.
How is it different and not just a mash up
I have combined these indicators to make the world of trading more accessible for everyone regardless of circumstances, by creating an easy to understand visual representation, keeping colours vibrant and easy to stand out, with clear and simple to read text indications. So whether you are a seasoned trader, or just starting out, you can make more informed choices, without the need of learning how to use multiple different indicators, and learning how to combine them all, or if you have difficulties learning, this indicator also simplifies a lot of the more technical intricacies, by still allowing you to make a more informed choice.

Inside Candle StrategyIntroduction
The Inside Candle Breakout Strategy leverages the concept of inside candles as a primary signal for potential breakouts. Unlike common trend-following or scalping strategies, this method focuses on the volatility squeeze indicated by inside candles and aims to capture the momentum that follows these periods of consolidation. The strategy's originality lies in its specific integration of timeframes for signal detection and its application across diverse market conditions without relying on conventional trend indicators.
Strategy Description and Mechanics
Inside Candle Identification: At the heart of this strategy is the detection of inside candles, defined as candles fully contained within the range of the preceding candle. This pattern signifies a temporary balance between buyers and sellers, often preceding significant price movements. The strategy scans for these candles within a user-specified timeframe in the input section of the settings of the strategy, allowing for tailored signal generation based on individual trading preferences.
Entry Points and Market Entries: Upon identifying an inside candle and only once this candle closes, the strategy prepares to enter a trade in the direction of the breakout. Trades are executed in the timeframe selected on the chart, ensuring that entry points are aligned with real-time market movements. This process highlights the strategy's adaptability, making it suitable for various trading styles, from day trading to swing trading.
Overlay Indicator for Enhanced Market Analysis: Accompanying the breakout signals is an overlay indicator comprising two moving averages and a volatility cloud. This feature serves as a secondary tool for market analysis, offering insights into the prevailing market trend and volatility levels. While it doesn't influence the entry or exit signals directly, it provides traders with additional context for refining their decisions, enhancing the strategy's utility. This assistance tool is composed by one moving average and a second line which is calculated adding or subtracting the historical volatility of the asset on the moving average, depending on his momentum.
Strategy Results and Commitment to Realism
Backtesting Protocol: In our commitment to transparency and realism, backtesting results are derived from a dataset that ensures a sufficient number of trades (over 100) to validate the strategy's effectiveness. This approach underscores our dedication to providing traders with reliable and actionable insights.
Risk Management and Trade Sizing: Recognizing the importance of sustainable trading practices, the strategy incorporates strict risk management guidelines. Trades are sized to ensure that only a small percentage of equity is risked on a single trade, adhering to widely accepted risk tolerance levels. The initial account size for this script is set to 10000$.
Strategy Defaults and Justification: The default properties of the strategy, including the risk-reward ratio, average length for moving averages, and other parameters, are carefully chosen based on extensive testing and analysis. These settings represent a balanced approach, aiming to optimize the strategy's performance across a variety of market conditions.
Strategy Components:
- Inside Candles: An inside candle occurs when a candle's high and low are completely contained within the high and low of the previous candle. This pattern indicates a period of consolidation or indecision in the market, often preceding a significant price movement. The strategy detects inside candles based on the user-selected timeframe, allowing traders to capture potential breakouts.
Indicator Overlays:
- Moving Average: A simple moving average (SMA) is calculated over a user-defined length (`Average Length`), providing a dynamic baseline to gauge the market's direction. The strategy offers an option (`Show Moving Average`) to display or hide this moving average on the chart, giving traders control over the visual complexity.
- Volatility Measurement: Alongside the moving average, the strategy assesses market volatility using the standard deviation of the closing prices over the same period defined by the `Average Length`. The moving average is adjusted upwards or downwards by this volatility measure, creating a dynamic channel that reflects the current market conditions.
- Color Gradients for Volatility: The strategy uses a color gradient to fill the area between the moving average and its volatility-adjusted counterpart. This gradient visually represents the volatility level, transitioning from gray (low volatility) to a lighter shade (higher volatility), aiding in the assessment of market sentiment and volatility.
Trading Entries:
- Long Entry: A long position is triggered when the closing price exceeds the high of an inside candle, indicating potential bullish momentum. The strategy places a stop-loss at the low of the inside candle and sets a take-profit level based on the predefined risk-reward ratio (`RR Ratio`).
- Short Entry: Conversely, a short position is initiated when the closing price falls below the low of an inside candle, suggesting bearish pressure. A stop-loss is set at the high of the inside candle, with the take-profit level adjusted according to the risk-reward ratio.
Customization Settings:
- Timeframe: Traders can select the desired timeframe for inside candle detection, tailoring the strategy to fit various trading styles and time horizons.
- RR Ratio: The risk-reward ratio is adjustable, allowing traders to manage the potential risk and return of each trade according to their risk tolerance.
- Average Length: This setting determines the period over which the moving average and volatility are calculated, affecting the sensitivity of the strategy to price movements.
- Visual Settings: Users can customize the appearance of the strategy on their charts, including the colors of the moving average and volatility lines, as well as the line width, enhancing chart readability and personal preference adherence.
Disclaimer
Trading involves significant risk, and it is crucial for traders to conduct their own due diligence before engaging with any strategy. The Inside Candle Breakout Strategy is presented for informational purposes only and does not constitute financial advice.

BabyShark VWAP Strategy What the code does:
This Pine Script implements a trading strategy based on two indicators: Volume Weighted Average Price (VWAP) and On Balance Volume (OBV) Relative Strength Index (RSI). The strategy aims to identify potential buy and sell signals based on deviations from VWAP and OBV RSI crossing certain threshold levels.
How it does it:
**VWAP Calculation**: The script calculates the VWAP using either standard deviation or average deviation over a specified length. It then plots the VWAP and its upper and lower deviation bands.
**OBV RSI Calculation**: It computes the OBV and then calculates the RSI using the cumulative changes in OBV. The RSI is plotted and compared against predefined levels.
**Table Visibility and Occurrence Counting**: It allows the user to display a table showing the number of occurrences where the price is above Upper Dev 2, below Lower Dev 2, crosses above a higher RSI level, or crosses below a lower RSI level.
**Entries**: Long and short entry conditions are defined based on the position of the price relative to the VWAP deviation bands and the color of the OBV RSI. Entries are made when specific conditions are met, and there hasn't been a recent entry.
**Exit Conditions**: The script includes stop-loss and take-profit mechanisms. It exits positions based on price crossing the VWAP or a certain percentage, and it prevents further trading after a certain number of consecutive losses.
What traders can use it for:
**Trend Identification**: Traders can use the VWAP and its deviation bands to identify potential trend reversals or continuations.
**Volume Confirmation**: The inclusion of OBV RSI provides confirmation of price movements based on volume changes.
**Entry and Exit Signals**: The script generates buy and sell signals based on the specified conditions, allowing traders to enter and exit positions with defined stop-loss and take-profit levels.
**Statistical Analysis**: The visibility of occurrence counts in the table allows traders to perform statistical analysis on the frequency of price movements relative to the VWAP and OBV RSI levels.

Trading TP SL Risk Commission Calculator🎉 Introducing Your Trading TP SL Risk Commission Calculator! 🎉
Hey there, savvy trader! 🚀 Are you looking to enhance your trading game? Meet the Trading TP SL Risk Commission Calculator! This handy tool is here to guide you through the complexities of trading, providing insights into your potential risks and rewards. Let's walk through how you can leverage it for smarter trading decisions!
Setting Up 🛠
Let's get your calculator ready for action:
Lines and Labels Visibility: Flip this switch on to see your Entry, Take Profit (TP), Stop Loss (SL), and Liquidation points displayed on your chart. It's a great way to get a visual summary of your strategy.
Input Your Trade Details: Enter your Entry Price, Take Profit Price, and Stop Loss Price. These figures are crucial for mapping out your trade.
Order Info: Specify your Order Size in USD, the amount of Leverage you're using, and your platform's Commission Rate. This customizes the calculator to fit your unique trading setup.
Customizing Your View 🎨
Table Placement & Size: Pick the location and size for your results table to appear on your screen. Tailor it to your liking, whether you prefer it out of the way or front and center.
Deciphering Your Results 📊
With your inputs in place, the calculator springs into action. Here's what you'll find:
Risk Assessment (with Emojis!): Quickly gauge your risk level with our intuitive emoji system, ranging from "⛔️⛔️⛔️" (very high risk) to "✅✅✅" (very low risk).
Profit and Loss Insights: Understand your potential take-profit gains and stop-loss implications, both as percentages and in USD. We also factor in fees to give you a clear picture.
Liquidation Alert: For those using leverage, the liquidation price calculation is crucial to avoid unpleasant surprises.
Expert Tips 💡
Stay Flexible: Market conditions evolve, so should your strategy. Revisit and adjust your inputs regularly to stay aligned with your trading goals.
Risk Emoji Check: Keep an eye on your risk level emojis. A sea of "⛔️" might signal it's time to reassess your approach.
Use Visual Guides: The on-chart lines and labels offer a quick visual reference to how your current trade measures up against your TP, SL, and liquidation thresholds.
Dive In and Trade Smart! 🚦
This calculator isn't just about making calculations; it's about empowering you to make informed trading decisions. With this tool in your arsenal, you're equipped to navigate the trading waters with confidence and clarity.

close price numberIn this script, we're creating a custom indicator to plot the previous day's closing price on the chart. This script retrieves the previous day's close using ta.change(time('d')) function. Then, it checks the value of the previous day's close and determines the increment accordingly input . Finally, it calculates the current day's close by adding the increment to the previous day's close and plots it on the chart.
The script can be integrated into a trading strategy to generate buy or sell signals based on the crossing closing price+increment line ...
Psychological Levels: previous day close price + increment numbers tend to have psychological significance in trading. Traders often pay attention to these levels because they represent key price levels that are easy to remember and widely recognized. When the price approaches these levels, traders may anticipate increased buying or selling pressure, leading to potential support or resistance.
For take profit and stop loss -Trader can use this as a take profit level on every previous day close+increment or close-decrement
buy signal-
1)whenever price cross any previous day close+number it give buy signal
2) i am using ma for filter buy signal we can enable and disable that function from input
sell signal-
1)whenever price cross any previous day close-number it give sell signal
2) i am using ma for filter sell signal we can enable and disable that function from input
ICT Killzones Toolkit [LuxAlgo]The ICT Killzones Toolkit is a comprehensive set of tools designed to assist traders in identifying key trading zones and patterns within the market.
The ICT Killzones Toolkit includes the following Price Action components:
ICT Killzones with Pivot Highs/Lows
Order Blocks
Breaker Blocks
Fair Value Gaps
Market Structure Shifts
By combining these components, the ICT Killzones Toolkit provides traders with a comprehensive framework for analyzing the market and identifying setups of interest. Leveraging these tools effectively can enhance traders' decision-making process and improve killzones interpretability.
🔶 USAGE
In forex/futures trading, timing is crucial. ICT Killzone are specific periods when there's a higher chance of finding setups of interest. Mastering these time intervals can offer significant advantages to traders who know how to use them effectively.
The image above highlights a potential setup of interest when using the ICT Killzones Toolkit.
As another example for utilizing the ICT Killzones Toolkit, we can see in the image above when price retests setups generated from killzones such as Order Blocks or Fair Value Gaps, a potential strategy could be to look for entries on those & take profits as the next killzone appears.
🔹 Order Blocks
Order Blocks are sections on a price chart where notable buying or selling activity has occured, often signaling interest zones for institutional traders. This toolkit's Order Blocks component pinpoints these areas within the Killzone, which may act as potential support or resistance levels.
🔹 Breaker Blocks
Breaker Blocks are zones built from mitigated order blocks, and highlight zones on the chart where price has previously stalled or reversed. These areas may act as significant barriers to price movement in the future, and the Breaker Blocks component helps traders identify them for potential trading opportunities.
🔹 Fair Value Gaps
Fair value gaps are especially favored by price action traders and arise from market inefficiencies or imbalances, typically when buying and selling are unequal. These gaps often attract price movement before resuming in the same direction. the Fair Value Gaps component of the toolkit helps traders identify and analyze them.
🔹 Market Structure Shifts
Market Structure Shifts refer to significant changes in the overall structure of the market, such as shifts in trend direction, volatility, or trading activity. These shifts can provide valuable insights into market sentiment and potential trading opportunities, and the Market Structure Shifts component helps traders identify and interpret them.
Overall, the ICT Killzone Toolkit combines these components to provide traders with a comprehensive framework for analyzing the markets and identifying high-probability trading setups.
🔶 SETTINGS
🔹 ICT Killzones
Asian, London Open, New York, and London Close: toggles the visibility of specific Killzones, allowing users to customize time periods and Killzone colors.
Killzone Lines : Top/Bottom, Mean and Extend Top/Bottom: toggles the visibility of the Killzone's pivot high and low lines, mean (average) line, and allows users to extend the pivot lines.
Killzone Labels: Toggles the visibility of the Killzone labels.
Display Killzones within Timeframes Up To: Toggles the visibility of the Killzones up to selected Timeframes.
Open Price, Separator, Label, and Color: toggles the visibility of the open price of the Killzones or for the day, week, or month. If the day, week, or month is selected, a separator will be displayed to highlight the beginning of each respective period. Additionally, users can customize the color and toggle the label as needed.
🔹 Order Blocks & Breaker Blocks
Order Blocks | Breaker Blocks: toggles the visibility of the order blocks & breaker blocks.
Swing Detection Length: lookback period used for the detection of the swing points used to create order blocks & breaker blocks.
Mitigation Price: allows users to select between closing price or wick of the candle.
Use Candle Body in Detection: allows users to use candle bodies as order block areas instead of the full candle range.
Remove Mitigated Order Blocks & Breaker Blocks: toggles the visibility of the mitigated order blocks & breaker blocks.
Extend Order Blocks & Breaker Blocks: enables processing of the order blocks & breaker blocks beyond the boundaries of the killzones.
Display Order Blocks & Breaker Blocks: enables the display of the first, last, or all occurrences of the order blocks & breaker blocks.
Order Blocks : Bullish, Bearish Color: color customization option for order blocks.
Breaker Blocks : Bullish, Bearish Color: color customization option for breaker blocks.
Show Order Blocks & Breaker Blocks Text: toggles the visibility of the order blocks & breaker blocks labels.
🔹 Market Structure Shifts
Market Structure Shifts: toggles the visibility of the market structure shifts.
Detection Length: market structure shift detection length.
Display Market Structure Shifts: enables the display of the first, last, or all occurrences of the market structure shifts.
Market Structure Shifts : Bullish, Bearish Color: color custumization option for market structure shifts.
Show Market Structure Shifts Text: toggles the visibility of the market structure shifts labels.
🔹 Fair Value Gaps
Fair Value Gaps: toggles the visibility of the fair value gaps.
Fair Value Gap Width Filter: filtering threshold wile detecting fair value gaps.
Remove Mitigated Fair Value Gaps: removes mitigated fair value gaps.
Extend Fair Value Gaps: enables processing of the fair value gaps beyond the boundaries of the killzones.
Display Fair Value Gaps: enables the display of the first, last, or all occurrences of the fair value gaps.
Bullish Imbalance Color: color customization option.
Bearish Imbalance Color: color customization option.
Show Fair Value Gaps Text: toggles the visibility of the fair value gaps labels.
🔶 RELATED SCRIPTS
Smart-Money-Concepts
Order-Blocks-Breaker-Blocks
Thanks to our community for recommending this script. For more conceptual scripts and related content, we welcome you to explore by visiting >>> LuxAlgo-Scripts .

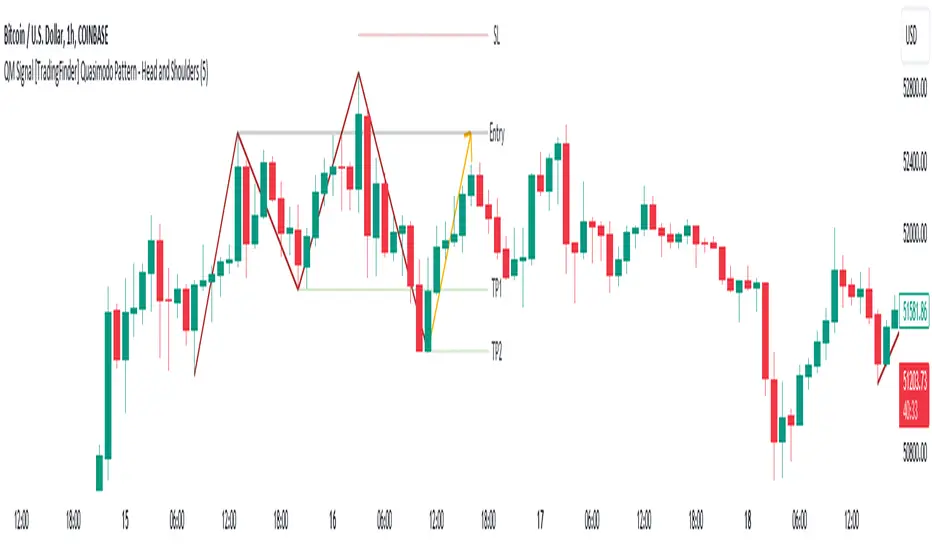
QM Signal [TradingFinder] Quasimodo Pattern - Head and Shoulders🔵 Introduction
One of the patterns in "RTM" is the "QM" pattern, also known as "Quasimodo". Its name is derived from the appearance of "Hunchback of Notre-Dame" from Victor Hugo's novel. It is a type of "Head and Shoulders" pattern.
🔵 Formation Method
🟣 Upward Trend
In an upward trend, the left shoulder is formed, and the price creates a new peak higher than the left shoulder peak . After a decline, it manages to break the previous low and move upward again. We expect the price to return approximately between and to form the "QM" pattern.
🟣 Downward Trend
In a downward trend, with a price decline, a new valley is created, forming the left shoulder, and the price forms a new valley lower than the left shoulder valley . After a price increase, it manages to break the previous high and move downward again. We expect the price to return approximately between and to form the "Quasimodo" pattern.
Note: The "QM" pattern is a specific type of head and shoulders pattern in which in the first move, the previous support is broken and it's the best condition for price reversal.
🔵 Entry Conditions for "Buy" and "Sell"
🟢 Buy
Buy Position : When a complete "QM" pattern is formed in a downtrend; we expect the price to reach the left shoulder area (with confirmation) during the retracement to enter the "BUY" position.
Profit Target in Buy Scenario : Expecting a move to the peak that broke it and the highest point in the current "Swing".
Stop Loss : Below the "Head," which is the lowest point.
🔴 Sell
Sell Position : When a "QM" pattern is formed in an uptrend, we look for entry into the "Sell" position as the price retraces to the left shoulder area.
Profit Target in Sell Scenario : Expecting a move to the price floor that has been broken and the entire "Swing" or .
Take Profit : Above the highest point or above the area will be the "SL" region.
Note : Certainly, no method alone guarantees trading capability and requires different confirmations. This indicator only detects the "QM" pattern, and the rest of the analysis will be the responsibility of the user.
Note : These profit and loss limits are based on market movements and will be provided as approximate and supportive.
Triple MA HTF strategy - Dynamic SmoothingThe triple MA strategy is a simple but effective method to trade the trend. The advantage of this script over the existing triple MA strategies is that the user can open a lower time frame chart and select higher time frame inputs for different MA types mainting the visibility on the chart. The dynamic smoothing code makes sure the HTF trendlines are not jagged, but a fluid line visiable on the lower time frame chart. The script comes with a MA crossover and crossunder strategy explained below.
Moving Averages (MA) Crossover for Entry:
Long Entry: A long entry signal is triggered when the moving average line 1 crosses above the moving average line 2. This crossover indicates a potential shift in market sentiment towards the upside. However, to validate this signal, the strategy checks if the moving average 3 on a higher time frame (eg. 4 hour) is in an upward trend. This additional filter ensures that the trade aligns with the prevailing trend on a broader time scale, increasing the probability of success.
Short Entry: Conversely, a short entry signal occurs when the moving average line 1 crosses below the moving average line 2. This crossover suggests a possible downturn in market momentum. However, for a short trade to be confirmed, the strategy verifies that the moving average 3 on the higher time frame is in a downward trend. This confirmation ensures that the trade is in harmony with the overarching market direction.
Exit from Long Position: The strategy triggers an exit signal from a long position when the moving average line 1 crosses below the moving average line 2. This crossover indicates a potential reversal in the market trend, prompting the trader to close their long position and take profits or minimize losses.
Exit from Short Position: Similarly, an exit signal from a short position occurs when the moving average line 1 crosses above the moving average line 2. This crossover suggests a potential shift in market sentiment towards the upside, prompting the trader to exit their short position and manage their risk accordingly.
Features of the script
This Triple MA Strategy is basically the HTF Trend Filter displayed 3 times on the chart. For more infomation on how the MA with dynamic smoothing is calculated I recommend reading the following script:
For risk management I included a simple script to opt for % of eauity or # of contracts of in the instrument. For explanation on how the risk management settings work I refer to my ealier published script:
The strategy is a simplified example for setting up an entry and exit logic based on multiple moving avarages. Hence the script is meant for educational purposes only.

Dynamic Momentum GaugeOverview
The Dynamic Momentum Gauge is an indicator designed to provide information and insights into the trend and momentum of a financial asset. While this indicator is not directional , it helps you know when there will be a trend, big move, or when momentum will have a run, and when you should take profits.
How It Works
This indicator calculates momentum and then removes the negative values to focus instead on when the big trend could likely happen and when it could end, or when you should enter a trade based on momentum or exit. Traders can basically use this indicator to time their market entries or exits, and align their strategies with momentum dynamics.
How To Use
As previously mentioned, this is not a directional indicator but more like a timing indicator. This indicator helps you find when the trend moves, and big moves in the markets will occur and its possibly best to exit the trades. For example, if you decide to enter a long trade if the Dynamic Momentum Gauge value is at an extreme low and another momentum indicator that you use has conditions that you would consider to long with, then this indicator is basically telling you that there isn't more space for the momentum to squeeze any longer, can only really expand from that point or stay where it currently is, but this is also a mean reverting process so it does tend to go back up from the low point.
Settings:
Length: This is the length of the momentum, by default its at 100.
Normalization Length: Length of the Normalization which ensures the the values fall within a consistent range.

Ichimoku OscillatorHello All,
This is Ichimoku Oscillator that creates different oscillator layers, calculates the trend and possible entry/exit levels by using Ichimoku Cloud features.
There are four layer:
First layer is the distance between closing price and cloud (min or max, depending on the main trend)
Second layer is the distance between Lagging and Cloud X bars ago (X: the displacement)
Third layer is the distance between Conversion and Base lines
Fourth layer is the distance between both Leadlines
If all layers are visible maning that positive according to the main trend, you can take long/short position and when main trend changed then you should close the position. so it doesn't mean you can take position when main trend changed, you need to wait for all other conditions met (all layers(
there is take profit partially option. if Conversion and base lines cross then you can take profit partially. Optionally you can take profit partially when EMA line crosses Fourth layer.
Optionally ATR (average true range) is used for Conversion and baseline for protection from whipsaws. you can use it to stay on the trend longer time.
I added options to enable/disable the alert and customize alert messages. You can change alert messages as you wish. if you use ' close ' in the alert message then you can get closing price in the alert message when the alert was triggered.
There is an option Bounce Off Support/Resistance , if there is trend and if the price bounce off Support/Resistance zone then a tiny triangle is shown.
There are many other options for coloring, alerts etc.
Some screenshots:
Main trend:
Taking/closing positions:
Example alert messages:
Bounce off:
Colors:
Colors:
Colors:
Non-colored background:
P.S. For a few months I haven't published any new script because of some health issues. hope to be healthy and create new scripts in 2024 :)
Enjoy!
