888 BOT #backtest█ 888 BOT #backtest (open source)
This is an Expert Advisor 'EA' or Automated trading script for ‘longs’ and ‘shorts’, which uses only a Take Profit or, in the worst case, a Stop Loss to close the trade.
It's a much improved version of the previous ‘Repanocha’. It doesn`t use 'Trailing Stop' or 'security()' functions (although using a security function doesn`t mean that the script repaints) and all signals are confirmed, therefore the script doesn`t repaint in alert mode and is accurate in backtest mode.
Apart from the previous indicators, some more and other functions have been added for Stop-Loss, re-entry and leverage.
It uses 8 indicators, (many of you already know what they are, but in case there is someone new), these are the following:
1. Jurik Moving Average
It's a moving average created by Mark Jurik for professionals which eliminates the 'lag' or delay of the signal. It's better than other moving averages like EMA , DEMA , AMA or T3.
There are two ways to decrease noise using JMA . Increasing the 'LENGTH' parameter will cause JMA to move more slowly and therefore reduce noise at the expense of adding 'lag'
The 'JMA LENGTH', 'PHASE' and 'POWER' parameters offer a way to select the optimal balance between 'lag' and over boost.
Green: Bullish , Red: Bearish .
2. Range filter
Created by Donovan Wall, its function is to filter or eliminate noise and to better determine the price trend in the short term.
First, a uniform average price range 'SAMPLING PERIOD' is calculated for the filter base and multiplied by a specific quantity 'RANGE MULTIPLIER'.
The filter is then calculated by adjusting price movements that do not exceed the specified range.
Finally, the target ranges are plotted to show the prices that will trigger the filter movement.
Green: Bullish , Red: Bearish .
3. Average Directional Index ( ADX Classic) and ( ADX Masanakamura)
It's an indicator designed by Welles Wilder to measure the strength and direction of the market trend. The price movement is strong when the ADX has a positive slope and is above a certain minimum level 'ADX THRESHOLD' and for a given period 'ADX LENGTH'.
The green color of the bars indicates that the trend is bullish and that the ADX is above the level established by the threshold.
The red color of the bars indicates that the trend is down and that the ADX is above the threshold level.
The orange color of the bars indicates that the price is not strong and will surely lateralize.
You can choose between the classic option and the one created by a certain 'Masanakamura'. The main difference between the two is that in the first it uses RMA () and in the second SMA () in its calculation.
4. Parabolic SAR
This indicator, also created by Welles Wilder, places points that help define a trend. The Parabolic SAR can follow the price above or below, the peculiarity that it offers is that when the price touches the indicator, it jumps to the other side of the price (if the Parabolic SAR was below the price it jumps up and vice versa) to a distance predetermined by the indicator. At this time the indicator continues to follow the price, reducing the distance with each candle until it is finally touched again by the price and the process starts again. This procedure explains the name of the indicator: the Parabolic SAR follows the price generating a characteristic parabolic shape, when the price touches it, stops and turns ( SAR is the acronym for 'stop and reverse'), giving rise to a new cycle. When the points are below the price, the trend is up, while the points above the price indicate a downward trend.
5. RSI with Volume
This indicator was created by LazyBear from the popular RSI .
The RSI is an oscillator-type indicator used in technical analysis and also created by Welles Wilder that shows the strength of the price by comparing individual movements up or down in successive closing prices.
LazyBear added a volume parameter that makes it more accurate to the market movement.
A good way to use RSI is by considering the 50 'RSI CENTER LINE' centerline. When the oscillator is above, the trend is bullish and when it is below, the trend is bearish .
6. Moving Average Convergence Divergence ( MACD ) and ( MAC-Z )
It was created by Gerald Appel. Subsequently, the histogram was added to anticipate the crossing of MA. Broadly speaking, we can say that the MACD is an oscillator consisting of two moving averages that rotate around the zero line. The MACD line is the difference between a short moving average 'MACD FAST MA LENGTH' and a long moving average 'MACD SLOW MA LENGTH'. It's an indicator that allows us to have a reference on the trend of the asset on which it is operating, thus generating market entry and exit signals.
We can talk about a bull market when the MACD histogram is above the zero line, along with the signal line, while we are talking about a bear market when the MACD histogram is below the zero line.
There is the option of using the MAC-Z indicator created by LazyBear, which according to its author is more effective, by using the parameter VWAP ( volume weighted average price ) 'Z-VWAP LENGTH' together with a standard deviation 'STDEV LENGTH' in its calculation.
7. Volume Condition
Volume indicates the number of participants in this war between bulls and bears, the more volume the more likely the price will move in favor of the trend. A low trading volume indicates a lower number of participants and interest in the instrument in question. Low volumes may reveal weakness behind a price movement.
With this condition, those signals whose volume is less than the volume SMA for a period 'SMA VOLUME LENGTH' multiplied by a factor 'VOLUME FACTOR' are filtered. In addition, it determines the leverage used, the more volume , the more participants, the more probability that the price will move in our favor, that is, we can use more leverage. The leverage in this script is determined by how many times the volume is above the SMA line.
The maximum leverage is 8.
8. Bollinger Bands
This indicator was created by John Bollinger and consists of three bands that are drawn superimposed on the price evolution graph.
The central band is a moving average, normally a simple moving average calculated with 20 periods is used. ('BB LENGTH' Number of periods of the moving average)
The upper band is calculated by adding the value of the simple moving average X times the standard deviation of the moving average. ('BB MULTIPLIER' Number of times the standard deviation of the moving average)
The lower band is calculated by subtracting the simple moving average X times the standard deviation of the moving average.
the band between the upper and lower bands contains, statistically, almost 90% of the possible price variations, which means that any movement of the price outside the bands has special relevance.
In practical terms, Bollinger bands behave as if they were an elastic band so that, if the price touches them, it has a high probability of bouncing.
Sometimes, after the entry order is filled, the price is returned to the opposite side. If price touch the Bollinger band in the same previous conditions, another order is filled in the same direction of the position to improve the average entry price, (% MINIMUM BETTER PRICE ': Minimum price for the re-entry to be executed and that is better than the price of the previous position in a given %) in this way we give the trade a chance that the Take Profit is executed before. The downside is that the position is doubled in size. 'ACTIVATE DIVIDE TP': Divide the size of the TP in half. More probability of the trade closing but less profit.
█ STOP LOSS and RISK MANAGEMENT.
A good risk management is what can make your equity go up or be liquidated.
The % risk is the percentage of our capital that we are willing to lose by operation. This is recommended to be between 1-5%.
% Risk: (% Stop Loss x % Equity per trade x Leverage) / 100
First the strategy is calculated with Stop Loss, then the risk per operation is determined and from there, the amount per operation is calculated and not vice versa.
In this script you can use a normal Stop Loss or one according to the ATR. Also activate the option to trigger it earlier if the risk percentage is reached. '% RISK ALLOWED'
'STOP LOSS CONFIRMED': The Stop Loss is only activated if the closing of the previous bar is in the loss limit condition. It's useful to prevent the SL from triggering when they do a ‘pump’ to sweep Stops and then return the price to the previous state.
█ BACKTEST
The objective of the Backtest is to evaluate the effectiveness of our strategy. A good Backtest is determined by some parameters such as:
- RECOVERY FACTOR: It consists of dividing the 'net profit' by the 'drawdown’. An excellent trading system has a recovery factor of 10 or more; that is, it generates 10 times more net profit than drawdown.
- PROFIT FACTOR: The ‘Profit Factor’ is another popular measure of system performance. It's as simple as dividing what win trades earn by what loser trades lose. If the strategy is profitable then by definition the 'Profit Factor' is going to be greater than 1. Strategies that are not profitable produce profit factors less than one. A good system has a profit factor of 2 or more. The good thing about the ‘Profit Factor’ is that it tells us what we are going to earn for each dollar we lose. A profit factor of 2.5 tells us that for every dollar we lose operating we will earn 2.5.
- SHARPE: (Return system - Return without risk) / Deviation of returns.
When the variations of gains and losses are very high, the deviation is very high and that leads to a very poor ‘Sharpe’ ratio. If the operations are very close to the average (little deviation) the result is a fairly high 'Sharpe' ratio. If a strategy has a 'Sharpe' ratio greater than 1 it is a good strategy. If it has a 'Sharpe' ratio greater than 2, it is excellent. If it has a ‘Sharpe’ ratio less than 1 then we don't know if it is good or bad, we have to look at other parameters.
- MATHEMATICAL EXPECTATION: (% winning trades X average profit) + (% losing trades X average loss).
To earn money with a Trading system, it is not necessary to win all the operations, what is really important is the final result of the operation. A Trading system has to have positive mathematical expectation as is the case with this script: ME = (0.87 x 30.74$) - (0.13 x 56.16$) = (26.74 - 7.30) = 19.44$ > 0
The game of roulette, for example, has negative mathematical expectation for the player, it can have positive winning streaks, but in the long term, if you continue playing you will end up losing, and casinos know this very well.
PARAMETERS
'BACKTEST DAYS': Number of days back of historical data for the calculation of the Backtest.
'ENTRY TYPE': For '% EQUITY' if you have $ 10,000 of capital and select 7.5%, for example, your entry would be $ 750 without leverage. If you select CONTRACTS for the 'BTCUSDT' pair, for example, it would be the amount in 'Bitcoins' and if you select 'CASH' it would be the amount in $ dollars.
'QUANTITY (LEVERAGE 1X)': The amount for an entry with X1 leverage according to the previous section.
'MAXIMUM LEVERAGE': It's the maximum allowed multiplier of the quantity entered in the previous section according to the volume condition.
The settings are for Bitcoin at Binance Futures (BTC: USDTPERP) in 15 minutes.
For other pairs and other timeframes, the settings have to be adjusted again. And within a month, the settings will be different because we all know the market and the trend are changing.
在腳本中搜尋"the strat"

Combo Backtest 123 Reversal & Volume SMA This is combo strategies for get a cumulative signal.
First strategy
This System was created from the Book "How I Tripled My Money In The
Futures Market" by Ulf Jensen, Page 183. This is reverse type of strategies.
The strategy buys at market, if close price is higher than the previous close
during 2 days and the meaning of 9-days Stochastic Slow Oscillator is lower than 50.
The strategy sells at market, if close price is lower than the previous close price
during 2 days and the meaning of 9-days Stochastic Fast Oscillator is higher than 50.
Second strategy
Volume and SMA
WARNING:
- For purpose educate only
- This script to change bars colors.

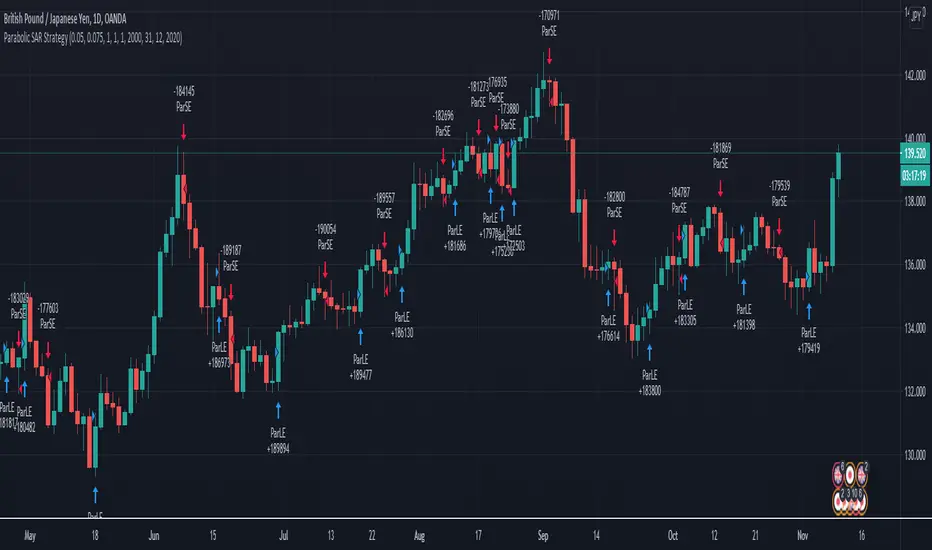
Parabolic SAR Swing strategy GBP JPY Daily timeframeToday I bring you a new strategy thats made of parabolic sar. It has optmized values for GBPJPY Daily timeframe chart.
It also has a time period selection, in order to see how it behave between selected years.
The strategy behind it is simple :
We have an uptrend , (the psar is below our candles) we go long. We exit when our candle crosses the psar value.
The same applies for downtrend(the psar is above our candles), where we go short. We exit when our candle cross the psar value.
Among the basic indicators, it looks like PSAR is one of the best canditates for swing trading.
If you have any questions, please let me know.
Combo Backtest 123 Reversal & Gann Swing Oscillator This is combo strategies for get a cumulative signal.
First strategy
This System was created from the Book "How I Tripled My Money In The
Futures Market" by Ulf Jensen, Page 183. This is reverse type of strategies.
The strategy buys at market, if close price is higher than the previous close
during 2 days and the meaning of 9-days Stochastic Slow Oscillator is lower than 50.
The strategy sells at market, if close price is lower than the previous close price
during 2 days and the meaning of 9-days Stochastic Fast Oscillator is higher than 50.
Second strategy
The Gann Swing Oscillator has been adapted from Robert Krausz's book,
"A W.D. Gann Treasure Discovered". The Gann Swing Oscillator helps
define market swings.
WARNING:
- For purpose educate only
- This script to change bars colors.

Combo Backtest 123 Reversal & FX Sniper: T3-CCI This is combo strategies for get a cumulative signal.
First strategy
This System was created from the Book "How I Tripled My Money In The
Futures Market" by Ulf Jensen, Page 183. This is reverse type of strategies.
The strategy buys at market, if close price is higher than the previous close
during 2 days and the meaning of 9-days Stochastic Slow Oscillator is lower than 50.
The strategy sells at market, if close price is lower than the previous close price
during 2 days and the meaning of 9-days Stochastic Fast Oscillator is higher than 50.
Second strategy
This simple indicator gives you a lot of useful information - when to enter, when to exit
and how to reduce risks by entering a trade on a double confirmed signal.
You can use in the xPrice any series: Open, High, Low, Close, HL2, HLC3, OHLC4 and ect...
WARNING:
- For purpose educate only
- This script to change bars colors.

Combo Backtest 123 Reversal & Volatility Finite Volume ElementsThis is combo strategies for get a cumulative signal.
First strategy
This System was created from the Book "How I Tripled My Money In The
Futures Market" by Ulf Jensen, Page 183. This is reverse type of strategies.
The strategy buys at market, if close price is higher than the previous close
during 2 days and the meaning of 9-days Stochastic Slow Oscillator is lower than 50.
The strategy sells at market, if close price is lower than the previous close price
during 2 days and the meaning of 9-days Stochastic Fast Oscillator is higher than 50.
Second strategy
This is another version of FVE indicator that we have posted earlier
in this forum.
This version has an important enhancement to the previous one that`s
especially useful with intraday minute charts.
Due to the volatility had not been taken into account to avoid the extra
complication in the formula, the previous formula has some drawbacks:
The main drawback is that the constant cutoff coefficient will overestimate
price changes in minute charts and underestimate corresponding changes in
weekly or monthly charts.
And now the indicator uses adaptive cutoff coefficient which will adjust to
all time frames automatically.
WARNING:
- For purpose educate only
- This script to change bars colors.

Combo Backtest 123 Reversal & FSK (Fast and Slow Kurtosis) This is combo strategies for get a cumulative signal.
First strategy
This System was created from the Book "How I Tripled My Money In The
Futures Market" by Ulf Jensen, Page 183. This is reverse type of strategies.
The strategy buys at market, if close price is higher than the previous close
during 2 days and the meaning of 9-days Stochastic Slow Oscillator is lower than 50.
The strategy sells at market, if close price is lower than the previous close price
during 2 days and the meaning of 9-days Stochastic Fast Oscillator is higher than 50.
Second strategy
This indicator plots the Fast & Slow Kurtosis. The Kurtosis is a market
sentiment indicator. The Kurtosis is constructed from three different parts.
The Kurtosis, the Fast Kurtosis(FK), and the Fast/Slow Kurtosis(FSK).
WARNING:
- For purpose educate only
- This script to change bars colors.

Cycles StrategyThis is back-testable strategy is a modified version of the Stochastic strategy. It is meant to accompany the modified Stochastic indicator: "Cycles".
Modifications to the Stochastic strategy include;
1. Programmable settings for the Stochastic Periods (%K, %D and Smooth %K).
2. Programmable settings for the MACD Periods (Fast, Slow, Smoothing)
3. Programmable thresholds for %K, to qualify a potential entry strategy.
4. Programmable thresholds for %D, to qualify a potential exit strategy.
5. Buttons to choose which components to use in the trading algorithm.
6. Choose the month and year to back test.
The trading algorithm:
1. When %K exceeds the upper/lower threshold and then hooks down/up, in the direction of the Moving Average (MA). This is the minimum entry qualification.
2. When %D exceeds the lower/upper threshold and angled in the direction of the trade, is the exit qualification.
3. Additional entry filters include the direction of MACD, Signal and %D. Also, the "cliff", being a long entry is a higher high or a short entry is a lower low.
4. Strategy can only go "Long" or "Short" depending on the selected setting.
5. By matching the settings in the "Cycles" indicator, you can (almost) see what the strategy is doing.
6. Be sure to select the "Recalculate" buttons, to recalculate on every new Tick, for best results.
Please click the Like button and leave a comment if you appreciate this script. Improvements will be implemented as time goes on.
I am not a licensed trade advisor. This strategy is for entertainment only. Use at your own risk!

Combo Backtest 123 Reversal & Fractal Chaos Oscillator This is combo strategies for get a cumulative signal.
First strategy
This System was created from the Book "How I Tripled My Money In The
Futures Market" by Ulf Jensen, Page 183. This is reverse type of strategies.
The strategy buys at market, if close price is higher than the previous close
during 2 days and the meaning of 9-days Stochastic Slow Oscillator is lower than 50.
The strategy sells at market, if close price is lower than the previous close price
during 2 days and the meaning of 9-days Stochastic Fast Oscillator is higher than 50.
Second strategy
The value of Fractal Chaos Oscillator is calculated as the difference between
the most subtle movements of the market. In general, its value moves between
-1.000 and 1.000. The higher the value of the Fractal Chaos Oscillator, the
more one can say that it follows a certain trend – an increase in prices trend,
or a decrease in prices trend.
Being an indicator expressed in a numeric value, traders say that this is an
indicator that puts a value on the trendiness of the markets. When the FCO reaches
a high value, they initiate the “buy” operation, contrarily when the FCO reaches a
low value, they signal the “sell” action. This is an excellent indicator to use in
intra-day trading.
WARNING:
- For purpose educate only
- This script to change bars colors.

RSI on VWAP Upgraded strategyFirst of all, the idea of apply RSI to VWAP was inspired by XaviZ; at least, that where I first saw that.
I simply applied the idea and searched for apply this on lower timeframe (M15) to increase the number of positions and improve the profit factor.
The conditions to enter are the same :
long : enter on RSI crossover oversold level
short : enter on RSI crossunder oversell level
To close position, I found a little change to apply :
long : close position when RSI(VWAP) went in overbought zone and crossunder the overbought level OR after being at least x bars in the overbought zone (parameter is 28 by default) => when the first condition happens
short : close position when RSI(VWAP) went in oversold zone and crossover the oversold level OR after being at least x bars in the oversell zone (parameter is 28 by default) => when the first condition happens
With this change, I got better results specially on BTCUSDTPERP (M15) where I reach a 6.8 profit factor with 119 trades closed. Not BAD !
The defaults parameters are the best found for BTCUSDTPERP (M15), but the strategy works fine for other pairs if you take time to find the rights combinations.
In this strategy you can change (with defaults in () ):
RSI length (28)
RSI overbought level (85)
RSI oversell level (30)
Number of bars before leaving as explain above (28)
The choice to take longs only, shorts only or both
The number of coin/token by position
The start date for backtesting
Please note that the script use a pyramiding parameter of 3 (can be changed in the first line of the script); that means that you can take up to 3 positions before closing. It lets you improve average enter price but increase the risk. 3 is the best I found to improve profit factor without expose myself too much.
This script would be better if automated because of the conditions of buy and sell.
It's only for educative purpose, not an advice to invest.
All my free scripts here : fr.tradingview.com
Leave a message and don't forget to follow me ;) !

Combo Backtest 123 Reversal & Fractal Chaos Bands This is combo strategies for get a cumulative signal.
First strategy
This System was created from the Book "How I Tripled My Money In The
Futures Market" by Ulf Jensen, Page 183. This is reverse type of strategies.
The strategy buys at market, if close price is higher than the previous close
during 2 days and the meaning of 9-days Stochastic Slow Oscillator is lower than 50.
The strategy sells at market, if close price is lower than the previous close price
during 2 days and the meaning of 9-days Stochastic Fast Oscillator is higher than 50.
Second strategy
Stock market moves in a highly chaotic way, but at a larger scale, the movements
follow a certain pattern that can be applied to shorter or longer periods of time
and we can use Fractal Chaos Bands Indicator to identify those patterns. Basically,
the Fractal Chaos Bands Indicator helps us to identify whether the stock market is
trending or not. When a market is trending, the bands will have a slope and if market
is not trending the bands will flatten out. As the slope of the bands decreases, it
signifies that the market is choppy, insecure and variable. As the graph becomes more
and more abrupt, be it going up or down, the significance is that the market becomes
trendy, or stable. Fractal Chaos Bands Indicator is used similarly to other bands-indicator
(Bollinger bands for instance), offering trading opportunities when price moves above or
under the fractal lines.
The FCB indicator looks back in time depending on the number of time periods trader selected
to plot the indicator. The upper fractal line is made by plotting stock price highs and the
lower fractal line is made by plotting stock price lows. Essentially, the Fractal Chaos Bands
show an overall panorama of the price movement, as they filter out the insignificant fluctuations
of the stock price.
WARNING:
- For purpose educate only
- This script to change bars colors.

Combo Backtest 123 Reversal & Floor Pivot Points This is combo strategies for get a cumulative signal.
First strategy
This System was created from the Book "How I Tripled My Money In The
Futures Market" by Ulf Jensen, Page 183. This is reverse type of strategies.
The strategy buys at market, if close price is higher than the previous close
during 2 days and the meaning of 9-days Stochastic Slow Oscillator is lower than 50.
The strategy sells at market, if close price is lower than the previous close price
during 2 days and the meaning of 9-days Stochastic Fast Oscillator is higher than 50.
Second strategy
The name ‘Floor-Trader Pivot,’ came from the fact that Pivot points can
be calculated quickly, on the fly using price data from the previous day
as an input. Although time-frames of less than a day can be used, Pivots are
commonly plotted on the Daily Chart; using price data from the previous day’s
trading activity.
WARNING:
- For purpose educate only
- This script to change bars colors.

Combo Backtest 123 Reversal & Future Lines of Demarcation This is combo strategies for get a cumulative signal.
First strategy
This System was created from the Book "How I Tripled My Money In The
Futures Market" by Ulf Jensen, Page 183. This is reverse type of strategies.
The strategy buys at market, if close price is higher than the previous close
during 2 days and the meaning of 9-days Stochastic Slow Oscillator is lower than 50.
The strategy sells at market, if close price is lower than the previous close price
during 2 days and the meaning of 9-days Stochastic Fast Oscillator is higher than 50.
Second strategy
An FLD is a line that is plotted on the same scale as the price and is in fact the
price itself displaced to the right (into the future) by (approximately) half the
wavelength of the cycle for which the FLD is plotted. There are three FLD's that can be
plotted for each cycle:
An FLD based on the median price.
An FLD based on the high price.
An FLD based on the low price.
WARNING:
- For purpose educate only
- This script to change bars colors.

Combo Backtest 123 Reversal & Fisher Transform Indicator This is combo strategies for get a cumulative signal.
First strategy
This System was created from the Book "How I Tripled My Money In The
Futures Market" by Ulf Jensen, Page 183. This is reverse type of strategies.
The strategy buys at market, if close price is higher than the previous close
during 2 days and the meaning of 9-days Stochastic Slow Oscillator is lower than 50.
The strategy sells at market, if close price is lower than the previous close price
during 2 days and the meaning of 9-days Stochastic Fast Oscillator is higher than 50.
Second strategy
Market prices do not have a Gaussian probability density function
as many traders think. Their probability curve is not bell-shaped.
But trader can create a nearly Gaussian PDF for prices by normalizing
them or creating a normalized indicator such as the relative strength
index and applying the Fisher transform. Such a transformed output
creates the peak swings as relatively rare events.
Fisher transform formula is: y = 0.5 * ln ((1+x)/(1-x))
The sharp turning points of these peak swings clearly and unambiguously
identify price reversals in a timely manner.
WARNING:
- For purpose educate only
- This script to change bars colors.
Combo Backtest 123 Reversal & Finite Volume Elements (FVE) This is combo strategies for get a cumulative signal.
First strategy
This System was created from the Book "How I Tripled My Money In The
Futures Market" by Ulf Jensen, Page 183. This is reverse type of strategies.
The strategy buys at market, if close price is higher than the previous close
during 2 days and the meaning of 9-days Stochastic Slow Oscillator is lower than 50.
The strategy sells at market, if close price is lower than the previous close price
during 2 days and the meaning of 9-days Stochastic Fast Oscillator is higher than 50.
Second strategy
The FVE is a pure volume indicator. Unlike most of the other indicators
(except OBV), price change doesn?t come into the equation for the FVE (price
is not multiplied by volume), but is only used to determine whether money is
flowing in or out of the stock. This is contrary to the current trend in the
design of modern money flow indicators. The author decided against a price-volume
indicator for the following reasons:
- A pure volume indicator has more power to contradict.
- The number of buyers or sellers (which is assessed by volume) will be the same,
regardless of the price fluctuation.
- Price-volume indicators tend to spike excessively at breakouts or breakdowns.
WARNING:
- For purpose educate only
- This script to change bars colors.

Combo Backtest 123 Reversal & Extracting The Trend This is combo strategies for get a cumulative signal.
First strategy
This System was created from the Book "How I Tripled My Money In The
Futures Market" by Ulf Jensen, Page 183. This is reverse type of strategies.
The strategy buys at market, if close price is higher than the previous close
during 2 days and the meaning of 9-days Stochastic Slow Oscillator is lower than 50.
The strategy sells at market, if close price is lower than the previous close price
during 2 days and the meaning of 9-days Stochastic Fast Oscillator is higher than 50.
Second strategy
Extracting The Trend
The related article is copyrighted material from Stocks & Commodities Mar 2010
WARNING:
- For purpose educate only
- This script to change bars colors.

Power X Strategy Back-testThis script back-test the Power X Strategy developed by Markus Heitkoetter and Rockwell Trading. For more detail about the strategy, please refer to "The PowerX Strategy: How to Trade Stocks and Options in Only 15 Minutes a Day" written by Markus Heitkoetter. Note that this script is not publish, develop or maintain by Rockwell Trading, and may have different results. Rockwell Trading has a powerful software called Power X Optimizer, which scan, back-test and optimize the best stock for the strategy.
The Power X Strategy uses RSI , Slow Stochastic and MACD indicators under the hood. When RSI and slow Stochastic are both greater than 50 and MACD crosses up the signal line, it marks as up-trend. If RSI and slow stochastic are both less than 50 and MACD crosses down the signal line, it marks as down-trend. Other are mark as no trend.
This back-test makes a long entry with an up-trend momentum and short entry with down-trend momentum. Trade is exited when profit target or stop lose is reach. Profit target and stop lose is calculated based on 7 days Average Daily Range (ADR).
If the either of the momentum is lost, trade is exited the next day. It also skips the entire month of March 2020, since the market crash and is not in a normal market condition for the strategy.
Combo Backtest 123 Reversal & Ergodic TSI This is combo strategies for get a cumulative signal.
First strategy
This System was created from the Book "How I Tripled My Money In The
Futures Market" by Ulf Jensen, Page 183. This is reverse type of strategies.
The strategy buys at market, if close price is higher than the previous close
during 2 days and the meaning of 9-days Stochastic Slow Oscillator is lower than 50.
The strategy sells at market, if close price is lower than the previous close price
during 2 days and the meaning of 9-days Stochastic Fast Oscillator is higher than 50.
Second strategy
r - Length of first EMA smoothing of 1 day momentum 4
s - Length of second EMA smoothing of 1 day smoothing 8
u- Length of third EMA smoothing of 1 day momentum 6
Length of EMA signal line 3
Source of Ergotic TSI Close
This is one of the techniques described by William Blau in his book "Momentum,
Direction and Divergence" (1995). If you like to learn more, we advise you to
read this book. His book focuses on three key aspects of trading: momentum,
direction and divergence. Blau, who was an electrical engineer before becoming
a trader, thoroughly examines the relationship between price and momentum in
step-by-step examples. From this grounding, he then looks at the deficiencies
in other oscillators and introduces some innovative techniques, including a
fresh twist on Stochastics. On directional issues, he analyzes the intricacies
of ADX and offers a unique approach to help define trending and non-trending periods.
WARNING:
- For purpose educate only
- This script to change bars colors.

Combo Backtest 123 Reversal & Ergodic MDI This is combo strategies for get a cumulative signal.
First strategy
This System was created from the Book "How I Tripled My Money In The
Futures Market" by Ulf Jensen, Page 183. This is reverse type of strategies.
The strategy buys at market, if close price is higher than the previous close
during 2 days and the meaning of 9-days Stochastic Slow Oscillator is lower than 50.
The strategy sells at market, if close price is lower than the previous close price
during 2 days and the meaning of 9-days Stochastic Fast Oscillator is higher than 50.
Second strategy
This is one of the techniques described by William Blau in his book "Momentum,
Direction and Divergence" (1995). If you like to learn more, we advise you to
read this book. His book focuses on three key aspects of trading: momentum,
direction and divergence. Blau, who was an electrical engineer before becoming
a trader, thoroughly examines the relationship between price and momentum in
step-by-step examples. From this grounding, he then looks at the deficiencies
in other oscillators and introduces some innovative techniques, including a
fresh twist on Stochastics. On directional issues, he analyzes the intricacies
of ADX and offers a unique approach to help define trending and non-trending periods.
WARNING:
- For purpose educate only
- This script to change bars colors.
Combo Backtest 123 Reversal & Ergodic MACD This is combo strategies for get a cumulative signal.
First strategy
This System was created from the Book "How I Tripled My Money In The
Futures Market" by Ulf Jensen, Page 183. This is reverse type of strategies.
The strategy buys at market, if close price is higher than the previous close
during 2 days and the meaning of 9-days Stochastic Slow Oscillator is lower than 50.
The strategy sells at market, if close price is lower than the previous close price
during 2 days and the meaning of 9-days Stochastic Fast Oscillator is higher than 50.
Second strategy
This is one of the techniques described by William Blau in his book
"Momentum, Direction and Divergence" (1995). If you like to learn more,
we advise you to read this book. His book focuses on three key aspects
of trading: momentum, direction and divergence. Blau, who was an electrical
engineer before becoming a trader, thoroughly examines the relationship
between price and momentum in step-by-step examples. From this grounding,
he then looks at the deficiencies in other oscillators and introduces some
innovative techniques, including a fresh twist on Stochastics. On directional
issues, he analyzes the intricacies of ADX and offers a unique approach to help
define trending and non-trending periods.
Blau`s indicator is like usual MACD, but it plots opposite of meaningof
stndard MACD indicator.
WARNING:
- For purpose educate only
- This script to change bars colors.
Grid Like StrategyIt is possible to use progressive position sizing in order to recover from past losses, a well-known position sizing system being the "martingale", which consists of doubling your position size after a loss, this allows you to recover any previous losses in a losing streak + winning an extra. This system has seen a lot of attention from the trading community (mostly from beginners), and many strategies have been designed around the martingale, one of them being "grid trading strategies".
While such strategies often shows promising results on paper, they are often subjects to many frictions during live trading that makes them totally unusable and dangerous to the trader. The motivations behind posting such a strategy isn't to glorify such systems, but rather to present the problems behind them, many users come to me with their ideas and glorious ways to make money, sometimes they present strategies using the martingale, and it is important to present the flaws of this methodology rather than blindly saying "you shouldn't use it".
Strategy Settings
Point determines the "grid" size and should be adjusted accordingly to the scale of the symbol you are applying the strategy to. Higher value would require larger price movements in order to trigger a trade, as such higher values will generate fewer trades.
The order size determines the number of contracts/shares to purchase.
The martingale multiplier determines the factor by which the position size is multiplied after a loss, using values higher to 2 will "squarify" your balance, while a value of 1 would use a constant position sizing.
Finally, the anti-martingale parameter determines whether the strategy uses a reverse martingale or not, if set to true then the position size is multiplied after any wins.
The Grid
Grid strategies are commons and do not present huge problems until we use certain position sizing methods such as the martingale. A martingale is extremely sensitive to any kind of friction (frictional costs, slippage...etc), the grid strategy aims to provide a stable and simple environment where a martingale might possibly behave well.
The goal of a simple grid strategy is to go long once the price crossover a certain level, a take profit is set at the level above the current one and stop loss is placed at the level below the current one, in a winning scenario the price reach the take profit, the position is closed and a new one is opened with the same setup. In a losing scenario, the price reaches the stop loss level, the position is closed and a short one is opened, the take profit is set at the level below the current one, and a stop loss is set at the level above the current one. Note that all levels are equally spaced.
It follows from this strategy that wins and losses should be constant over time, as such our balance would evolve in a linear fashion. This is a great setup for a martingale, as we are theoretically assured to recover all the looses in a losing streak.
Martingale - Exponential Decays - Risk/Reward
By using a martingale we double our position size (exposure) each time we lose a trade, if we look at our balance when using a martingale we see significant drawdowns, with our balance peaking down significantly. The martingale sequence is subject to exponential growth, as such using a martingale makes our balance exposed to exponential decays, that's really bad, we could basically lose all the initially invested capital in a short amount of time, it follows from this that the theoretical success of a martingale is determined by what is the maximum losing streak you can endure
Now consider how a martingale affects our risk-reward ratio, assuming unity position sizing our martingale sequence can be described by 2^(x-1) , using this formula we would get the amount of shares/contracts we need to purchase at the x trade of a losing streak, we would need to purchase 256 contracts in order to recover from a losing streak of size 9, this is enormous when you take into account that your wins are way smaller, the risk-reward ratio is totally unfair.
Of course, some users might think that a losing streak of size 9 is pretty unlikely, if the probability of winning and losing are both equal to 0.5, then the probability of 9 consecutive losses is equal to 0.5^9 , there are approximately 0.2% of chance of having such large losing streak, note however that under a ranging market such case scenario could happen, but we will see later that the length of a losing streak is not the only problem.
Other Problems
Having a capital large enough to tank 9any number of consecutive losses is not the only thing one should focus on, as we have to take into account market prices and trading dynamics, that's where the ugly part start.
Our first problem is frictional costs, one example being the spread, but this is a common problem for any strategy, however here a martingale is extra sensitive to it, if the strategy does not account for it then we will still double our positions costs but we might not recover all the losses of a losing streak, instead we would be recovering only a proportion of it, under such scenario you would be certain to lose over time.
Another problem are gaps, market price might open under a stop-loss without triggering it, and this is a big no-no.
Equity of the strategy on AMD, in a desired scenario the equity at the second arrow should have been at a higher position than the equity at the first arrow.
In order for the strategy to be more effective, we would need to trade a market that does not close, such as the cryptocurrency market. Finally, we might be affected by slippage, altho only extreme values might drastically affect our balance.
The Anti Martingale
The strategy lets you use an anti-martingale, which double the position size after a win instead of a loss, the goal here is not to recover from a losing strike but instead to profit from a potential winning streak.
Here we are exposing your balance to exponential gross but you might also lose a trade at the end a winning streak, you will generally want to reinitialize your position size after a few wins instead of waiting for the end of a streak.
Alternative
You can use other-kind of progressions for position sizing, such as a linear one, increasing your position size by a constant number each time you lose. More gentle progressions will recover a proportion of your losses in a losing streak.
You can also simulate the effect of a martingale without doubling your position size by doubling your target profit, if for example you have a 10$ profit-target/stop-loss and lose a trade, you can use a 20$ profit target to recover from the lost trade + gain a profit of 10$. While this approach does not introduce exponential decay in your balance, you are betting on the market reaching your take profits, considering the fact that you are doubling their size you are expecting market volatility to increase drastically over time, as such this approach would not be extremely effective for high losing streak.
Conclusion
You will see a lot of auto-trading strategies that are based on a grid approach, they might even use a martingale. While the backtests will look appealing, you should think twice before using such kind of strategy, remember that frictional costs will be a huge challenge for the strategy, and that it assumes that the trader has an important initial capital. We have also seen that the risk/reward ratio is theoretically the worst you can have on a strategy, having a low reward and a high risk. This does not mean that progressive position sizing is bad, but it should not be pushed to the extreme.
It is nice to note that the martingale is originally a betting system designed for casino games, which unlike trading are not subject to frictional costs, but even casino players don't use it, so why would you?
Thx for reading

Combo Backtest 123 Reversal & Ergodic CSI This is combo strategies for get a cumulative signal.
First strategy
This System was created from the Book "How I Tripled My Money In The
Futures Market" by Ulf Jensen, Page 183. This is reverse type of strategies.
The strategy buys at market, if close price is higher than the previous close
during 2 days and the meaning of 9-days Stochastic Slow Oscillator is lower than 50.
The strategy sells at market, if close price is lower than the previous close price
during 2 days and the meaning of 9-days Stochastic Fast Oscillator is higher than 50.
Second strategy
This is one of the techniques described by William Blau in his book
"Momentum, Direction and Divergence" (1995). If you like to learn more,
we advise you to read this book. His book focuses on three key aspects
of trading: momentum, direction and divergence. Blau, who was an electrical
engineer before becoming a trader, thoroughly examines the relationship between
price and momentum in step-by-step examples. From this grounding, he then looks
at the deficiencies in other oscillators and introduces some innovative techniques,
including a fresh twist on Stochastics. On directional issues, he analyzes the
intricacies of ADX and offers a unique approach to help define trending and
non-trending periods.
This indicator plots Ergotic CSI and smoothed Ergotic CSI to filter out noise.
WARNING:
- For purpose educate only
- This script to change bars colors.
Custom Screener with Alerts [QuantNomad]Some time ago I published an example of simple custom screener in PineScript:
The only thing this screener did is created a dynamic label with screener output.
Recently TradingView announced alerts from the strategy with the possibility to add custom messages to alerts.
So using it I was able to create a bit more advanced screener which sends results as alert messages. With tools like Alertatron, you can easily redirect them to Telegram if you want.
It works for 40 symbols (limitation of the number of security calls).
To create your own screener you need to change only screenerFunc. The logic of this function is very simple, it outputs value you want to display in screener and condition based on which your screener should filter your stocks.
To create alerts for this screener create an alert from strategy and use {{strategy.order.alert_message}} as alert message.
Do you know now how to make this screener better? Let me know.
Disclaimer
Please remember that past performance may not be indicative of future results.
Due to various factors, including changing market conditions, the strategy may no longer perform as good as in historical backtesting.
This post and the script don’t provide any financial advice.
