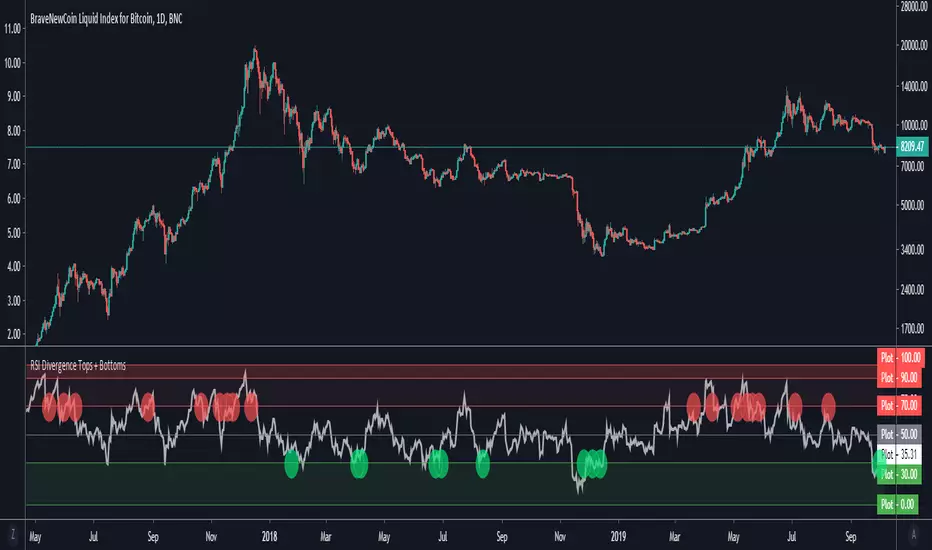
RSI Divergence Tops + BottomsRSI Indicator which plots local peaks and troughs in divergence.
Divergence is specified as:
- A higher price, with reduced RSI --> Potential Sell Point
- A lower price, with higher RSI --> Potential Buy Point
RSI Divergence should be used in combination with other indicators. This indicator identifies local tops and bottoms, with potential for macro trend shifts.
Read more about trading RSI Divergence on Investopedia here: www.investopedia.com
在腳本中搜尋"top"
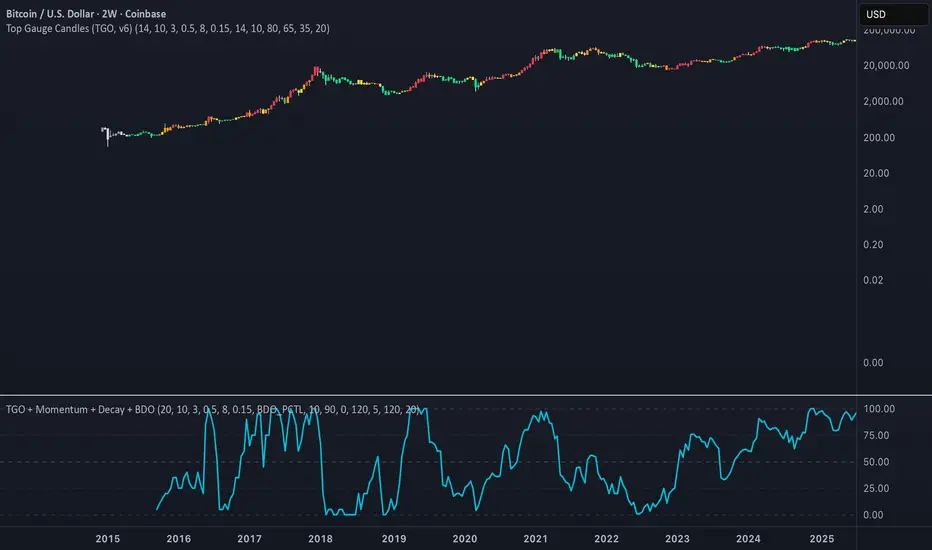
UPDATED Laguerre PPO PercentileRank Mkt Tops & BottomsUPDATED Laguerre PPO PercentileRank Market Tops & Bottoms squeezed into a line chart seems to be more precise

Top and Bottom Probability
The top and bottom probability oscillator is an educational indicator that estimates the probability of a local top or bottom using four ingredients:
price extension since the last RSI overbought/oversold,
time since that OB/OS event,
RSI divergence strength,
Directional Momentum Velocity (DMV) — a normalized, signed trend velocity.
It plots RSI, two probability histograms (Top %, Bottom %), and an optional 0–100 velocity gauge.
How to read it
RSI & Levels: Standard RSI with OB/OS lines (70/30 by default).
Prob Top (%): Red histogram, 0–100. Higher values suggest increasing risk of a local top after an RSI overbought anchor.
Prob Bottom (%): Green histogram, 0–100. Higher values suggest increasing chance of a local bottom after an RSI oversold anchor.
Velocity (0–100): Optional line. Above 50 = positive/upward DMV; below 50 = negative/downward DMV. DMV pushes Top risk when trending down and Bottom chance when trending up.
These are composite, scale-free scores, not certainties or trade signals.
What the probabilities consider
Price Delta: How far price has moved beyond the last OB (for tops) or below the last OS (for bottoms). More extension → higher probability.
Time Since OB/OS: Longer time since the anchor → higher probability (until capped by the “Time Normalization (bars)” input).
Oscillator Divergence: RSI pulling away from its last OB/OS reading in the opposite direction implies weakening momentum and increases probability.
Directional Momentum Velocity (DMV):
Computes a regression slope of hlc3 vs. bar index, normalized by ATR, then squashed with tanh.
Downward DMV boosts Top probability; upward DMV boosts Bottom probability.
Toggle the velocity plot and adjust its sensitivity with Velocity Lookback, ATR Length, and Velocity Gain.
All four terms are blended with user-set weights. If Normalize Weights is ON, weights are rescaled to sum to 1.
Inputs (most useful)
RSI Length / OB / OS: Core RSI setup.
Time Normalization (bars): Sets how quickly the “time since OB/OS” term ramps from 0→1.
Weights:
Price Delta, Time Since OB/OS, Osc Divergence, Directional Velocity.
Turn Normalize Weights ON to keep the blend consistent when you experiment.
Settings:
Velocity Lookback: Window for slope estimation (shorter = more reactive).
ATR Length: Normalizes slope so symbols/timeframes are comparable.
Velocity Gain: Steepens or softens the tanh curve (higher = punchier extremes).
Show Velocity (0–100): Toggles the DMV display.
Tip: If you prefer momentum measured on RSI rather than price, in the DMV block replace hlc3 with rsi (concept stays identical).
Practical tips
Use Top/Bottom % as context, not triggers. Combine with structure (S/R), trend filters, and risk management.
On strong trends, expect the opposite probability (e.g., Top % during an uptrend) to stay suppressed longer.
Calibrate weights: e.g., raise Osc Divergence on mean-reversion symbols; raise Velocity in trending markets.
For lower noise: lengthen Velocity Lookback and ATR Length, or reduce Velocity Gain.

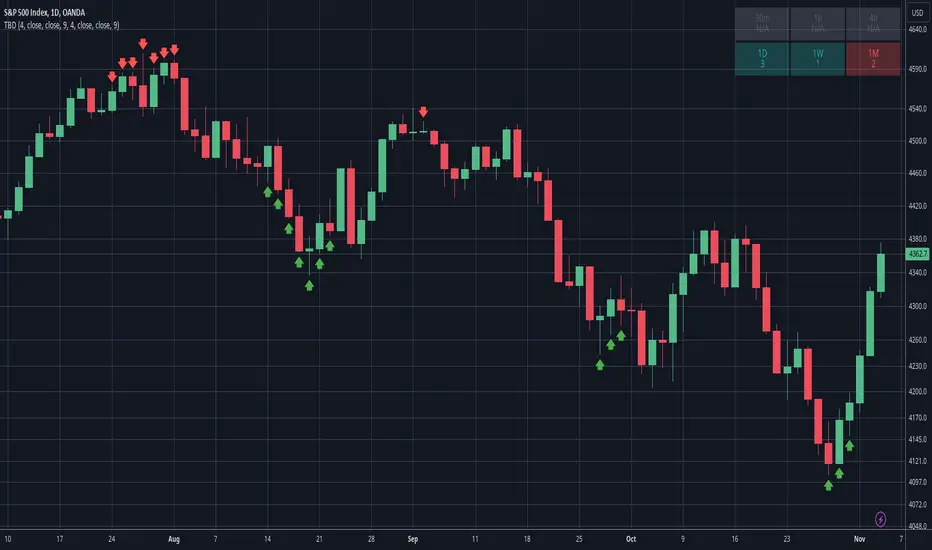
Top/Bottom DetectorThis indicator tries to detect tops and bottoms based on time and price. It counts candles using a simple criteria in both bullish and bearish directions. The count is added by 1 for each consecutive candle that matches this criteria. When a candle doesn't match the criteria the count is broken and will start over. A top or bottom is detected when the count reaches its maximum and is plotted on the chart as a red arrow (top) or a green arrow (bottom). Be aware that a top or bottom can be extended for several time periods and is broken only when the criteria no longer matches. Depending on your trading strategy, it can be advised to wait for the top/bottom to be broken before entering the trade.
How it works
The bullish count compares current candle with a candle X periods in the past. If the current candle price is higher than the past candle it matches and the count is added by 1. The bearish count works in the same way as the bullish count except that it matches if the current candle price is lower than the past candle instead of higher. The default parameters is to compare current candle close with the candle close 4 periods in the past, using a count of 9 as the maximum that detects a top or bottom. These values can all be adjusted in the settings.
Multi Timeframe Table
The multi timeframe table is visible by default in the top right corner. It gives some insight in what the count is for the current ticker in different timeframes. A bullish count will color the cell green and a bearish count red. Note that only timeframes higher or equal to what is used on the chart can be displayed. Any lower timeframes in the table will be grayed out and show the text N/A.
Alerts
Alerts can be setup when a bottom or top is detected. Using the "Any alert() function call" condition will alert both bottoms and tops.
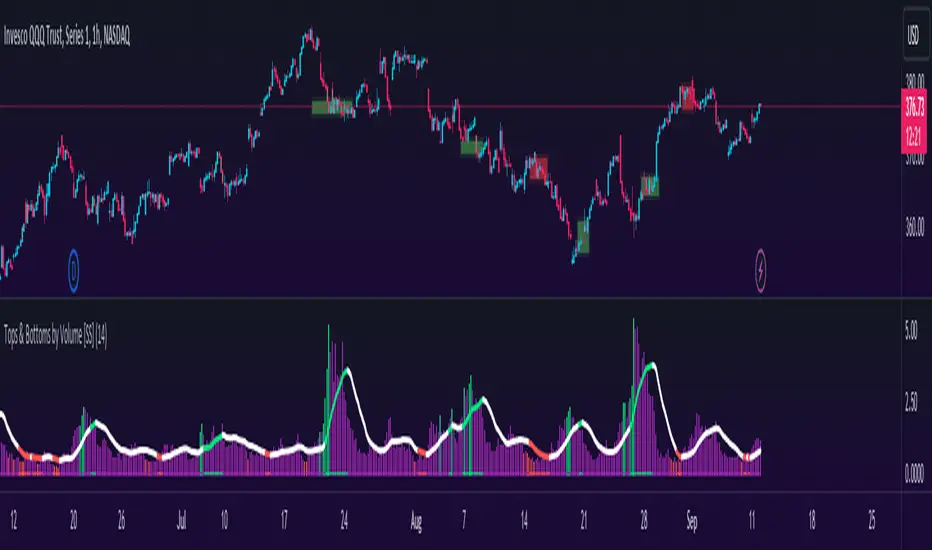
Tops & Bottoms by Volume [SS]Hey everyone,
Releasing this indicator that helps you time entries by alerting to potential tops and bottoms in the market.
Background to the indicator:
I was playing around with things that signalled reversals / tops and bottoms in SPSS and R using Pivot Points to mark tops and bottoms. Happened to come across a generally statistically significant relationship between sell to buy volume that was tracked over 10 to 50 candles back and pivot highs and pivot lows.
So I put it into a beta version of an indicator to see how it looked and was a bit surprised.
Since then, I have went back and narrowed down the details of what works/what doesn't work and this is the tentative result!
What it does / How to Use:
It tracks the cumulative buy vs sell volume. Buy volume is cumulated as close > open (or green candles) and sell is open > close (or red candles).
It then cumulates this over a user-defined period (defaulted to 14). It then looks back to see the highest vs lowest areas of sell and buy volume and makes determinations based on this relationship.
The relationship was determined by me using my own analysis and programmed into the indicators algorithm (using highest vs lowest function in pine).
It will plot areas of potential reversal to the upside as green on the histogram or red for a downside reversal. Once this becomes significant enough to signal an actual bottom or top, it will then change the SMA colour from white to green (for bottom) or red (for top).
Your entries generally should be once the SMA turns back to white. So from green to white, you would enter long or inverse for red to white (enter short).
Settings and Customizability:
Here are the key points to keep in mind if you are using this indicator:
Your lookback length should be between 10 to 50. I have left it open for you to modify it below and above this lookback period; however, this is the major periods deemed to be significant in identifying tops and bottoms. Thus, I advise against operating outside of those parameters.
You can toggle between smoothed look or historgram with SMA. The strength in this indicator comes from using the SMA and watching the SMA for signals of reversals, so if you want to filter out the background noise, you can simply look at the plotted SMA. If you want a more responsive indication of impending reversals, leave the smoothed option off and view the histogram in conjunction with the SMA.
The indicator will change the candle colour to red for bearish reversal and green to bullish reversal. This is based on the SMA. You can toggle this off and/or on as desired.
It is recommended to leave ETH (extended trading hours) turned off and RTH turned on.
Please read the instructions carefully.
If you require further assistance, I have posted a tutorial video.
Please be sure you are reading and/or watching carefully.
If you have questions, please feel free to post them below. But bear in mind I likely will not respond if it is already addressed in the description above (this happens often).
Also, feel free to leave your comments or suggestions below as well.
Thanks for checking this out. If you are interested in volume based trading, I suggest also checking out my Buyer to Seller volume indicator which cumulates total buying vs selling volume over a designated lookback period. Both of these used in conjunction are very powerful tools for volume based traders! ( Available here )
NOTE:
The boxes drawn in the chart are my own for demonstration purposes. I unfortunately cannot get the indicator to overlay the boxes on the chart in a separate viewing pane. That is why I opted to use the barcolor function to change the candle color instead :-).
Thanks again everyone and safe trades!
Top 40 High Low Strategy for SPY, 5minThis strategy is developed based on my High Low Index SPY Top 40 indicator
Notes:
- this strategy is only developed for SPY on the 5 min chart . It seems to work with QQQ as well, but it isn't optimized for it
- P/L shown is based on 10 SPY option contracts, call or put, with strike price closest to the entry SPY price and expiry of 0 to 1 day. This includes commissions (can be changed). This is only an estimate calculated using an arbitrary multiplier factor, this can be changed in the setting
- P/L is based on $5000 initial capital
- Works with both regular / extended trading session turned on/off. However, max drawdown is 1/2 with extended trading session ON
- there is still a bug that doesn't allow alert to be created due to calculation error, will update once fixed
This strategy combines signals from the following indicators to determine entry signals:
- High Low Index SPY Top 40
- MACD
- Linear Regression Slope
Entry signal is triggered when:
- High Low Index line crosses the EMA line
- MACD trending in the same direction
- Linear Regression slope is accelerating above a threshold in the same direction, indicating a strong trend
Profit target(PT) and stop loss(SL) are determined using ATR value, with 2:1 Reward to Risk ratio as default.
Exit signal may be triggered prior to PT or SL trigger when:
- High Low Index SPY Top 40 shows a reversal after overbought or oversold conditions (optional)
- Opposite entry signal is triggered
There are a number of optional settings:
- Turn on/off "option trading", P/L will be calculated using share price only without multiplication factor for trading option contracts
- # of options per trade, default to 10
- Reinvest with profit made
- Trade with trailing SL after PT hit
- Take profit early based on Top 40 overbought/oversold
- Trade 0/1 day expiry. This will signal exit by the end of the day on Mon/Wed/Fri, and only exits 1/2 of positions (if in profit) on Tues/Thurs
- Can reduce the SL level without impacting PT
- No entry between 10:05 - 10:20 (don't ask me why, but statistically it performs better)
Consider donating me some of your profit if you make $$$ hahaha~ ;)
Enjoy~~

Pro Trading Art - Top N Candle's Gainers/Losers(1-40)Top Gainer/Loser Screener.
Explanation :
With the help of this indicator you can filter top Gainer or Loser in comparison with previous selected range. Suppose you select 5 period inside input tab then this indicator will filter top gainer or losers in 5 days.
Input Parameter:
Timeframe: You can change timeframe of chart. Default timeframe is same as chart.
Period: To select range of candle. Default 5. Means how much price changed in previous 5 candle.
Top : Dropdown option to select top Gainer or Losers
Table Location: Where you want to place your table.
Watchlist Group: You can create watchlist for screener.

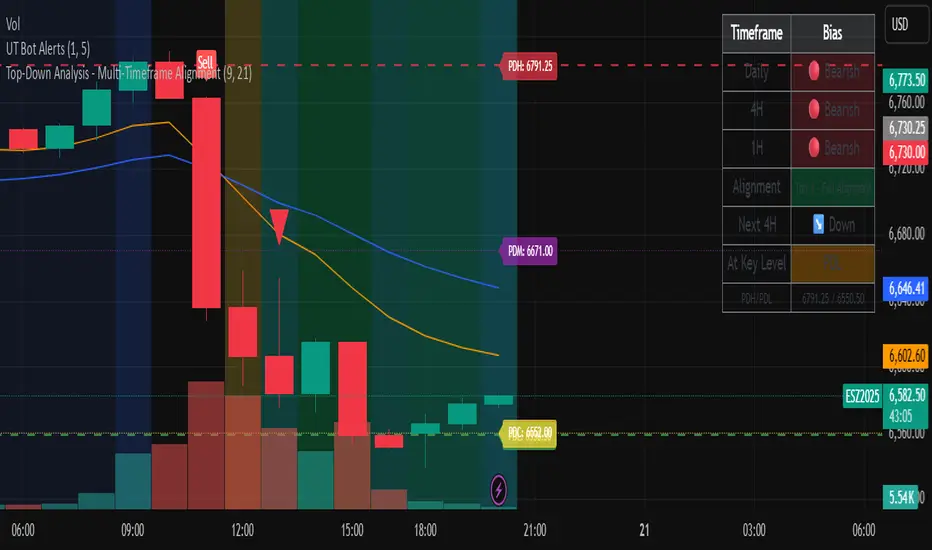
Top-Down Analysis - Multi-Timeframe AlignmentThis indicator implements a Top-Down Multi-Timeframe Trading Analysis System. Here's what it does:
Core Functionality
1. Multi-Timeframe Bias Detection
Monitors three timeframes: Daily, 4-Hour, and 1-Hour
Determines if each timeframe is bullish, bearish, or neutral based on two EMAs (9 and 21 period by default)
A timeframe is bullish when: Fast EMA > Slow EMA AND price is above Fast EMA
A timeframe is bearish when: Fast EMA < Slow EMA AND price is below Fast EMA
2. Alignment Tier System
Tier 1 (Full Alignment): All three timeframes agree (Daily = 4H = 1H direction)
Tier 2 (Partial Alignment): Daily and 1H agree, but 4H differs
No Alignment: Timeframes disagree
3. Previous Day Support & Resistance Levels
Automatically plots key levels from the previous day:
Previous Day High (PDH) - resistance
Previous Day Low (PDL) - support
Previous Day Close (PDC)
Previous Day Midpoint (PDM)
4. Execution Zone (15-Minute Window)
Highlights the first 15 minutes after each new 4H candle opens
This is the optimal entry window when alignment conditions are met
5. Pattern Recognition
Detects trading setups:
Double tops/bottoms
Long wicks at support/resistance
Bullish/bearish closes aligned with bias
6. Trade Signals
Generates entry signals when:
There's Tier 1 or Tier 2 alignment
Price is in the 15-minute execution zone
A valid pattern forms (double top/bottom or wick rejection)
7. Visual Dashboard
Shows a real-time table with:
Each timeframe's current bias
Alignment status
Next 4H prediction
Whether price is at a key support/resistance level
Trading Strategy
The indicator helps traders follow the principle of "trade with the higher timeframe trend" by only taking trades when multiple timeframes agree, focusing entries during specific windows, and respecting previous day's key price levels as potential reaction zones.
Top Crypto Above 28-Day AverageDescription
The “Top Crypto Above 28-Day Average” (CRYPTOTW) script scans a selectable universe of up to 120 top-capitalization cryptocurrencies (divided into customizable 40-symbol batches), then plots the count of those trading above their own 28-period simple moving average. It helps you gauge broad market strength and identify which tokens are showing momentum relative to their recent trend.
Key Features
• Batch Selection: Choose among “Top40,” “Mid40,” or “Low40” market-cap groups, or set a custom batch size (up to 40 symbols) to keep within the API limit.
• Dynamic Plot: Displays a live line chart of how many cryptos are above their 28-day MA on each bar.
• Reference Lines: Automatic horizontal lines at 25%, 50%, and 75% of your batch to provide quick visual thresholds.
• Background Coloration: The chart background shifts green/yellow/red based on whether more than 70%, 50–70%, or under 50% of the batch is above the MA.
• Optional Table: On the final bar, show a sortable table of up to 28 tickers currently above their 28-day MA, including current price, percent above MA, and “Above” status color-coding.
• Alerts:
• Strong Batch Performance: Fires when >70% of the batch is above the MA.
• Weak Batch Performance: Fires when <10 cryptos (i.e. <25%) are above the MA.
Inputs
• Show Results Table (show_table): Toggle the detailed table on/off.
• Table Position (table_position): Select one of the four corners for your table overlay.
• Max Cryptos to Display (max_display): Limit the number of rows in the results table.
• Current Batch (current_batch): Pick “Top40,” “Mid40,” or “Low40.”
• Batch Size (batch_size): Define the number of symbols (1–40) you want to include from the chosen batch.
How to Use
1. Add the CRYPTOTW indicator to any chart.
2. Select your batch and size to focus on the segment of the crypto market you follow.
3. Watch the plotted line to see the proportion of tokens with bullish momentum.
4. (Optional) Enable the results table to see exactly which tokens are outperforming their 28-day average.
5. Set alerts to be notified when the batch either overheats (strong performance) or cools off significantly.
Why It Matters
By tracking the share of assets riding their 28-day trend, you gain a macro-level view of market breadth—crucial for spotting emerging rallies or early signs of broad weakness. Whether you’re swing-trading individual altcoins or assessing overall market mood, this tool distills complex data into an intuitive, actionable signal.

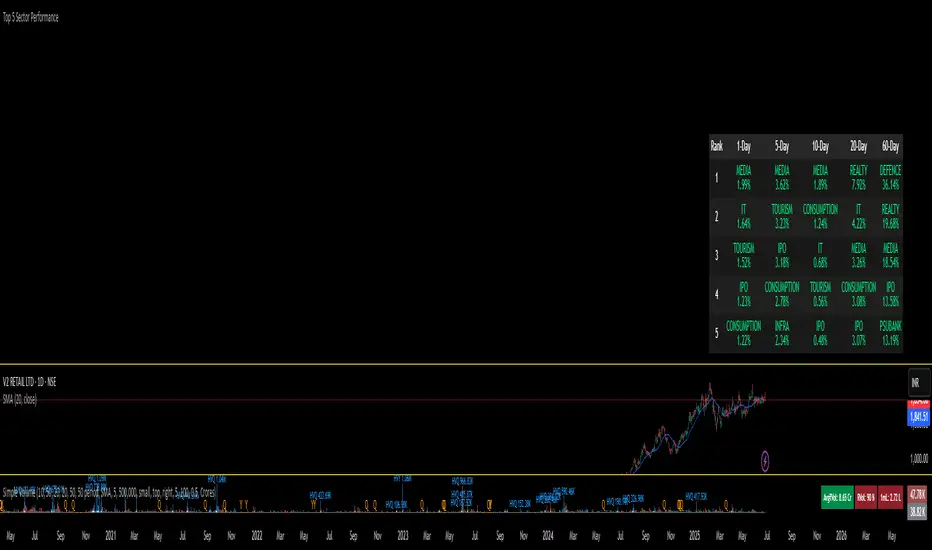
Top 5 Sector Performancehe indicator creates a table showing:
Top 5 performing sectors for 3 timeframes: 1-day, 10-day, and 20-day periods
Performance data including sector name and percentage change
Color-coded results: Green (positive), Red (negative), Gray ("N/A" for missing data)
Key Features
Table Structure:
Columns: Rank | 1-Day | 10-Day | 20-Day
Rows: Top 5 sectors for each timeframe
Header: Dark gray background with white text
Rows: Alternating dark gray shades for readability
[Top] Simple Position + SL CalculatorThis indicator is a user-friendly tool designed to help traders easily calculate optimal position sizing, determine suitable stop-loss levels, and quantify maximum potential losses in dollar terms based on their personalized trading parameters.
Key Features:
Position Size Calculation: Automatically computes the number of shares to purchase based on the trader’s total account size and specified percentage of the account allocated per trade.
Stop-Loss Level: Suggests an appropriate stop-loss price point calculated based on the trader’s defined risk percentage per trade.
Max Loss Visualization: Clearly displays the maximum potential loss (in dollars) should the stop-loss be triggered.
Customizable Interface: Provides the flexibility to place the calculation table in different chart positions (Top Left, Top Right, Bottom Left, Bottom Right) according to user preference.
How to Use:
Enter your total Account Size.
Set the desired Position Size as a percentage of your account. (Typically, 1%–5% per trade is recommended for cash accounts.)
Define the Risk per Trade percentage (commonly between 0.05%–0.5%).
Choose your preferred Table Position to comfortably integrate with your trading chart.
Note:
If you identify a technical support level below the suggested stop-loss point, consider reducing your position size to manage the increased risk effectively.
Keep in mind that the calculations provided by this indicator are based solely on standard industry best practices and the specific inputs entered by you. They do not account for market volatility, news events, or any other factors outside the provided parameters. Always complement this indicator with sound technical and fundamental analysis.

Top-Down Trend and Key Levels with Swing Points//by antaryaami0
Overview
The “Top-Down Trend and Key Levels with Swing Points” indicator is a comprehensive tool designed to enhance your technical analysis by integrating multiple trading concepts into a single, easy-to-use script. It combines higher timeframe trend analysis, key price levels, swing point detection, and ranging market identification to provide a holistic view of market conditions. This indicator is particularly useful for traders who employ multi-timeframe analysis, support and resistance levels, and price action strategies.
Key Features
1. Higher Timeframe Trend Background Shading:
• Purpose: Identifies the prevailing trend on a higher timeframe to align lower timeframe trading decisions with the broader market direction.
• How it Works: The indicator compares the current higher timeframe close with the previous one to determine if the trend is up, down, or ranging.
• Customization:
• Trend Timeframe: Set your preferred higher timeframe (e.g., Daily, Weekly).
• Up Trend Color & Down Trend Color: Customize the background colors for uptrends and downtrends.
• Ranging Market Color: A separate color to indicate when the market is moving sideways.
2. Key Price Levels:
• Previous Day High (PDH) and Low (PDL):
• Purpose: Identifies key support and resistance levels from the previous trading day.
• Visualization: Plots horizontal lines at PDH and PDL with labels.
• Customization: Option to show or hide these levels and customize their colors.
• Pre-Market High (PMH) and Low (PML):
• Purpose: Highlights the price range during the pre-market session, which can indicate potential breakout levels.
• Visualization: Plots horizontal lines at PMH and PML with labels.
• Customization: Option to show or hide these levels and customize their colors.
3. First 5-Minute Marker (F5H/F5L):
• Purpose: Marks the high or low of the first 5 minutes after the market opens, which is significant for intraday momentum.
• How it Works:
• If the first 5-minute high is above the Pre-Market High (PMH), an “F5H” label is placed at the first 5-minute high.
• If the first 5-minute high is below the PMH, an “F5L” label is placed at the first 5-minute low.
• Visualization: Labels are placed at the 9:35 AM candle (closing of the first 5 minutes), colored in purple by default.
• Customization: Option to show or hide the marker and adjust the marker color.
4. Swing Points Detection:
• Purpose: Identifies significant pivot points in price action to help recognize trends and reversals.
• How it Works: Uses left and right bars to detect pivot highs and lows, then determines if they are Higher Highs (HH), Lower Highs (LH), Higher Lows (HL), or Lower Lows (LL).
• Visualization: Plots small markers (circles) with labels (HH, LH, HL, LL) at the corresponding swing points.
• Customization: Adjust the number of left and right bars for pivot detection and the size of the markers.
5. Ranging Market Detection:
• Purpose: Identifies periods when the market is consolidating (moving sideways) within a defined price range.
• How it Works: Calculates the highest high and lowest low over a specified period and determines if the price range is within a set percentage threshold.
• Visualization: Draws a gray box around the price action during the ranging period and labels the high and low prices at the end of the range.
• Customization: Adjust the range detection period and threshold, as well as the box color.
6. Trend Coloring on Chart:
• Purpose: Provides a visual cue for the short-term trend based on a moving average.
• How it Works: Colors the candles green if the price is above the moving average and red if below.
• Customization: Set the moving average length and customize the uptrend and downtrend colors.
How to Use the Indicator
1. Adding the Indicator to Your Chart:
• Copy the Pine Script code provided and paste it into the Pine Script Editor on TradingView.
• Click “Add to Chart” to apply the indicator.
2. Configuring Inputs and Settings:
• Access Inputs:
• Click on the gear icon next to the indicator’s name on your chart to open the settings.
• Customize Key Levels:
• Show Pre-Market High/Low: Toggle on/off.
• Show Previous Day High/Low: Toggle on/off.
• Show First 5-Minute Marker: Toggle on/off.
• Set Trend Parameters:
• Trend Timeframe for Background: Choose the higher timeframe for trend analysis.
• Moving Average Length for Bar Color: Set the period for the moving average used in bar coloring.
• Adjust Ranging Market Detection:
• Range Detection Period: Specify the number of bars to consider for range detection.
• Range Threshold (%): Set the maximum percentage range for the market to be considered ranging.
• Customize Visuals:
• Colors: Adjust colors for trends, levels, markers, and ranging market boxes.
• Label Font Size: Choose the size of labels displayed on the chart.
• Level Line Width: Set the thickness of the lines for key levels.
3. Interpreting the Indicator:
• Background Shading:
• Green Shade: Higher timeframe is in an uptrend.
• Red Shade: Higher timeframe is in a downtrend.
• Gray Box: Market is ranging (sideways movement).
• Key Levels and Markers:
• PDH and PDL Lines: Represent resistance and support from the previous day.
• PMH and PML Lines: Indicate potential breakout levels based on pre-market activity.
• F5H/F5L Labels: Early indication of intraday momentum after market open.
• Swing Point Markers:
• HH (Higher High): Suggests bullish momentum.
• LH (Lower High): May indicate a potential bearish reversal.
• HL (Higher Low): Supports bullish continuation.
• LL (Lower Low): Indicates bearish momentum.
• Ranging Market Box:
• Gray Box Around Price Action: Highlights consolidation periods where breakouts may occur.
• Range High and Low Labels: Provide the upper and lower bounds of the consolidation zone.
4. Applying the Indicator to Your Trading Strategy:
• Trend Alignment:
• Use the higher timeframe trend shading to align your trades with the broader market direction.
• Key Levels Trading:
• Watch for price reactions at PDH, PDL, PMH, and PML for potential entry and exit points.
• Swing Points Analysis:
• Identify trend continuations or reversals by observing the sequence of HH, HL, LH, and LL.
• Ranging Market Strategies:
• During ranging periods, consider range-bound trading strategies or prepare for breakout trades when the price exits the range.
• Intraday Momentum:
• Use the F5H/F5L marker to gauge early market sentiment and potential intraday trends.
Practical Tips
• Adjust Settings to Your Trading Style:
• Tailor the indicator’s inputs to match your preferred timeframes and trading instruments.
• Combine with Other Indicators:
• Use in conjunction with volume indicators, oscillators, or other technical tools for additional confirmation.
• Backtesting:
• Apply the indicator to historical data to observe how it performs and refine your settings accordingly.
• Stay Updated on Market Conditions:
• Be aware of news events or economic releases that may impact market behavior and the effectiveness of technical levels.
Customization Options
• Time Zone Adjustment:
• The script uses “America/New_York” time zone by default. Adjust the timezone variable in the script if your chart operates in a different time zone.
var timezone = "Your/Timezone"
• Session Times:
• Modify the Regular Trading Session and Pre-Market Session times in the indicator settings to align with the trading hours of different markets or exchanges.
• Visual Preferences:
• Colors: Personalize the indicator’s colors to suit your visual preferences or to enhance visibility.
• Label Sizes: Adjust label sizes if you find them too intrusive or not prominent enough.
• Marker Sizes: Further reduce or enlarge the swing point markers by modifying the swing_marker_size variable.
Understanding the Indicator’s Logic
1. Higher Timeframe Trend Analysis:
• The indicator retrieves the closing prices of a higher timeframe using the request.security() function.
• It compares the current higher timeframe close with the previous one to determine the trend direction.
2. Key Level Calculation:
• Previous Day High/Low: Calculated by tracking the highest and lowest prices of the previous trading day.
• Pre-Market High/Low: Calculated by monitoring price action during the pre-market session.
3. First 5-Minute Marker Logic:
• At 9:35 AM (end of the first 5 minutes after market open), the indicator evaluates whether the first 5-minute high is above or below the PMH.
• It then places the appropriate label (F5H or F5L) on the chart.
4. Swing Points Detection:
• The script uses ta.pivothigh() and ta.pivotlow() functions to detect pivot points.
• It then determines the type of swing point based on comparisons with previous swings.
5. Ranging Market Detection:
• The indicator looks back over a specified number of bars to find the highest high and lowest low.
• It calculates the percentage difference between these two points.
• If the difference is below the set threshold, the market is considered to be ranging, and a box is drawn around the price action.
Limitations and Considerations
• Indicator Limitations:
• Maximum Boxes and Labels: Due to Pine Script limitations, there is a maximum number of boxes and labels that can be displayed simultaneously.
• Performance Impact: Adding multiple visual elements (boxes, labels, markers) can affect the performance of the script on lower-end devices or with large amounts of data.
• Market Conditions:
• False Signals: Like any technical tool, the indicator may produce false signals, especially during volatile or erratic market conditions.
• Not a Standalone Solution: This indicator should be used as part of a comprehensive trading strategy, including risk management and other forms of analysis.
Conclusion
The “Top-Down Trend and Key Levels with Swing Points” indicator is a versatile tool that integrates essential aspects of technical analysis into one script. By providing insights into higher timeframe trends, highlighting key price levels, detecting swing points, and identifying ranging markets, it equips traders with valuable information to make more informed trading decisions. Whether you are a day trader looking for intraday opportunities or a swing trader aiming to align with the broader trend, this indicator can enhance your chart analysis and trading strategy.
Disclaimer
Trading involves significant risk, and it’s important to understand that past performance is not indicative of future results. This indicator is a tool to assist in analysis and should not be solely relied upon for making trading decisions. Always conduct thorough research and consider seeking advice from financial professionals before engaging in trading activities.

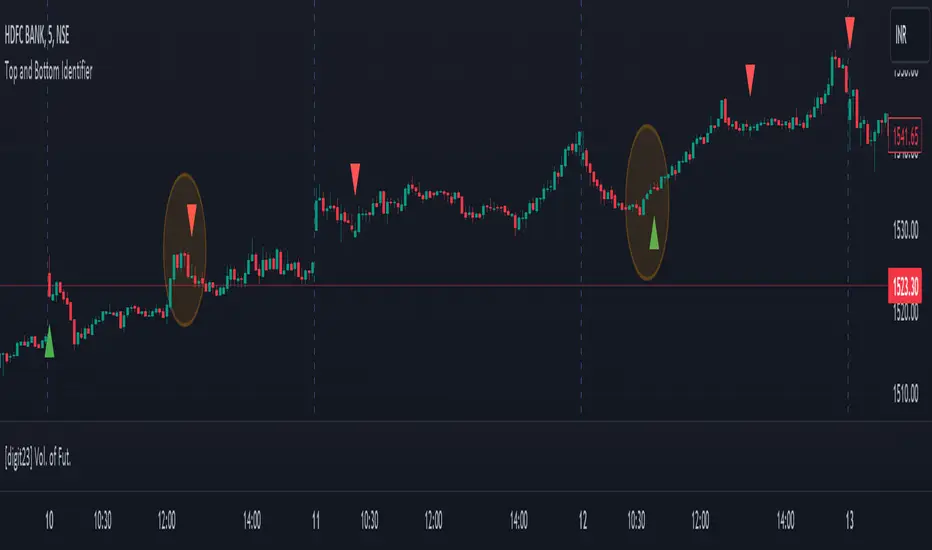
Top and Bottom Identifier [digit23]This indicator is designed to identify potential market tops and bottoms based on customizable conditions. It employs price action analysis, considering candlestick patterns, body size, and recent price history. Traders can adjust parameters like the threshold multiplier and body size multiplier to fine-tune sensitivity.
Features:
Identifies potential tops and bottoms.
Customizable threshold and body size multipliers.
Utilizes price action analysis exclusively.
User-friendly and visually represented on the chart.
Usage:
Red Triangles: Indicate potential market tops.
Green Triangles: Indicate potential market bottoms.
Parameters:
Threshold Multiplier: Adjusts sensitivity.
Body Size Multiplier: Controls the significance of candlestick body size.
Note:
This indicator is for traders preferring price action analysis to identify potential reversals. It's recommended to use alongside other technical analysis tools for comprehensive trading decisions.
Disclaimer:
Trading involves risk; thorough analysis is crucial before making decisions. This indicator is a tool for technical analysis and should be part of a broader trading strategy.
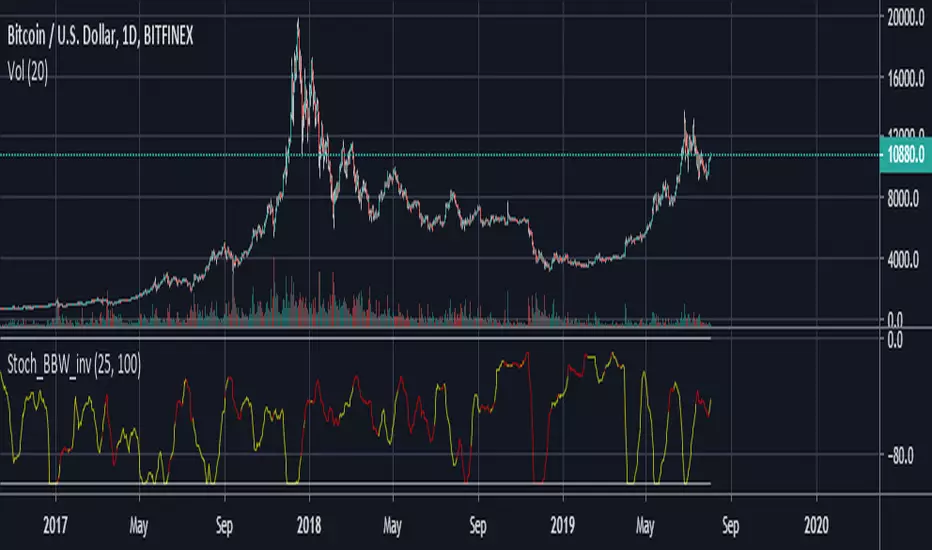
Stoch_BBW_invTop signal: reaches -100 when the color is yellow
Bottom signal: reaches -100 when the color is red
This script calculate a stochastic oscillator of BBW, and defines a top and a bottom as its highest in N bars.
Top 5 coins cummulated Upvol/Dnvol and Money FlowThis script reads price and volume information for the top 5 coins (on 9 exchanges, a total of 29 pairs), calculates the cummulative upvolume and downvolume according to the Money Flow (MFI) formula, and shows upvolume and downvolume separately on the chart as a green and a red line.
The coins used are BTC, ETH, LTC, XRP and EOS. They are the top 5 coins by daily volume, as of 24th of February 2019.
Because of the many security() calls needed, the script is VERY slow, so have lots of patience.
I find it useful as a broad crypto market indicator - for example to compare the current pump with the pumps in the past.
Can also calculate the aggregated Money Flow (MFI) if you check that option in the indicator's configuration. Make sure to wait for recalculation and rescale the chart afterwards - MFI has a value from 0 to 100 and you may need to zoom in.

Top 10 Bullish Wedge ScannerThe script does a check of all stocks and gives the top 10 list of stocks with bullish wedge formed on daily timeframe.

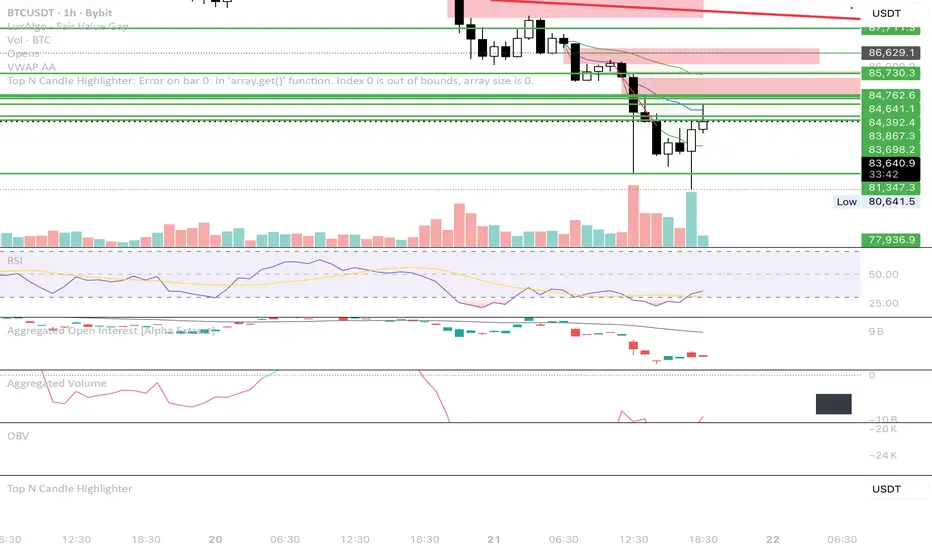
Top N Candle HighlighterTrack highest candle sizes on current timeframes. This short script:
1. Tracks the **top N largest candles** on the current chart
2. Option to use **body size** or **full candle range**
3. Highlights candles using `box.new()` (fully v6 compatible)
4. Optionally shows **rank and size labels**
5. Handles red, green, and doji candles differently with color
Top-line % MovesOverview
A clean, text-only overlay that shows price momentum at a glance. It prints one line at the top-center of your chart:
Movement | Day % | 3-Day % | Wk %
What it shows
Day - Percent change from today’s regular-session open to the latest price
3-Day - Percent change from the daily open 3 trading days ago
Wk - Percent change from the daily open 5 trading days ago
How it works
Pulls daily opens via request.security so it stays consistent across intraday and daily timeframes
Calculates percent moves versus those opens and renders a single centered text line
Transparent background, bright white text, no bars or lines, minimal chart footprint
Notes
“Wk” uses 5 trading days. If you prefer 7 calendar days, change the lookback to your preference
Daily opens follow the symbol’s TradingView session settings. Extended or 24h markets may differ from your broker’s definition of “open”
Best for
Quick momentum read without clutter
Screeners, streaming layouts, and compact dashboards
Inputs
None
Tags
percent change, overlay, momentum, daily open, intraday, text display, minimal, Pine v6

Top Right Watermark# TopRight Watermark
**Finally, a watermark that stays out of your way!**
Tired of TradingView's default watermark blocking your price action and technical analysis? This customizable watermark indicator gives you complete control over positioning and content display.
## 🎯 Key Features
**✅ Flexible Positioning** - Place anywhere: corners, sides, or edges
**✅ Multi-Slot Display** - Up to 3 customizable information slots
**✅ Individual Font Control** - Different sizes for each slot
**✅ Platform Compatibility** - TradingView OR MetaTrader timeframe formats
**✅ Clean & Professional** - Customizable colors and transparency
## 🔧 What You Can Display
- **Timeframe** - Current chart period
- **Ticker** - Symbol name (smart formatting for crypto/forex)
- **Exchange** - Broker/platform name
- **Custom Text** - Your own message
- **Empty** - Hide unused slots
## 🎨 Customization Options
- **Position**: 9 placement options (top/middle/bottom + left/center/right)
- **Colors**: Full color picker with transparency control
- **Font Sizes**: 5 sizes available per slot (tiny to huge)
- **Timeframe Style**: Choose TradingView (1m, 4H) or MetaTrader (M1, H4) format
## 🚀 Perfect For
- Traders who need clean chart visibility
- Multi-timeframe analysis
- Professional chart screenshots
- Platform migrants (MT4/MT5 to TradingView)
- Anyone wanting organized chart information
## 💡 Pro Tips
- Place in corners to avoid price action interference
- Combine Exchange + Ticker + Timeframe for complete context
- Use transparency to make it subtle but visible
**Stop letting watermarks interfere with your trading analysis. Take control of your chart display today!**
---
*Compatible with all TradingView chart types and timeframes. Easy setup with intuitive controls.*

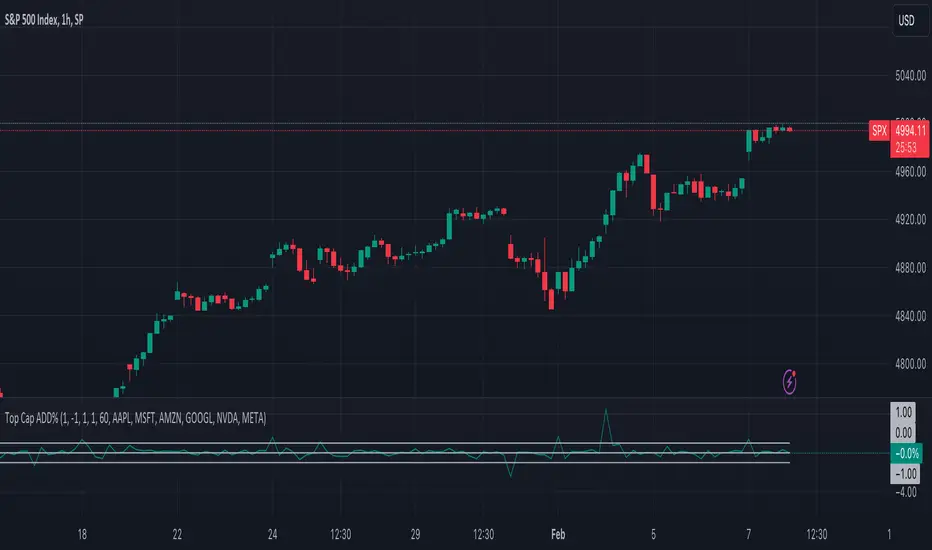
Top Cap ADD%This is a very basic oscillator that plots the average % change of the top 5 highest market cap stocks in the S&P500. It can be easily modified to suit your needs on which stocks you'd like to track, and or filter out the threshold you're looking for.
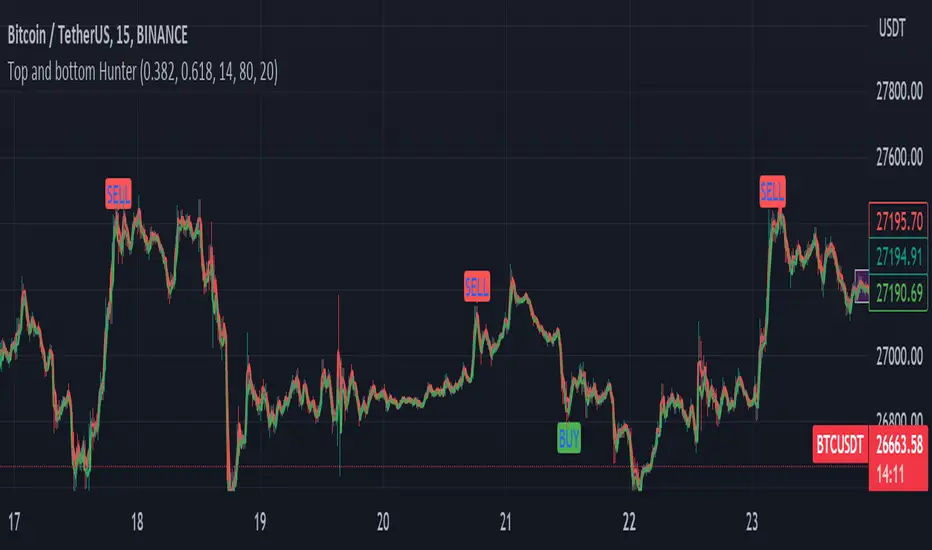
Fib top and bottom Hunter - No Repaint "Top and bottom Hunter" indicator combines two popular technical analysis tools, Fibonacci retracement levels and the Relative Strength Index (RSI), to identify potential trading opportunities in the market.
Fibonacci retracement levels are based on the Fibonacci sequence, a mathematical series where each number is the sum of the two preceding ones. In trading, Fibonacci retracement levels are used to identify potential support and resistance levels based on the recent price action. The indicator uses two Fibonacci levels, fib_0 and fib_1, which are typically set to 0.382 and 0.618, respectively. These levels represent common retracement ratios.
To calculate the Fibonacci levels, the indicator considers the highest and lowest prices within a specified range, typically the highest and lowest of the last two bars. It calculates the fib_range, which is the difference between the highest and lowest prices. Then, fib_level_0 and fib_level_1 are determined by subtracting the Fibonacci ratios from the highest price.
The RSI is a momentum oscillator that measures the speed and change of price movements. It helps identify overbought and oversold conditions in the market. The RSI parameters used in this indicator are rsi_length (length of the RSI calculation), rsi_overbought (upper threshold indicating overbought conditions), and rsi_oversold (lower threshold indicating oversold conditions). The RSI value is calculated based on the closing prices.
The indicator generates buy and sell signals based on specific conditions:
Buy Condition: A buy signal is triggered when the RSI crosses above the oversold level (rsi_oversold) and the closing price is higher than fib_level_1. This indicates a potential reversal or bounce from the Fibonacci support level.
Sell Condition: A sell signal is triggered when the RSI crosses below the overbought level (rsi_overbought) and the closing price is lower than fib_level_0. This suggests a potential reversal or pullback from the Fibonacci resistance level.
In summary, this indicator combines the power of Fibonacci retracement levels and the RSI to identify potential trading opportunities. It helps traders find confluence between the Fibonacci support or resistance levels and the RSI readings, indicating potential trend reversals or bounces. Traders can use this information to make informed decisions about entering or exiting positions in the market.
Feel free to change the settings for what works best for you and use this with other confluences. I personally use RSI overbought and oversold values as 80 and 20
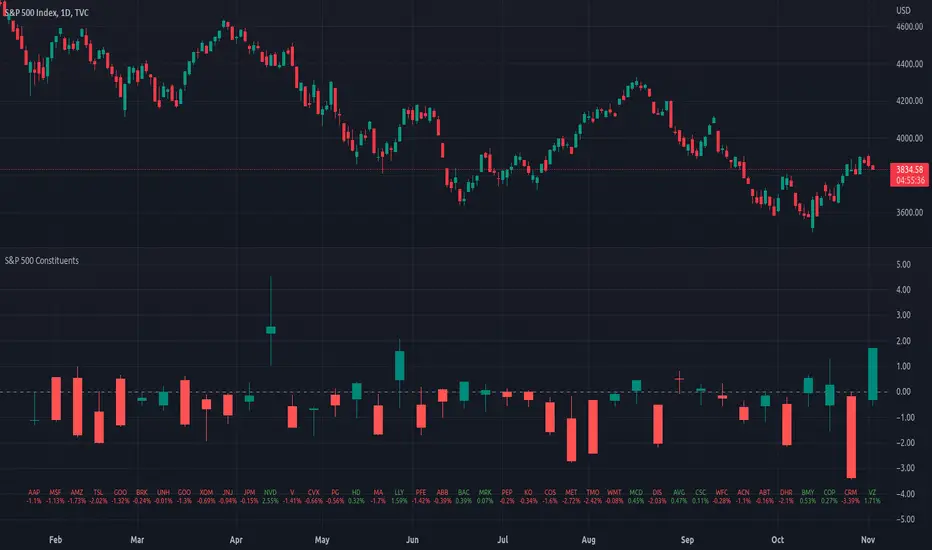
Top 40 constituents of S&P 500 IndexDisplays real-time candles of top 40 constituents of S&P 500 Index ( TVC:SPX ) for a given time frame, side-by-side. This gives an overall idea of breadth and depth of market movements in the time-frame.
Please note that, this is not a standard chart rendered bar-wise and may take time to load as it requests multiple securities. You could modify the contents, from settings, to include stocks from your portfolio or indices of different sectors.