Today's Daily LevelsTrack daily price action like a pro with instant visibility of key levels, percentages, and P&L values - all in one clean view.
• Shows Daily Open, High, Low & Median levels
• Dynamic color-coding: green above open, red below
• Real-time price labels with:
Exact price levels
% distance between levels
Point values
Dollar values per contract
• Auto-repaints on timeframe changes
• 30min alerts for median crosses
在腳本中搜尋"track"

Daily Price LevelsTrack daily price action like a pro with instant visibility of key levels, percentages, and P&L values - all in one clean view."
Bullet points:
• Shows Daily Open, High, Low & Median levels
• Dynamic color-coding: green above open, red below
• Real-time price labels with:
Exact price levels
% distance between levels
Point values
Dollar values per contract
• Auto-repaints on timeframe changes
• 30min alerts for median crosses

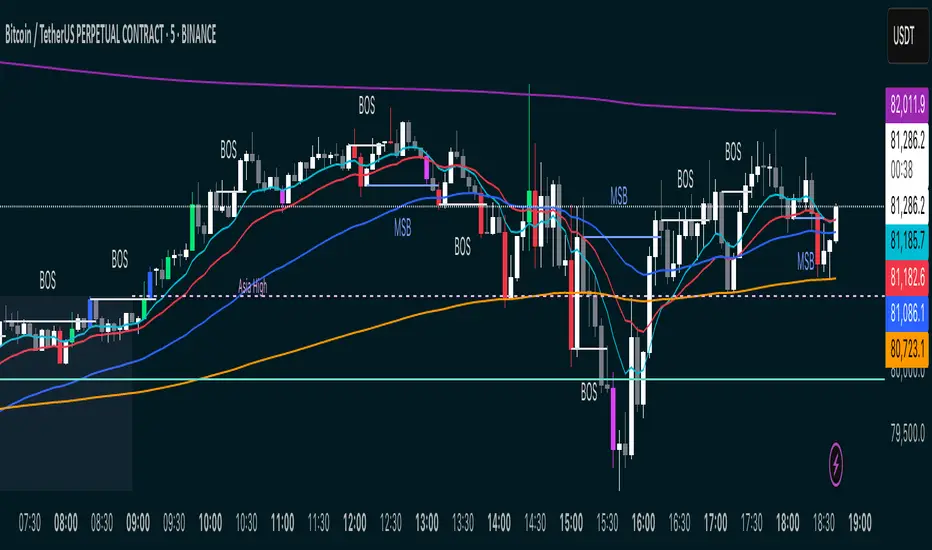
MSB BOS Market Structure [FTB]Track Market Structure Breaks (MSB) and Breaks of Structure (BOS) on your charts. This indicator does exactly that without clutter and with easy-to-spot.
🔑 Features:
MSB (Market Structure Break): Shows when price flips and breaks the previous high/low — possible start of a new trend.
BOS (Break of Structure): Highlights key structural breakouts in line with the existing trend.
✅ Pivot-Based Analysis (Body Focused)
Uses candle body-based pivot highs and lows to find clean market structure points (no wicks confusion here!).
Adjustable pivot strength — control how many candles you want on either side to define a swing.
✅ Clean Visual Markings
MSB and BOS lines with optional labels so you see exactly where breaks happen.
Customizable line style (Solid, Dashed, Dotted) to match your chart aesthetic.
Optional pivot markers to show minor swing highs/lows.
✅ Alerts Ready
Set alerts for any MSB or BOS, or filter to specific bullish/bearish breaks — never miss a key level again
💡 How to Use This Indicator:
Identify Trend Shifts: Use MSB to spot early trend reversals — when a previous structure breaks against the trend.
Catch Continuations: Watch for BOS to confirm trend continuation — great for riding the trend!
⚙️ Settings You Can Adjust:
Pivot Strength: How many candles to look back and forward for swing points (default: 3).
Show Pivots: Optional — highlight swing highs and lows for extra clarity.
Federal Funds Rate Projections [tedtalksmacro]Track the Federal Funds Rate projections for each month via the Fed Funds Rate Futures Contracts CBOT:ZQ1!
This will be updated monthly to ensure that the current and relevant contracts are implemented.
Traders can use this to speculate on whether the Federal Reserve is likely to raise, cut or do nothing to their key interest rate at the next meeting.

FANG INDICATORTrack the strength of any group of stocks that are driving markets. This defaults to FANG. In the settings, replace the symbols to better fit the environment such as replacing NFLX with AAPL.

Multi Timeframe Rolling Bitmex Liquidation LevelsTrack Bitmex liquidations levels in real-time with a rolling VWMA or VWAP basis.
Allows the input of a different time frame if you wish.

200/100 vs 190/80 EMA [jarederaj]Track the 200/100 EMA cross Vs the 180/90 EMA cross. Also, see the dates when these periods start on the chart.
Consecutive Highs/LowsTrack consecutive new highs/lows outside the Donchian range. Fans of the oldschool Turtle Strategy should enjoy the visualization.
Same logic as my "Walking the Bands" script, just with Donchian breaks instead of Bollinger tags.


Altcoin PortfolioTrack your altcoin portfolio balance in Fiat currency.
Make sure to open the data window to the right of your charts, it makes everything alot easier to read at a glance.
To learn more about customizing this script to fit your portfolio, watch the video here: youtu.be
To get more cool scripts and up-to-date information about Autoview, join us in slack slack.with.pink
As per the usual, we hope this script helps with your trading venture.
Good luck, and happy trading.

Mawhoob (OBs & FVGs) - v1.1Mawhoob (OBs & FVGs) - v1.1
Professional Market Structure Indicator
----------------------------------------------------
🎯 Overview
----------------------------------------------------
Mawhoob (OBs & FVGs) - v1.1 is a comprehensive technical analysis indicator designed to identify and track two of the most powerful concepts in modern price action trading: Order Blocks (OBs) and Fair Value Gaps (FVGs). This indicator provides traders with automated detection, visualization, and real-time alerts for these key market structure elements, helping you identify high-probability trading zones and potential reversal areas.
----------------------------------------------------
🔍 What Are Order Blocks and Fair Value Gaps?
----------------------------------------------------
✅ Order Blocks (OBs)
Order Blocks represent areas where institutional players have placed significant orders, creating imbalances in supply and demand. These zones often act as strong support or resistance levels where price tends to react when revisited.
* Bullish Order Block (OB+): Forms when a bearish candle is immediately followed by a strong bullish candle that closes above the previous candle's high, indicating institutional buying interest.
* Bearish Order Block (OB-): Forms when a bullish candle is immediately followed by a strong bearish candle that closes below the previous candle's low, indicating institutional selling pressure.
✅ Fair Value Gaps (FVGs)
Fair Value Gaps are price inefficiencies that occur when the market moves too quickly, leaving unfilled price ranges. These gaps often get "filled" or "mitigated" as price returns to seek liquidity and balance.
* Bullish Fair Value Gap (FVG+): Forms when there's a gap between the high of two candles ago and the low of the current candle in an upward move.
* Bearish Fair Value Gap (FVG-): Forms when there's a gap between the low of two candles ago and the high of the current candle in a downward move.
----------------------------------------------------
✨ Key Features ✨
----------------------------------------------------
✅ Order Blocks (OBs) Module:
Detection & Visualization
Automatic OB Detection: Identifies both bullish and bearish order blocks in real-time.
Customizable Display: Show up to 50 order blocks simultaneously.
Visual Distinction: Separate color schemes for bullish and bearish order blocks.
Smart Labeling: Optional OB+/OB- labels for easy identification.
Advanced Filtering Options
Strong OBs Filter: Option to display only "super/strong" order blocks.
FVG Confirmation Filter: Show only order blocks that are immediately followed by fair value gaps for higher confluence.
Flexible Filtering: Use filters independently or combine them for maximum selectivity
Mitigation Tracking
Real-time Monitoring: Automatically tracks when order blocks are "filled" or mitigated by price.
Display Control: Choose whether to show or hide filled order blocks.
Customization Options
Color Settings: Fully customizable colors for bullish/bearish order block zones.
Transparency Control: Adjustable box background transparency.
Border Styles: Choose between Solid, Dashed, or Dotted borders.
Extension Options: Extend boxes to the right or stop at mitigation point.
Label Size: Select from Auto, Tiny, Small, Normal, or Large label sizes.
✅ Fair Value Gaps (FVGs) Module:
Detection & Visualization
Automatic FVG Detection: Identifies both bullish and bearish fair value gaps.
Customizable Display: Show up to 50 FVGs simultaneously.
Visual Distinction: Separate color schemes for bullish and bearish gaps.
Smart Labeling: Optional FVG+/FVG- labels for clarity.
Advanced Filtering Options
Strong FVGs Filter: Display only significant gaps formed by strong candles.
OB Confirmation Filter: Show only FVGs that follow order blocks for enhanced reliability.
Independent Settings: Completely separate filtering from order block module.
Mitigation Tracking
Gap Fill Detection: Automatically detects when price fills the fair value gap.
Visual Updates: Filled gaps change appearance to indicate completion.
Display Options: Control visibility of filled versus unfilled gaps.
Customization Options
Full Color Control: Independent color settings for bullish/bearish FVGs.
Transparency Management: Adjustable transparency levels.
Border Customization: Multiple border style options.
Extension Control: Choose how gaps extend on the chart.
Label Customization: Adjustable label sizes and colors.
----------------------------------------------------
🔔 Alerts & Signals
----------------------------------------------------
Alerts System
Real-time Notifications: Receive instant alerts when new OBs or FVGs are detected.
Separate Alert Channels: Independent alerts for order blocks and fair value gaps.
Price Information: Each alert includes the current price level.
Frequency Control: Alerts trigger once per bar to avoid spam.
Visual Signals
On-Chart Markers: Optional visual signals (circles/diamonds) at detection points.
Color-Coded: Bullish signals below bars, bearish signals above bars.
Toggle Control: Enable/disable signals independently from alerts.
----------------------------------------------------
📋 How to Use This Indicator?
----------------------------------------------------
For Trend Following
Look for Bullish OBs and FVGs in uptrends as potential entry zones.
Look for Bearish OBs and FVGs in downtrends as potential entry zones.
Use unmitigated zones as key support/resistance levels.
For Reversal Trading
Watch for price reactions when approaching order blocks.
Combine multiple timeframe analysis for higher probability setups.
Use the "Strong" filters to focus on the most significant zones.
For Confluence Trading
Enable "Show Only (OBs) that Followed by (FVGs)" filter.
Enable "Show Only (FVGs) that Follow (OBs)" filter.
Trade only when both structures align for maximum confluence.
Risk Management
Monitor when zones become mitigated (filled).
Use multiple timeframes to identify nested zones.
Combine with your existing trading strategy for confirmation.
----------------------------------------------------
⚙️ Recommended Settings
----------------------------------------------------
For Scalping (1m - 5m timeframes)
Display: 15-20 boxes.
Enable: Strong filters.
Disable: Show mitigated zones.
For Day Trading (15m - 1H timeframes)
Display: 20-30 boxes.
Enable: Confluence filters when needed.
Enable: Show mitigated zones for context.
For Swing Trading (4H - Daily timeframes)
Display: 30-50 boxes.
Enable: All zones for comprehensive analysis.
Enable: Confluence filters when needed.
Enable: Show mitigated zones for context.
----------------------------------------------------
💡 Pro Tips
----------------------------------------------------
Multiple Timeframe Analysis: Use the indicator on multiple timeframes to identify nested order blocks and FVGs for stronger setups.
Confluence Zones: Areas where OBs and FVGs overlap often provide the highest probability trades.
Mitigation Matters: Pay attention to how quickly and cleanly zones are mitigated - clean mitigations often indicate institutional interest.
Filter Combinations: Experiment with different filter combinations to find what works best for your trading style.
Alert Management: Set up alerts for both OBs and FVGs to never miss potential setups.
----------------------------------------------------
⚠️ Important Notes
----------------------------------------------------
This indicator is for educational and informational purposes only.
Always confirm signals with your own analysis before trading.
Use proper risk management and position sizing.
The indicator works on all timeframes and instruments.
Past performance does not guarantee future results.
----------------------------------------------------
🔄 Updates & Support
----------------------------------------------------
Current Version: v1.1
This indicator is actively maintained and updated. Future versions may include additional features and improvements based on user feedback.
----------------------------------------------------
🙏 Acknowledgments
----------------------------------------------------
Created by @mawhoobx - Designed to help traders identify institutional footprints and market inefficiencies for better trading decisions.

VIX-SPX Quant Pro SystemQuantitative Analysis of Historical VIX Dynamics and Daily Predictive Frameworks for Volatility ForecastingThe financial ecosystem of the twenty-first century is increasingly governed by the measurement and management of risk, with the Cboe Volatility Index (VIX) serving as the primary benchmark for expected equity market turbulence.1 Originally proposed in the late 1980s by financial economists Menachem Brenner and Dan Galai, the concept of a "Sigma Index" was intended to provide a standardized, frequently updated measure of volatility that could facilitate the creation of futures and options for hedging purposes.3 In 1993, the Chicago Board Options Exchange (CBOE) implemented this vision, launching the VIX based on the implied volatility of eight S&P 100 at-the-money options series.1 The subsequent transformation of the VIX in 2003—shifting its underlying to the S&P 500 (SPX) and adopting a model-free methodology developed in conjunction with Goldman Sachs—marked its transition into the "fear gauge" recognized today by market participants worldwide.2Understanding the movement of the VIX historically and developing an equation to predict its daily levels requires a deep synthesis of data infrastructure, mathematical modeling, and an appreciation for the structural mechanics of the options market. The index does not measure historical or statistical volatility in the traditional sense; rather, it reflects the market's expectation of 30-day forward-looking volatility, as conveyed by current SPX option prices.5 This predictive capacity stems from the fact that implied volatility represents the consensus view of professional traders regarding the probability and magnitude of future price movements, adjusted for the insurance premiums they are willing to pay for downside protection.8Historical Data Infrastructure and Tracking MethodologiesTo track VIX movement historically with high fidelity, an analyst must rely on robust data pipelines that provide not only the index levels but also the underlying components of its calculation. Financial time-series data is prone to gaps, timestamp inconsistencies, and errors in Open-High-Low-Close (OHLC) reporting, necessitating the use of specialized vendors that normalize these datasets.10Evaluative Framework for Historical Data ProvidersHistorical tracking of the VIX is most effective when utilizing APIs that offer long-term datasets with high granular resolution. The choice of provider often dictates the scope of analysis, with some catering to end-of-day (EOD) historical research while others provide the tick-level detail required for high-frequency algorithmic modeling.10API ProviderData DepthFrequency SupportBest ForTagX Stock Market API10+ Years1m, 5m, 15m, EODQuant research and backtesting 10EOD Historical Data (EODHD)30+ YearsEOD, 1m, 5m, 1hLong-term trend analysis 11Polygon.ioReal-time & HistTick-level, 1m, EODU.S. algorithmic trading 10Alpha Vantage20+ YearsDaily, IntradayPrototyping and academics 10Yahoo Finance (yfinance)VariableDaily, WeeklyQuick prototyping/casual use 11DatabentoExtensiveHigh-frequency tickLow-latency precisive analysis 11FRED (St. Louis Fed)Since 1990Daily CloseMacroeconomic modeling 16Beyond the broad providers, official sources like the CBOE DataShop provide the most authoritative historical files, including EOD calculation inputs from May 9, 2022, to the present.17 These files contain every strike price, weight, and contribution used to derive the last published VIX value of each day, which is critical for those seeking to understand why the index moved during specific volatility regimes.17 For researchers investigating older data, the St. Louis Fed’s FRED database maintains the VIXCLS series, providing daily closing values dating back to January 1990, alongside historical data for other volatility benchmarks.4The VIX Calculation Methodology: A Deep DiveThe ability to predict VIX levels daily relies on a fundamental understanding of its mechanical derivation. Contrary to common misconceptions, the VIX is not calculated using the Black-Scholes-Merton model to solve for individual implied volatilities.19 Instead, it employs a model-free formula that captures a weighted sum of variance estimates across a broad range of strike prices.19Mathematical Formula and Strike SelectionThe VIX methodology targets a constant 30-day maturity by interpolating between two tenors of SPX options.19 These "near-term" and "next-term" expirations must have more than 23 days and less than 37 days to maturity.7The core equation for the variance of each tenor ($\sigma^2$) is expressed as:$$\sigma^2 = \frac{2}{T} \sum_i \frac{\Delta K_i}{K_i^2} e^{RT} Q(K_i) - \frac{1}{T} \left( \frac{F}{K_0} - 1 \right)^2$ BMV:IN this calculation:$T$ is the time to expiration (calculated precisely in minutes).19$F$ is the forward index level derived from option prices.7$K_i$ is the strike price of the $i^{th}$ out-of-the-money (OTM) option.19$\Delta K_i$ is the strike price interval, calculated as half the difference between the strikes on either side of $K_i$.20$Q(K_i)$ is the midpoint of the bid-ask quote for strike $K_i$.7$R$ is the risk-free interest rate.19$K_0$ is the first strike price below the forward index level $F$.19Once the variances for the two tenors are calculated, they are linearly interpolated to find the 30-day variance, the square root of which is multiplied by 100 to yield the VIX index value.19Historical Dynamics: Mean Reversion and Asymmetric CorrelationThe development of predictive equations must be grounded in the structural behavior of volatility. The VIX possesses two distinct characteristics that differentiate it from traditional equity assets: it is bounded at both ends and demonstrates powerful mean reversion.26The Central Tendency PrincipleThe VIX gravitates toward a long-term average of approximately 19.5.23 Statistical research establishes that in any given month, the VIX tends to move about 30% of the distance between its current level and its long-term average.30 This "speed of mean reversion" is a critical constant in predictive equations, as it provides a directional bias when volatility deviates significantly from the norm.8The Inverse Correlation with EquitiesThe relationship between the S&P 500 and the VIX is strongly negative, with a historical correlation coefficient typically ranging from -0.70 to -0.80.27 This link is essentially a reflection of the "leverage effect," where price declines increase financial risk and investor fear, driving up option premiums.33 Interestingly, while the two move in opposite directions 80% of the time, the remaining 20% often features positive co-movement.34Technical Roadmaps and Actionable Calculation RulesFor intraday SPX trading on the 3-minute timeframe, mathematical findings can be translated into the following actionable study logic:Rule 1: The "Rule of 16" Intraday RangeThe Rule of 16 converts annualized VIX into a daily expected move by dividing the VIX level by 16.35 For a 3-minute timeframe, this expectation must be scaled by the square root of the number of bars in a trading day (130 bars for a standard 390-minute session):$$Expected Move_{Bar} = \frac{VIX}{16 \cdot \sqrt{Bars_{Day}}}$ MIL:IF the current SPX candle breaks outside these dynamic bands, it signals an "excess volatility" event likely driven by institutional hedging flow.35Rule 2: VIX/VXV Ratio ExhaustionThe spread between 1-month and 3-month volatility identifies when fear is overextended.33Warning Zone (Short SPX): Ratio > 1.0 (Short-term fear > Long-term expectation).38Exhaustion Zone (Long SPX): Ratio > 1.25 (Near-term panic is at its zenith).38Rule 3: Bollinger Band "Rubber Band" ReversionWhen the VIX stretches more than 30% above its 20-period moving average and closes back inside its upper Bollinger Band, it signals a "snap back" where equity prices typically rally as fear recedes.Pine Script V6: Actionable VIX-SPX Signal System (Overlay)This script implements the findings as an overlay for the S&P 500 (SPX) chart. It provides Long/Short ✖ crosses and dynamic "Expected Move" bands based on the VIX.
Synthesis of Daily Calculation MethodologyTo conclude the predictive framework, the following table summarizes the real-time calculation methodology for daily levels.StepActionPractical Formula / ThresholdObjective1Establish Baseline$V_{base} = V_t + $Quantify mean reversion pressure 82Equity Shock Adj$V_{adj} = V_{base} - (0.82 \cdot R_{SPX,t})$Incorporate leverage effect and correlation 243Technical FilterPlot vs. Upper Bollinger Band (+2SD)Identify overextension/exhaustion points 404Range BoundApply Rule of 16 ( TVC:VIX / 16$)Set daily SPX fluctuation targets 35Through the systematic integration of these components, market analysts can transition from reactive observation of market fear to proactive navigation of risk-neutral volatility expectations, effectively utilizing the VIX as a forward-looking beacon for equity market outcomes.2

Simple Trend Pullback Tool (EMA) v1.1Simple Trend Pullback Filter (EMA)
Overview This script is a lightweight, objective tool designed to filter out market noise and identify high-probability entry zones in trending markets. Built on the core principle of "The Rising Tide," it utilizes a dual-EMA cloud to visualize the trend’s health and highlight where the price is likely to find support after an overextended breakout.
How It Works
Trend Identification: The script tracks the alignment between the EMA 50 and EMA 200. When the price is consistently above this "Cloud," the market is in a confirmed uptrend.
The Pullback Logic: Instead of chasing breakouts (which often lead to FOMO-driven losses), this tool highlights the 'Mean Reversion' zone. It signals an entry when price action "pulls back" into the EMA cloud while the primary trend remains bullish.
Simplicity First: There are no laggy oscillators or repainting signals. It uses price action relative to time-weighted moving averages to keep your chart clean and your decisions logical.
Example Use Case: $CUU.V and NASDAQ:RKLB In the current market (December 2025), we see high-velocity breakouts in sectors like Space and Copper. While a stock like Copper Fox ($CUU.V) may jump 28% on merger news, this script helps traders wait for the necessary consolidation back toward the EMA 20/50 support before committing capital.
Settings
EMA 1 (Fast): Default 50 — Tracks intermediate momentum.
EMA 2 (Slow): Default 200 — The "Line in the Sand" for long-term trend direction.

Statistcal Daily Profile & Ranges# Statistical Daily Profile & Ranges - TradingView Publication Guide
## Overview
The **Statistical Daily Profile & Ranges** indicator is a comprehensive tool designed to analyze intraday session behavior and daily range characteristics. It combines Average Daily Range (ADR) projection levels with detailed session-by-session statistics and probability-based trading insights derived from historical price action patterns.
## What This Indicator Does
This indicator provides traders with three core analytical components:
1. **ADR Projection Levels** - Dynamic support/resistance levels based on historical daily ranges
2. **Session Range Analysis** - Visual boxes and statistical breakdowns for four key trading sessions
3. **Dynamic Probability Display** - Real-time probability statistics based on overnight session relationships
## How It Works
### Average Daily Range (ADR) Calculation
The indicator calculates the average daily range over a user-defined lookback period (default: 10 days) and projects this range from each day's opening price. This creates two key levels:
- **ADR High**: Opening price + average daily range
- **ADR Low**: Opening price - average daily range
- **ADR Median**: The opening price (middle of the projected range)
These levels are recalculated at the start of each trading day and extend forward, providing dynamic support and resistance zones based on recent volatility characteristics.
### Session Tracking & Statistics
The indicator monitors four distinct trading sessions (times in Eastern Time):
1. **Asia Session** (8:00 PM - 2:00 AM)
2. **London Session** (2:00 AM - 8:00 AM)
3. **NY Open** (8:00 AM - 9:00 AM)
4. **NY Initial Balance** (9:30 AM - 10:30 AM)
For each session, the indicator:
- Draws a colored box showing the session's high-to-low range
- Tracks the opening price, high, and low
- Stores historical data for statistical analysis
- Calculates average ranges by day of week (Monday through Friday)
The session statistics are displayed in a customizable table showing average point ranges for each session across different weekdays, helping traders identify which sessions and days typically produce the most movement.
### Dynamic Probability System
The indicator analyzes the relationship between the Asia and London sessions to determine the current market setup. After the London session closes, it automatically detects one of four possible conditions:
**1. London Engulfs Asia**
- London session breaks both above Asia's high AND below Asia's low
- This indicates strong momentum during the European session
- Most common occurrence pattern
**2. Asia Engulfs London**
- Asia session range completely contains the London session range
- Indicates consolidation during London hours
- Relatively rare pattern (occurs approximately 5.36% of the time)
**3. London Partially Engulfs Upwards**
- London breaks above Asia's high but stays above Asia's low
- Suggests bullish momentum continuation from Asia into London
**4. London Partially Engulfs Downwards**
- London breaks below Asia's low but stays below Asia's high
- Suggests bearish momentum continuation from Asia into London
Once a condition is detected, the indicator displays a probability table showing historically observed outcomes for that specific setup, including:
- Probability of NY session taking out key levels (Asia high/low, London high/low)
- Probability of NY session engulfing the entire overnight range
- Directional bias for NY Cash session (9:30 AM - 4:00 PM)
## How to Use This Indicator
### Initial Setup
1. Add the indicator to your chart (works on any intraday timeframe below Daily)
2. Adjust the **ADR Days** setting (default: 10) to control the lookback period for range calculation
3. Adjust the **Session Lookback Days** setting (default: 50) to determine how much historical data feeds the statistics tables
### Reading the ADR Levels
- Use the **ADR High** and **ADR Low** lines as potential profit targets or areas where price may encounter resistance
- The **ADR Median** line represents the opening price and can act as a pivot point for intraday directional bias
- If price reaches the ADR High early in the session, it suggests strong bullish momentum; conversely for ADR Low
- These levels adapt daily based on recent volatility, making them more responsive than static levels
### Interpreting Session Boxes
- **Session boxes** visually highlight when each trading session is active and its price range
- Larger boxes indicate higher volatility during that session
- Compare current session ranges to the statistical averages shown in the table
- Sessions that are unusually quiet or active relative to historical averages may signal compression or expansion
### Using the Session Statistics Table
- The table shows average point ranges for each session broken down by weekday
- Identify which sessions typically produce the most movement on specific days
- For example, if London on Thursdays averages 40 points while Mondays average 25 points, you can adjust position sizing or expectations accordingly
- The **Total** column shows the overall average across all days
- Sample sizes (shown in brackets if enabled) indicate data reliability
### Trading with the Probability Table
The probability table updates dynamically after the London session closes and shows statistically probable outcomes based on 12 years of NQ futures data.
**Important Limitations:**
- **These probabilities are derived from NQ (Nasdaq E-mini futures) data only**
- **Do NOT apply these probability statistics to other instruments** (ES, stocks, forex, etc.)
- The probabilities represent historical frequencies, not guarantees
- Always combine with your own analysis, risk management, and market context
**How to Apply the Probabilities:**
When **London Engulfs Asia**:
- Watch for NY session to take out London's extremes (72.33% probability for high, 71.12% for low)
- Slight bullish bias in NY Cash session (54.80% vs 45.20%)
- Lower probability of complete overnight engulfment (44.13%)
When **Asia Engulfs London** (rare - 5.36% occurrence):
- Higher probability NY takes Asia's high (75.86%)
- Moderately high probability NY takes Asia's low (65.52%)
- Slight increase in bullish bias (58.42% vs 41.58%)
- Recognize this as an unusual setup
When **London Partially Engulfs Upwards**:
- Very high probability NY takes London high (81.51%)
- Strong probability NY takes London low (64.45%)
- Moderate probability NY takes Asian low (53.16%)
- Slight bullish bias (55.52%)
When **London Partially Engulfs Downwards**:
- Very high probability NY takes London low (75.29%)
- Strong probability NY takes London high (68.80%)
- Moderate probability NY takes Asian high (56.44%)
- Slight bullish bias maintained (52.99%)
### Practical Trading Applications
**Scenario 1: Range Projection**
If the ADR is 500 points and the market opens at 25,000:
- ADR High: 25,500 (potential resistance/target)
- ADR Low: 24,500 (potential support/target)
- Monitor how price interacts with these levels throughout the day
**Scenario 2: Session-Based Trading**
Using the statistics table, you notice London on Wednesdays averages 35 points. During a Wednesday London session:
- If London has already moved 30 points, the session may be exhausting its typical range
- If London has only moved 15 points with an hour remaining, there may be expansion potential
- Adjust stop losses and targets based on typical session behavior
**Scenario 3: Probability-Based Setup**
It's 8:05 AM ET and the indicator shows "London Partially Engulfs Upwards":
- You now know there's an 81.51% historical probability NY will take out London's high
- There's a 53.16% probability NY will reach down to Asia's low
- The NY Cash session has a slight bullish bias (55.52%)
- Consider this alongside your technical analysis for directional bias and level targeting
## Customization Options
### Visual Settings
- **Line Width**: Adjust thickness of ADR levels
- **ADR Color/Style**: Customize appearance of ADR projection lines (solid, dashed, dotted)
- **Median Line**: Toggle visibility and customize appearance separately
- **Session Box Colors**: Customize each session's box color independently
- **Show Session Boxes**: Toggle session box visibility on/off
### Label Settings
- **ADR Labels**: Show/hide labels for ADR High and ADR Low, adjust size
- **Median Label**: Separate control for median line label
- **Session Labels**: Show/hide session name labels, adjust size
- **Label Colors**: Customize text colors for all labels
### Table Settings
- **Session Stats Table**: Position (9 locations available), size (Tiny to Huge), toggle on/off
- **Sample Sizes**: Show/hide the number of historical samples used for each calculation
- **Probabilities Table**: Separate position and size controls, toggle on/off
### Session Times
- Each session's time range can be customized to fit different markets or preferences
- All times are in Eastern Time (America/New_York timezone)
## Technical Notes
### Data Requirements
- The indicator requires sufficient historical data based on your lookback settings
- Minimum recommended: 50+ days of intraday data for reliable statistics
- Works on any timeframe below Daily (1-minute, 5-minute, 15-minute, etc.)
### Calculation Methodology
- **ADR Calculation**: Simple average of absolute daily high-low ranges
- **Session Statistics**: Mean average of ranges for each session filtered by day of week
- **Condition Detection**: Boolean logic comparing session high/low relationships
- All calculations update in real-time as new bars form
### Probability Data Source
The probability statistics displayed in the dynamic table are derived from:
- **Dataset**: 12 years of NQ (Nasdaq E-mini futures) historical data
- **Methodology**: Frequency analysis of outcomes following specific setup conditions
- **Time Period**: Multiple market cycles including various volatility regimes
**Critical Warning**: These probabilities are specific to NQ and reflect that instrument's behavior patterns. Market microstructure, participant behavior, and volatility characteristics differ significantly across instruments. Do not apply these NQ-derived probabilities to other markets (ES, RTY, YM, individual stocks, forex, commodities, etc.).
## Best Practices
1. **Combine with Other Analysis**: Use this indicator as one component of a complete trading methodology, not a standalone system
2. **Respect Risk Management**: Probabilities are not certainties; always use proper position sizing and stop losses
3. **Context Matters**: High-impact news events, holiday trading, and extreme volatility can invalidate typical patterns
4. **Verify Statistics**: Monitor your own results and compare to the displayed probabilities
5. **Adapt Session Times**: If trading instruments with different active hours, adjust session times accordingly
6. **Regular Calibration**: Periodically review if the session averages and probabilities remain relevant to current market conditions
## Understanding Originality
This indicator is original in its approach to combining three analytical frameworks into a single tool:
1. **Dynamic ADR Projection**: Unlike static pivot points, these levels adapt daily based on recent volatility
2. **Session-Specific Statistics**: Goes beyond simple volume profiles by quantifying average ranges for specific time windows across weekdays
3. **Conditional Probability Display**: Automatically detects overnight session relationships and displays relevant probability data rather than showing all scenarios simultaneously
The conditional logic system that determines which probability set to display is a key differentiator—traders only see the statistics relevant to the current market setup, reducing information overload and improving decision-making clarity.
## Summary
The **Statistical Daily Profile & Ranges** indicator provides traders with a comprehensive framework for understanding daily range potential, session-specific behavior patterns, and probability-based setup analysis. By combining ADR projection levels with detailed session statistics and dynamic probability displays, traders gain multiple perspectives on potential price movement within the trading day.
The indicator is most effective when used to:
- Set realistic profit targets based on average daily range
- Identify which sessions typically produce movement on specific weekdays
- Understand probability-weighted outcomes for different overnight setup conditions (NQ only)
- Visualize session ranges and compare them to historical averages
Remember that all statistical analysis reflects historical patterns, and market behavior can change. Always combine indicator signals with sound risk management, proper position sizing, and your own market analysis.

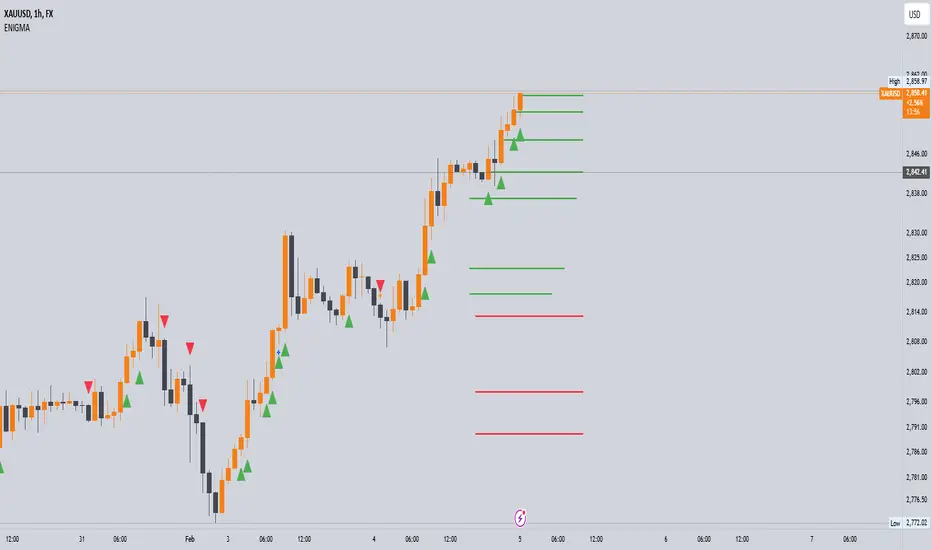
Enigma UnlockedENIGMA Indicator: A Comprehensive Market Bias & Success Tracker
The ENIGMA Indicator is a powerful tool designed for traders who aim to identify market bias, track price movements, and evaluate trade performance using multiple timeframes. It combines multiple indicators and advanced logic to provide real-time insights into market trends, helping traders make more informed decisions.
Key Features
1. Multi-Timeframe Bias Calculation:
The ENIGMA Indicator tracks the market bias across multiple timeframes—Daily (D), 4-Hour (H4), 1-Hour (H1), 30-Minute (30M), 15-Minute (15M), 5-Minute (5M), and 1-Minute (1M).
How the Bias is Created:
The Bias is a key feature of the ENIGMA Indicator and is determined by comparing the current price with previous price levels for each timeframe.
- Bullish Bias (1): The market is considered **bullish** if the **current closing price** is higher than the **previous timeframe’s high**. This suggests that the market is trending upwards, and buyers are in control.
- Bearish Bias (-1): The market is considered **bearish** if the **current closing price** is lower than the **previous timeframe’s low**. This suggests that the market is trending downwards, and sellers are in control.
- Neutral Bias (0): The market is considered **neutral** if the price is between the **previous high** and **previous low**, indicating indecision or a range-bound market.
This bias calculation is performed independently for each timeframe. The **Bias** for each timeframe is then displayed in the **Bias Table** on your chart, providing a clear view of market direction across multiple timeframes.
2. **Customizable Table Display:**
- The indicator provides a table that displays the bias for each selected timeframe, clearly marking whether the market is **Bullish**, **Bearish**, or **Neutral**.
- Users can choose where to place the table on the chart: top-left, top-right, bottom-left, bottom-right, or center positions, allowing for easy and personalized chart management.
3. **Win/Loss Tracker:**
- The table also tracks the **success rate** of **buy** and **sell** trades based on price retests of key bias levels.
- For each period (Day, Week, Month), it tracks how often the price has moved in the direction of the initial bias, counting **Buy Wins**, **Sell Wins**, **Buy Losses**, and **Sell Losses**.
- This helps traders assess the effectiveness of the market bias over time and adjust their strategies accordingly.
#### **How the Success Calculation Determines the Success Rate:**
The **Success Calculation** is designed to track how often the price follows the direction of the market bias. It does this by evaluating how the price retests key levels associated with the identified market bias:
1. **Buy Success Calculation**:
- The success of a **Buy Trade** is determined when the price breaks above the **previous high** after a **bullish bias** has been identified.
- If the price continues to move higher (i.e., makes a new high) after breaking the previous high, the **buy trade is considered successful**.
- The indicator tracks how many times this condition is met and counts it as a **Buy Win**.
2. **Sell Success Calculation**:
- The success of a **Sell Trade** is determined when the price breaks below the **previous low** after a **bearish bias** has been identified.
- If the price continues to move lower (i.e., makes a new low) after breaking the previous low, the **sell trade is considered successful**.
- The indicator tracks how many times this condition is met and counts it as a **Sell Win**.
3. **Failure Calculations**:
- If the price does not move as expected (i.e., it does not continue in the direction of the identified bias), the trade is considered a **loss** and is tracked as **Buy Loss** or **Sell Loss**, depending on whether it was a bullish or bearish trade.
The ENIGMA Indicator keeps a running tally of **Buy Wins**, **Sell Wins**, **Buy Losses**, and **Sell Losses** over a set period (which can be customized to Days, Weeks, or Months). These statistics are updated dynamically in the **Bias Table**, allowing you to track your success rate in real-time and gain insights into the effectiveness of the market bias.
#### **Customizable Period Tracking:**
- The ENIGMA Indicator allows you to set custom tracking periods (e.g., 30 days, 2 weeks, etc.). The performance metrics reset after each tracking period, helping you monitor your success in different market conditions.
5. **Interactive Settings:**
- **Lookback Period**: Define how many bars the indicator should consider for bias calculations.
- **Success Tracking**: Set the number of candles to track for calculating the win/loss performance.
- **Time Threshold**: Set a time threshold to help define the period during which price retests are considered valid.
- **Info Tooltip**: You can enable the information tool in the settings to view detailed explanations of how wins and losses are calculated, ensuring you understand how the indicator works and how the results are derived.
#### **How to Use the ENIGMA Indicator:**
1. **Install the Indicator**:
- Add the ENIGMA Indicator to your chart. It will automatically calculate and display the bias for multiple timeframes.
2. **Interpret the Bias Table**:
- The bias table will show whether the market is **Bullish**, **Bearish**, or **Neutral** across different timeframes.
- Look for alignment between the timeframes—when multiple timeframes show the same bias, it may indicate a stronger trend.
3. **Use the Win/Loss Tracker**:
- Track how well your trades align with the bias using the **Win/Loss Tracker**. This helps you refine your strategy by understanding which timeframes and biases lead to higher success rates.
- For example, if you see a high number of **Buy Wins** and a low number of **Sell Wins**, you may decide to focus more on buying during bullish trends and avoid selling during bearish retracements.
4. **Track Your Period Performance**:
- The indicator will automatically track your performance over the set period (Days, Weeks, Months). Use this data to adjust your approach and evaluate the effectiveness of your trading strategy.
5. **Position the Table**:
- Customize the placement of the table on your chart based on your preferences. You can choose from options like **Top Left**, **Top Right**, **Bottom Left**, **Bottom Right**, or **Center** to keep the chart uncluttered.
6. **Adjust Settings**:
- Modify the indicator settings according to your trading style. You can adjust the **Lookback Period**, **Number of Candles to Track**, and **Time Threshold** to match the pace of your trading.
7. **Use the Info Tooltip**:
- Enable the **Info Tool** in the settings to understand how the Buy/Sell Wins and Losses are calculated. The tooltip provides a breakdown of how the indicator tracks price movements and calculates the success rate.
**Conclusion:**
The **ENIGMA Indicator** is designed to help traders make informed decisions by providing a clear view of the market bias and performance data. With the ability to track bias across multiple timeframes and evaluate your trading success, it can be a powerful tool for refining your trading strategies.
Whether you're looking to focus on a single timeframe or analyze multiple timeframes for a stronger bias, the ENIGMA Indicator adapts to your needs, providing both real-time market insights and performance feedback.
ORB Fusion ML AdaptiveORB FUSION ML - ADAPTIVE OPENING RANGE BREAKOUT SYSTEM
INTRODUCTION
ORB Fusion ML is an advanced Opening Range Breakout (ORB) system that combines traditional ORB methodology with machine learning probability scoring and adaptive reversal trading. Unlike basic ORB indicators, this system features intelligent breakout filtering, failed breakout detection, and complete trade lifecycle management with real-time visual feedback.
This guide explains the theoretical concepts, system components, and educational examples of how the indicator operates.
WHAT IS OPENING RANGE BREAKOUT (ORB)?
Core Concept:
The Opening Range Breakout strategy is based on the observation that the first 15-60 minutes of trading often establish a range that serves as support/resistance for the remainder of the session. Breakouts beyond this range have historically indicated potential directional moves.
How It Works:
Range Formation: System identifies high and low during opening period (default 30 minutes)
Breakout Detection: Monitors price for confirmed breaks above/below range
Signal Generation: Generates signals based on breakout method and filters
Target Projection: Projects extension targets based on range size
Why ORB May Be Effective:
Opening period often represents institutional positioning
Range boundaries historically act as support/resistance
Breakouts may indicate strong directional bias
Failed breakouts may signal reversal opportunities
Note: Historical patterns do not guarantee future occurrences.
SYSTEM COMPONENTS
1. OPENING RANGE DETECTION
Primary ORB:
Default: First 30 minutes of regular trading hours (9:30-10:00 AM ET)
Configurable: 5, 15, 30, or 60-minute ranges
Precision: Optional lower timeframe (LTF) data for exact high/low detection
LTF Precision Mode:
When enabled, system uses 1-minute data to identify precise range boundaries, even on higher timeframe charts. This may improve accuracy of breakout detection.
Session ORBs (Optional):
Asian Session: Typically 00:00-01:00 UTC
London Session: Typically 08:00-09:00 UTC
NY Session: Typically 13:30-14:30 UTC
These provide additional reference levels for 24-hour markets.
2. INITIAL BALANCE (IB)
The Initial Balance concept extends ORB methodology:
Components:
A-Period: First 30 minutes (9:30-10:00)
B-Period: Second 30 minutes (10:00-10:30)
IB Range: Combined high/low of both periods
IB Extensions:
System projects multiples of IB range (0.5×, 1.0×, 1.5×, 2.0×) as potential targets and key reference levels.
Historical Context:
IB methodology was popularized by traders observing that the first hour often establishes the day's trading range. Extensions beyond IB may indicate trend day development.
3. BREAKOUT CONFIRMATION METHODS
The system offers three confirmation methods:
A. Close Beyond Range (Default):
Bullish: Close > ORB High
Bearish: Close < ORB Low
Most balanced approach - requires bar to close beyond level.
B. Wick Beyond Range:
Bullish: High > ORB High
Bearish: Low < ORB Low
Most sensitive - any touch triggers. May generate more signals but higher false breakout rate.
C. Body Beyond Range:
Bullish: Min(Open, Close) > ORB High
Bearish: Max(Open, Close) < ORB Low
Most conservative - entire candle body must be beyond range.
Volume Confirmation:
Optional requirement that breakout occurs on above-average volume (default 1.5× 20-bar average). May filter weak breakouts lacking institutional participation.
4. MACHINE LEARNING PROBABILITY SCORING
The system's key differentiator is ML-based breakout filtering using logistic regression.
How It Works:
Feature Extraction:
When breakout candidate detected, system calculates:
ORB Range / ATR (range size normalization)
Volume Ratio (current vs. average)
VWAP Distance × Direction (alignment)
Gap Size × Direction (overnight gap influence)
Bar Impulse (momentum strength)
Probability Calculation:
pContinue = Probability breakout continues
pFail = Probability breakout fails and reverses
Calculated via logistic regression:
P = 1 / (1 + e^(-z))
where z = β₀ + β₁×Feature₁ + β₂×Feature₂ + ...
Coefficient Examples (User Configurable):
pContinue Model:
Intercept: -0.20 (slight bearish bias)
ORB Range/ATR: +0.80 (larger ranges favored)
Volume Ratio: +0.60 (higher volume increases probability)
VWAP Alignment: +0.50 (aligned with VWAP helps)
pFail Model:
Intercept: -0.30 (assumes most breakouts valid)
Volume Ratio: -0.50 (low volume increases failure risk)
VWAP Alignment: -0.90 (breaking away from VWAP risky)
ML Gating:
When enabled, breakout only signaled if:
pContinue ≥ Minimum Threshold (default 55%)
pFail ≤ Maximum Threshold (default 35%)
This filtering aims to reduce false breakouts by requiring favorable probability scores.
Model Training:
Users should backtest and optimize coefficients for their specific instrument and timeframe. Default values are educational starting points, not guaranteed optimal parameters.
Educational Note: ML models assume past feature relationships continue into the future. Market conditions may change in ways not captured by historical data.
5. FAILED BREAKOUT DETECTION & REVERSAL TRADING
A unique feature is automatic detection of failed breakouts and generation of counter-trend reversal setups.
Detection Logic:
Failure Conditions:
For Bullish Breakout that fails:
- Initially broke above ORB High
- After N bars (default 3), price closes back inside range
- Must close below (ORB High - Buffer)
- Buffer = ATR × 0.1 (default)
For Bearish Breakout that fails:
- Initially broke below ORB Low
- After N bars, price closes back inside range
- Must close above (ORB Low + Buffer)
Automatic Reversal Entry:
When failure detected, system automatically:
Generates reversal entry at current close
Sets stop loss beyond recent extreme + small buffer
Projects 3 targets based on ORB range multiples
Target Calculations:
For failed bullish breakout (now SHORT):
Entry = Close (when failure confirmed)
Stop = Recent High + (ATR × 0.10)
T1 = ORB High - (ORB Range × 0.5) // 50% retracement
T2 = ORB High - (ORB Range × 1.0) // Full retracement
T3 = ORB High - (ORB Range × 1.5) // Beyond opposite boundary
Trade Lifecycle Management:
The system tracks reversal trades in real-time through multiple states:
State 0: No trade
State 1: Breakout active (monitoring for failure)
State 2: Breakout failed (not used currently)
State 3: Reversal entry taken
State 4: Target 1 hit
State 5: Target 2 hit
State 6: Target 3 hit
State 7: Stopped out
State 8: Complete
Real-Time Tracking:
MFE (Maximum Favorable Excursion): Best price achieved
MAE (Maximum Adverse Excursion): Worst price against position
Dynamic Lines & Labels: Visual updates as trade progresses
Color Coding: Green for hit targets, gray for stopped trades
Visual Feedback:
Entry line (solid when active, dotted when stopped)
Stop loss line (red dashed)
Target lines (green when hit, gray when stopped)
Labels update in real-time with status
This complete lifecycle tracking provides educational insight into trade development and risk/reward realization.
Educational Context: Failed breakouts are a recognized pattern in technical analysis. The theory is that trapped traders may need to exit, creating momentum in the opposite direction. However, not all failed breakouts result in profitable reversals.
6. EXTENSION TARGETS
System projects Fibonacci-based extension levels beyond ORB boundaries.
Bullish Extensions (Above ORB High):
1.272× (ORB High + ORB Range × 0.272)
1.5× (ORB High + ORB Range × 0.5)
1.618× (ORB High + ORB Range × 0.618)
2.0× (ORB High + ORB Range × 1.0)
2.618× (ORB High + ORB Range × 1.618)
3.0× (ORB High + ORB Range × 2.0)
Bearish Extensions (Below ORB Low):
Same multipliers applied below ORB Low
Visual Representation:
Dotted lines until reached
Solid lines after price touches level
Color coding (green for bullish, red for bearish)
These serve as potential profit targets and key reference levels.
7. DAY TYPE CLASSIFICATION
System attempts to classify trading day based on price movement relative to Initial Balance.
Classification Logic:
IB Extension = (Current Price - IB Boundary) / IB Range
Day Types:
Trend Day: Extension ≥ 1.5× IB Range
- Strong directional movement
- Price extends significantly beyond IB
Normal Day: Extension between 0.5× and 1.5×
- Moderate movement
- Some extension but not extreme
Rotation Day: Price stays within IB
- Range-bound conditions
- Limited directional conviction
Historical Context:
Day type classification comes from market profile analysis, suggesting different trading approaches for different conditions. However, classification is backward-looking and may change throughout the session.
8. VWAP INTEGRATION
Volume-Weighted Average Price included as institutional reference level.
Calculation:
VWAP = Σ(Typical Price × Volume) / Σ(Volume)
Typical Price = (High + Low + Close) / 3
Standard Deviation Bands:
Band 1: VWAP ± 1.0 σ
Band 2: VWAP ± 2.0 σ
Usage:
Alignment with VWAP may indicate institutional support
Distance from VWAP factored into ML probability scoring
Bands suggest potential overbought/oversold extremes
Note: VWAP is widely used by institutional traders as a benchmark, but this does not guarantee its predictive value.
9. GAP ANALYSIS
Tracks overnight gaps and fill statistics.
Gap Detection:
Gap Size = Open - Previous Close
Classification:
Gap Up: Gap > ATR × 0.1
Gap Down: Gap < -ATR × 0.1
No Gap: Otherwise
Gap Fill Tracking:
Monitors if price returns to previous close
Calculates fill rate over time
Displays previous close as reference level
Historical Context:
Market folklore suggests "gaps get filled," though statistical evidence varies by market and timeframe.
10. MOMENTUM CANDLE VISUALIZATION
Optional colored boxes around candles showing position relative to ORB.
Color Coding:
Blue: Inside ORB range
Green: Above ORB High (bullish momentum)
Red: Below ORB Low (bearish momentum)
Bright Green: Breakout bar
Orange: Failed breakout bar
Gray: Stopped out bar
Lime: Target hit bar
Provides quick visual context of price location and key events.
DISPLAY MODES
Three complexity levels to suit different user preferences:
SIMPLE MODE
Minimal display focusing on essentials:
✓ Primary ORB levels (High, Low, Mid)
✓ Basic breakout signals
✓ Essential dashboard metrics
✗ No session ORBs
✗ No IB analysis
✗ No extensions
Best for: Clean charts, beginners, focus on core ORB only
STANDARD MODE
Balanced feature set:
✓ Primary ORB levels
✓ Initial Balance with extensions
✓ Session ORBs (Asian, London, NY)
✓ VWAP with bands
✓ Breakout and reversal signals
✓ Gap analysis
✗ Detailed statistics
Best for: Most traders, good balance of information and clarity
ADVANCED MODE
Full feature set:
✓ All Standard features
✓ ORB extensions (1.272×, 1.5×, 1.618×, 2.0×, etc.)
✓ Complete statistics dashboard
✓ Detailed performance metrics
✓ All visual enhancements
Best for: Experienced users, research, full analysis
DASHBOARD INTERPRETATION
Main Dashboard Sections:
ORB Status:
Status: Complete / Building / Waiting
Range: Actual range size in price units
Trade State:
State: Current trade status (see 8 states above)
Vol: Volume confirmation (Confirmed / Low)
Targets (when reversal active):
T1, T2, T3: Hit / Pending / Stopped
Color: Green = hit, Gray = pending or stopped
ML Section (when enabled):
ML: ON Pass / ON Reject / OFF
pC/pF: Probability scores as percentages
Setup:
Action: LONG / SHORT / REVERSAL / FADE / WAIT
Grade: A+ to D based on confidence
Status: ACTIVE / STOPPED / T1 HIT / etc.
Conf: Confidence percentage
Context:
Bias: Overall market direction assessment
VWAP: Above / Below / At VWAP
Gap: Gap type and fill status
Statistics (Advanced Mode):
Bull WR: Bullish breakout win rate
Bear WR: Bearish breakout win rate
Rev WR: Reversal trade win rate
Rev Count: Total reversals taken
Narrative Dashboard:
Plain-language interpretation:
Phase: Building ORB / Trading Phase / Pre-market
Status: Current market state in plain English
ML: Probability scores
Setup: Trade recommendation with grade
All metrics based on historical simulation, not live trading results.
USAGE GUIDELINES - EDUCATIONAL EXAMPLES
Getting Started:
Step 1: Chart Setup
Add indicator to chart
Select appropriate timeframe (1-5 min recommended for ORB trading)
Choose display mode (start with Standard)
Step 2: Opening Range Formation
During first 30 minutes (9:30-10:00 ET default)
Watch ORB High/Low levels form
Note range size relative to ATR
Step 3: Breakout Monitoring
After ORB complete, watch for breakout candidates
Check ML scores if enabled
Verify volume confirmation
Step 4: Signal Evaluation
Consider confidence grade
Review trade state and targets
Evaluate risk/reward ratio
Interpreting ML Scores:
Example 1: High Probability Breakout
Breakout: Bullish
pContinue: 72%
pFail: 18%
ML Status: Pass
Grade: A
Interpretation:
- High continuation probability
- Low failure probability
- Passes ML filter
- May warrant consideration
Example 2: Rejected Breakout
Breakout: Bearish
pContinue: 48%
pFail: 52%
ML Status: Reject
Grade: D
Interpretation:
- Low continuation probability
- High failure probability
- ML filter blocks signal
- Small 'X' marker shows rejection
Note: ML scores are mathematical outputs based on historical data. They do not guarantee outcomes.
Reversal Trade Example:
Scenario:
9:45 AM: Bullish breakout above ORB High
9:46 AM: Price extends to +0.8× ORB range
9:48 AM: Price reverses, closes back below ORB High
9:49 AM: Failure confirmed (3 bars inside range)
System Response:
- Marks failed breakout with 'FAIL' label
- Generates SHORT reversal entry
- Sets stop above recent high
- Projects 3 targets
- Trade State → 3 (Reversal Active)
- Entry line and targets display
Potential Outcomes:
- Stop hit → State 7 (Stopped), lines gray out
- T1 hit → State 4, T1 line turns green
- T2 hit → State 5, T2 line turns green
- T3 hit → State 6, T3 line turns green
All tracked in real-time with visual updates.
Risk Management Considerations:
Position Sizing Example:
Account: $25,000
Risk per trade: 1% = $250
Stop distance: 1.5 ATR = $150 per share
Position size: $250 / $150 = 1.67 shares (round to 1)
Stop Loss Guidelines:
Breakout trades: ORB midpoint or opposite boundary
Reversal trades: System-provided stop (recent extreme + buffer)
Never widen system stops
Target Management:
Consider scaling out at T1, T2, T3
Trail stops after T1 reached
Full exit if stopped
These are educational examples, not recommendations. Users must develop their own risk management based on personal tolerance and account size.
OPTIMIZATION SUGGESTIONS
For Stock Indices (ES, NQ):
Suggested Settings:
ORB Timeframe: 30 minutes
Confirmation: Close
Volume Filter: ON (1.5×)
ML Filter: ON
Display Mode: Standard
Rationale:
30-min ORB standard for equity indices
Close confirmation balances speed and reliability
Volume important for institutional participation
ML helps filter noise
Historical Observation:
Indices often respect ORB levels during regular hours.
For Individual Stocks:
Suggested Settings:
ORB Timeframe: 5-15 minutes
Confirmation: Close or Body
Volume Filter: ON (1.8-2.0×)
RTH Only: ON
Failed Breakouts: ON
Rationale:
Shorter ORB may be appropriate for volatile stocks
Volume critical to filter low-liquidity moves
RTH avoids pre-market noise
Failed breakouts common in stocks
For Forex:
Suggested Settings:
ORB Timeframe: 60 minutes
Session ORBs: ON (Asian, London)
Volume Filter: OFF or low threshold
24-hour mode: ON
Rationale:
Forex trades 24 hours, need session awareness
Volume data less reliable in forex
Longer ORB for slower forex movement
For Crypto:
Suggested Settings:
ORB Timeframe: 30-60 minutes
Confirmation: Body (more conservative)
Volume Filter: ON (2.0×+)
Display Mode: Advanced
Rationale:
High volatility requires conservative confirmation
Volume crucial to distinguish real moves from noise
24-hour market benefits from multiple session ORBs
ML COEFFICIENT TUNING
Users can optimize ML model coefficients through backtesting.
Approach:
Data Collection: Review rejected breakouts - were they correct to reject?
Pattern Analysis: Which features correlate with success/failure?
Coefficient Adjustment: Increase weights for predictive features
Threshold Tuning: Adjust minimum pContinue and maximum pFail
Validation: Test on out-of-sample data
Example Optimization:
If finding:
High-volume breakouts consistently succeed
Low-volume breakouts often fail
Action:
Increase pCont w(Volume Ratio) from 0.60 to 0.80
Increase pFail w(Volume Ratio) magnitude (more negative)
If finding:
VWAP alignment highly predictive
Gap direction not helpful
Action:
Increase pCont w(VWAP Distance×Dir) from 0.50 to 0.70
Decrease pCont w(Gap×Dir) toward 0.0
Important: Optimization should be done on historical data and validated on out-of-sample periods. Overfitting to past data does not guarantee future performance.
STATISTICS & PERFORMANCE TRACKING
System maintains comprehensive statistics:
Breakout Statistics:
Total Days: Number of trading days analyzed
Bull Breakouts: Total bullish breakouts
Bull Wins: Breakouts that reached 2.0× extension
Bull Win Rate: Percentage that succeeded
Bear Breakouts: Total bearish breakouts
Bear Wins: Breakouts that reached 2.0× extension
Bear Win Rate: Percentage that succeeded
Reversal Statistics:
Reversals Taken: Total failed breakouts traded
T1 Hit: Number reaching first target
T2 Hit: Number reaching second target
T3 Hit: Number reaching third target
Stopped: Number stopped out
Reversal Win Rate: Percentage reaching at least T1
Day Type Statistics:
Trend Days: Days with 1.5×+ IB extension
Normal Days: Days with 0.5-1.5× extension
Rotation Days: Days staying within IB
Extension Statistics:
Average Extension: Mean extension level reached
Max Extension: Largest extension observed
Gap Statistics:
Total Gaps: Number of significant gaps
Gaps Filled: Number that filled during session
Gap Fill Rate: Percentage filled
Note: All statistics based on indicator's internal simulation logic, not actual trading results. Past statistics do not predict future outcomes.
ALERTS
Customizable alert system for key events:
Available Alerts:
Breakout Alert:
Trigger: Initial breakout above/below ORB
Message: Direction, price, volume status, ML scores, grade
Frequency: Once per bar
Failed Breakout Alert:
Trigger: Breakout failure detected
Message: Reversal setup with entry, stop, and 3 targets
Frequency: Once per bar
Extension Alert:
Trigger: Price reaches extension level
Message: Extension multiple and price level
Frequency: Once per bar per level
IB Break Alert:
Trigger: Price breaks Initial Balance
Message: Potential trend day warning
Frequency: Once per bar
Reversal Stopped Alert:
Trigger: Reversal trade hits stop loss
Message: Stop level and original entry
Frequency: Once per bar
Target Hit Alert:
Trigger: T1, T2, or T3 reached
Message: Which target and price level
Frequency: Once per bar
Users can enable/disable alerts individually based on preferences.
VISUAL CUSTOMIZATION
Extensive visual options:
Color Schemes:
All colors fully customizable:
ORB High, Low, Mid colors
Extension colors (bull/bear)
IB colors
VWAP colors
Momentum box colors
Session ORB colors
Display Options:
Line widths (1-5 pixels)
Box transparencies (50-95%)
Fill transparencies (80-98%)
Momentum box transparency
Label Behavior:
Label Modes:
All: Always show all labels
Adaptive: Fade labels far from price
Minimal: Only show labels very close to price
Label Proximity:
Adjustable threshold (1.0-5.0× ATR)
Labels beyond threshold fade or hide
Reduces clutter on wide-range charts
Gradient Fills:
Optional gradient zones between levels:
ORB High to Mid (bullish gradient)
ORB Mid to Low (bearish gradient)
Creates visual "heatmap" of tension
FREQUENTLY ASKED QUESTIONS
Q: What timeframe should I use?
A: ORB methodology is typically applied to intraday charts. Suggestions:
1-5 min: Active trading, multiple setups per day
5-15 min: Balanced view, clearer signals
15-30 min: Higher timeframe confirmation
The indicator works on any timeframe, but ORB is traditionally an intraday concept.
Q: Do I need the ML filter enabled?
A: This is a user choice:
ML Enabled:
Fewer signals
Potentially higher quality (filters low-probability)
Requires coefficient optimization
More complex
ML Disabled:
More signals
Simpler operation
Traditional ORB approach
May include lower-quality breakouts
Consider paper trading both approaches to determine preference.
Q: How should I interpret pContinue and pFail?
A: These are probability estimates from the logistic regression model:
pContinue 70% / pFail 25%: Model suggests favorable continuation odds
pContinue 45% / pFail 55%: Model suggests breakout likely to fail
pContinue 60% / pFail 35%: Borderline, depends on thresholds
Remember: These are mathematical outputs based on historical feature relationships. They are not certainties.
Q: Should I always take reversal trades?
A: Reversal trades are optional setups. Considerations:
Potential Advantages:
Trapped traders may need to exit
Clear stop loss levels
Defined targets
Potential Risks:
Counter-trend trading
Original breakout may resume
Requires quick reaction
Users should evaluate reversal setups like any other trade based on personal strategy and risk tolerance.
Q: What if ORB range is very small?
A: Small ranges may indicate:
Low volatility session opening
Potential for expansion later
Less reliable breakout levels
Considerations:
Larger ranges often more significant
Small ranges may need wider stops relative to range
ORB Range/ATR ratio helps normalize
The ML model includes this via the ORB Range/ATR feature.
Q: Can I use this on stocks, forex, crypto?
A: System is adaptable:
Stocks: Designed primarily for stock indices and equities. Use RTH mode.
Forex: Enable session ORBs. Volume filter less relevant. Adjust for 24-hour nature.
Crypto: Very volatile. Consider conservative confirmation method (Body). Higher volume thresholds.
Each market has unique characteristics. Extensive testing recommended.
Q: How do I optimize ML coefficients?
A: Systematic approach:
Collect data on 50-100+ breakouts
Note which succeeded/failed
Analyze feature values for each
Identify correlations
Adjust coefficients to emphasize predictive features
Validate on different time period
Iterate
Alternatively, use regression analysis on historical breakout data if you have programming skills.
Q: What does "Stopped Out" mean for reversals?
A: Reversal trade hit its stop loss:
Price moved against reversal position
Original breakout may have resumed
Trade closed at loss
Lines and labels gray out
Trade State → 7
This is part of normal trading - not all reversals succeed.
Q: Can I change ORB timeframe intraday?
A: ORB timeframe setting affects the next day's ORB. Current day's ORB remains fixed. To see different ORB sizes, you would need to change setting and wait for next session.
Q: Why do rejected breakouts show an 'X'?
A: When "Mark Rejected Breakout Candidates" enabled:
Small 'X' appears when ML filter rejects a breakout
Shows where system prevented a signal
Useful for model calibration
Helps evaluate if ML making good decisions
You can disable this marker if it creates clutter.
ADVANCED CONCEPTS
1. Adaptive vs. Static ORB:
Traditional ORB uses fixed time windows. This system adds adaptability through:
ML probability scoring (adapts to current conditions)
Multiple session ORBs (adapts to global markets)
Failed breakout detection (adapts when setup fails)
Real-time trade management (adapts as trade develops)
This creates a more dynamic approach than simple static levels.
2. Confluence Scoring:
System internally calculates confluence (agreement of factors):
Breakout direction
Volume confirmation
VWAP alignment
ML probability scores
Gap direction
Momentum strength
Higher confluence typically results in higher grade (A+, A, B+, etc.).
3. Trade State Machine:
The 8-state system provides complete trade lifecycle:
State 0: Waiting → No setup
State 1: Breakout → Monitoring for failure
State 2: Failed → (transition state)
State 3: Reversal Active → In counter-trend position
State 4: T1 Hit → First target reached
State 5: T2 Hit → Second target reached
State 6: T3 Hit → Third target reached (full success)
State 7: Stopped → Hit stop loss
State 8: Complete → Trade resolved
Each state has specific visual properties and logic.
4. Real-Time Performance Attribution:
MFE/MAE tracking provides insight:
Maximum Favorable Excursion (MFE):
Best price achieved during trade
Shows potential if optimal exit used
Educational metric for exit strategy analysis
Maximum Adverse Excursion (MAE):
Worst price against position
Shows drawdown during trade
Helps evaluate stop placement
These appear in Narrative Dashboard during active reversals.
THEORETICAL FOUNDATIONS
Why Opening Range Matters:
Several theories support ORB methodology:
1. Information Incorporation:
Opening period represents initial consensus on overnight news and pre-market sentiment. Range boundaries may reflect this information.
2. Order Flow:
Institutional traders often execute during opening period, establishing supply/demand zones.
3. Behavioral Finance:
Traders psychologically anchor to opening range levels. Self-fulfilling prophecy may strengthen these levels.
4. Market Microstructure:
Opening auction establishes price discovery. Breaks beyond may indicate new information or momentum.
Academic Note: While ORB is widely used, academic evidence on its effectiveness varies. Like all technical analysis, it should be evaluated empirically for each specific application.
Machine Learning in Trading:
This system uses supervised learning (logistic regression):
Advantages:
Interpretable (can see feature weights)
Fast calculation
Probabilistic output
Well-understood mathematically
Limitations:
Assumes linear relationships
Requires feature engineering
Needs periodic retraining
Not adaptive to regime changes automatically
More sophisticated ML (neural networks, ensemble methods) could potentially improve performance but at cost of interpretability and speed.
Failed Breakouts & Market Psychology:
Failed breakout trading exploits several concepts:
1. Stop Hunting:
Large players may push price to trigger stops, then reverse.
2. False Breakouts:
Insufficient conviction leads to failed breakout and quick reversal.
3. Trapped Traders:
Those who entered breakout now forced to exit, creating momentum opposite direction.
4. Mean Reversion:
After failed directional attempt, price may revert to range or beyond.
These are theoretical frameworks, not guaranteed patterns.
BEST PRACTICES - EDUCATIONAL SUGGESTIONS
1. Paper Trade Extensively:
Before live trading:
Test on historical data
Forward test in real-time (paper)
Evaluate statistics over 50+ occurrences
Understand system behavior in different conditions
2. Start with Simple Mode:
Initial learning:
Use Simple or Standard mode
Focus on primary ORB only
Master basic breakout interpretation
Add features incrementally
3. Optimize ML Coefficients:
If using ML filter:
Backtest on your specific instrument
Note which features predictive
Adjust coefficients systematically
Validate on out-of-sample data
Re-optimize periodically
4. Respect Risk Management:
Always:
Define maximum risk per trade (1-2% recommended)
Use system-provided stops
Size positions appropriately
Never override stops wider
Keep statistics of your actual trading
b]5. Understand Context:
Consider:
Is it a trending or ranging market?
What's the day type developing?
Is volume confirming moves?
Are you aligned with VWAP?
What's the overall market condition?
Context may inform which setups to emphasize.
6. Journal Results:
Track:
Which setup types work best for you
Your execution quality
Emotional responses to different scenarios
Missed opportunities and why
Losses and lessons
Systematic journaling improves over time.
FINAL EDUCATIONAL SUMMARY
ORB Fusion ML combines traditional Opening Range Breakout methodology with modern
enhancements:
✓ ML Probability Scoring: Filters breakouts using logistic regression
✓ Failed Breakout Detection: Automatic reversal trade generation
✓ Complete Trade Management: Real-time tracking with visual updates
✓ Multi-Session Support: Asian, London, NY ORBs for global markets
✓ Institutional Reference: VWAP and Initial Balance integration
✓ Comprehensive Statistics: Track performance across breakout types
✓ Full Customization: Three display modes, extensive visual options
✓ Educational Transparency: Dashboard shows all relevant metrics
This is an educational tool demonstrating advanced ORB concepts.
Critical Reminders:
The system:
✓ Identifies potential ORB breakout and reversal setups
✓ Provides ML-based probability estimates
✓ Tracks trades through complete lifecycle
✓ Offers comprehensive performance statistics
Users must understand:
✓ No system guarantees profitable results
✓ Past performance does not predict future results
✓ All indicators require proper risk management
✓ Paper trading essential before live trading
✓ Market conditions change unpredictably
✓ This is educational software, not financial advice
Success requires: Proper education, disciplined risk management, realistic expectations, personal responsibility for all trading decisions, and understanding that indicators are tools, not crystal balls.
For Educational Use Only - ORB Fusion ML Development Staff
⚠️ FINAL DISCLAIMER
This indicator and documentation are provided strictly for educational and informational purposes.
NOT FINANCIAL ADVICE: Nothing in this guide constitutes financial advice, investment advice, trading advice, or any recommendation to buy or sell any security or engage in any trading strategy.
NO GUARANTEES: No representation is made that any account will or is likely to achieve profits or losses similar to those shown. The statistics, probabilities, and examples are from historical backtesting and do not represent actual trading results.
SUBSTANTIAL RISK: Trading involves substantial risk of loss and is not suitable for every investor. The high degree of leverage can work against you as well as for you.
YOUR RESPONSIBILITY: You are solely responsible for your own trading decisions. You should conduct your own research, perform your own analysis, paper trade extensively, and consult with qualified financial advisors before making any trading decisions.
NO LIABILITY: The developers, contributors, and distributors of this indicator disclaim all liability for any losses or damages, direct or indirect, that may result from use of this indicator or reliance on any information provided.
PAPER TRADE FIRST: Users are strongly encouraged to thoroughly test this indicator in a paper trading environment before risking any real capital.
By using this indicator, you acknowledge that you have read this disclaimer, understand the substantial risks involved in trading, and agree that you are solely responsible for your own trading decisions and their outcomes.
Educational Software Only | Trade at Your Own Risk | Not Financial Advice
Taking you to school. — Dskyz, Trade with insight. Trade with anticipation.

Major Crypto Relative Strength Portfolio System Majors RSPS - Relative Strength Portfolio System for Major Cryptocurrencies
Overview
Majors RSPS (Relative Strength Portfolio System) is an advanced portfolio allocation indicator that combines relative strength analysis, trend consensus, and macro risk factors to dynamically allocate capital across major cryptocurrency assets. The system leverages the NormalizedIndicators Library to evaluate both absolute trends and relative performance, creating an adaptive portfolio that automatically adjusts exposure based on market conditions.
This indicator is designed for portfolio managers, asset allocators, and systematic traders who want a data-driven approach to cryptocurrency portfolio construction with automatic rebalancing signals.
🎯 Core Concept
What is RSPS?
RSPS (Relative Strength Portfolio System) evaluates each asset on two key dimensions:
Relative Strength: How is the asset performing compared to other major cryptocurrencies?
Absolute Trend: Is the asset itself in a bullish trend?
Assets that show both strong relative performance AND positive absolute trends receive higher allocations. Weak performers are automatically filtered out, with capital reallocated to cash or stronger assets.
Dual-Layer Architecture
Layer 1: Majors Portfolio (Orange Zone)
Evaluates 14 major cryptocurrency assets
Calculates relative strength against all other majors
Applies trend filters to ensure absolute momentum
Dynamically allocates capital based on comparative strength
Layer 2: Cash/Risk Position (Navy Zone)
Evaluates macro risk factors and market conditions
Determines optimal cash allocation
Acts as a risk-off mechanism during adverse conditions
Provides downside protection through dynamic cash holdings
📊 Tracked Assets
Major Cryptocurrencies (14 Assets)
BTC - Bitcoin (Benchmark L1)
ETH - Ethereum (Smart Contract L1)
SOL - Solana (High-Performance L1)
SUI - Sui (Move-Based L1)
TRX - Tron (Payment-Focused L1)
BNB - Binance Coin (Exchange L1)
XRP - Ripple (Payment Network)
FTM - Fantom (DeFi L1)
CELO - Celo (Mobile-First L1)
TAO - Bittensor (AI Network)
HYPE - Hyperliquid (DeFi Exchange)
HBAR - Hedera (Enterprise L1)
ADA - Cardano (Research-Driven L1)
THETA - Theta (Video Network)
🔧 How It Works
Step 1: Relative Strength Calculation
For each asset, the system calculates relative strength by:
RSPS Score = Average of:
- Asset/BTC trend consensus
- Asset/ETH trend consensus
- Asset/SOL trend consensus
- Asset/SUI trend consensus
- ... (all 14 pairs)
- Asset's absolute trend consensus
Key Logic:
Each pair is evaluated using the eth_4d_cal() calibration from NormalizedIndicators
If an asset's absolute trend is extremely weak (≤ 0.1), it receives a penalty score (-0.5)
Otherwise, it gets the average of all its relative strength comparisons
Step 2: Trend Filtering
Assets must pass a trend filter to receive allocation:
Trend Score = Average of:
- Asset/BTC trend (filtered for positivity)
- Asset/ETH trend (filtered for positivity)
- Asset's absolute trend (filtered for positivity)
Only positive values contribute to the trend score, ensuring bearish assets don't receive allocation.
Step 3: Portfolio Allocation
Capital is allocated proportionally based on filtered RSPS scores:
Asset Allocation % = (Asset's Filtered RSPS Score / Sum of All Filtered Scores) × Main Portfolio %
Example:
SOL filtered score: 0.6
BTC filtered score: 0.4
All others: 0
Total: 1.0
SOL receives: (0.6 / 1.0) × Main% = 60% of main portfolio
BTC receives: (0.4 / 1.0) × Main% = 40% of main portfolio
Step 4: Cash/Risk Allocation
The system evaluates macro conditions across 6 factors:
Inverse Major Crypto Trends (40% weight)
When BTC, ETH, SOL, SUI, DOGE, etc. trend down → Cash allocation increases
Evaluates total market cap trends (TOTAL, TOTAL2, OTHERS)
Stablecoin Dominance (10% weight)
USDC dominance vs. major crypto dominances
Higher stablecoin dominance → Higher cash allocation
MVRV Ratios (10% weight)
BTC and ETH Market Value to Realized Value
High MVRV (overvaluation) → Higher cash allocation
BTC/ETH Ratio (15% weight)
Relative performance between two market leaders
Indicates market phase (BTC dominance vs. alt season)
Active Address Ratios (5% weight)
USDC active addresses vs. BTC/ETH active addresses
Network activity comparison
Macro Indicators (15% weight)
Global currency circulation (USD, EUR, CNY, JPY)
Treasury yield curve (10Y-2Y)
High yield spreads
Central bank balance sheets and money supply
Cash Allocation Formula:
Cash % = (Sum of Risk Factors × 0.5) / (Risk Factors + Majors TPI)
When risk factors are elevated, cash allocation increases, reducing exposure to volatile assets.
📈 Visual Components
Orange Zone (Majors Portfolio)
Fill: Light orange area showing aggregate portfolio strength
Line: Average trend power index (TPI) of allocated assets
Baseline: 0 level (neutral)
Interpretation:
Above 0: Bullish allocation environment
Rising: Strengthening portfolio momentum
Falling: Weakening portfolio momentum
Below 0: No allocation (100% cash)
Navy Zone (Cash Position)
Fill: Navy blue area showing cash allocation strength
Line: Risk-adjusted cash allocation signal
Baseline: 0 level
Interpretation:
Higher navy zone: Elevated risk-off signal → More cash
Lower navy zone: Risk-on environment → Less cash
Zero: No cash allocation (100% invested)
Performance Line (Orange/Blue)
Orange: Main portfolio allocation dominant (risk-on mode)
Blue: Cash allocation dominant (risk-off mode)
Tracks: Cumulative portfolio returns with dynamic rebalancing
Allocation Table (Bottom Left)
Shows real-time portfolio composition:
ColumnDescriptionAssetCryptocurrency nameRSPS ValuePercentage allocation (of main portfolio)CashDollar amount (if enabled)
Color Coding:
Orange: Active allocation
Gray: Weak signal (borderline)
Blue: Cash position
Missing: No allocation (filtered out)
⚙️ Settings & Configuration
Required Setup
Chart Symbol
MUST USE: INDEX:BTCUSD or similar major crypto index
Recommended Timeframe: 1D (Daily) or 4D (4-Day)
Why: System needs price data for all 14 majors, BTC provides stable reference
Hide Chart Candles
For clean visualization:
Right-click on chart
Select "Hide Symbol" or set candle opacity to 0
This allows the indicator fills and table to be clearly visible
User Inputs
plot_table (Default: true)
Enable/disable the allocation table
Set to false if you only want the visual zones
use_cash (Default: false)
Enable portfolio dollar value calculations
Shows actual dollar allocations per asset
cash (Default: 100)
Total portfolio size in dollars/currency units
Used when use_cash is enabled
Example: Set to 10000 for a $10,000 portfolio
💡 Interpretation Guide
Entry Signals
Strong Allocation Signal:
✓ Orange zone elevated (> 0.3)
✓ Navy zone low (< 0.2)
✓ Performance line orange
✓ Multiple assets in allocation table
→ Action: Deploy capital to allocated assets per table percentages
Risk-Off Signal:
✓ Orange zone near zero
✓ Navy zone elevated (> 0.4)
✓ Performance line blue
✓ Few or no assets in table (high cash %)
→ Action: Reduce exposure, increase cash holdings
Rebalancing Triggers
Monitor the allocation table for changes:
New assets appearing: Add to portfolio
Assets disappearing: Remove from portfolio
Percentage changes: Rebalance existing positions
Cash % changes: Adjust overall exposure
Market Regime Detection
Risk-On (Bull Market):
Orange zone high and rising
Navy zone minimal
Many assets allocated (8-12)
High individual allocations (15-30% each)
Risk-Off (Bear Market):
Orange zone near zero or negative
Navy zone elevated
Few assets allocated (0-3)
Cash allocation dominant (70-100%)
Transition Phase:
Both zones moderate
Medium number of assets (4-7)
Balanced cash/asset allocation (40-60%)
🎯 Trading Strategies
Strategy 1: Pure RSPS Following
1. Check allocation table daily
2. Rebalance portfolio to match percentages
3. Follow cash allocation strictly
4. Review weekly, act on significant changes (>5%)
Best For: Systematic portfolio managers, passive allocators
Strategy 2: Threshold-Based
Entry Rules:
- Orange zone > 0.4 AND Navy zone < 0.3
- At least 5 assets in allocation table
- Total non-cash allocation > 60%
Exit Rules:
- Orange zone < 0.1 OR Navy zone > 0.5
- Fewer than 3 assets allocated
- Cash allocation > 70%
Best For: Active traders wanting clear rules
Strategy 3: Relative Strength Overlay
1. Use RSPS for broad allocation framework
2. Within allocated assets, overweight top 3 performers
3. Scale position sizes by RSPS score
4. Use individual asset charts for entry/exit timing
Best For: Discretionary traders with portfolio focus
Strategy 4: Risk-Adjusted Position Sizing
For each allocated asset:
Position Size = Base Position × (Asset's RSPS Score / Max RSPS Score) × (1 - Cash Allocation)
Example:
- $10,000 portfolio
- SOL RSPS: 0.6 (highest)
- BTC RSPS: 0.4
- Cash allocation: 30%
SOL Size = $10,000 × (0.6/0.6) × (1-0.30) = $7,000
BTC Size = $10,000 × (0.4/0.6) × (1-0.30) = $4,667
Cash = $10,000 × 0.30 = $3,000
Best For: Risk-conscious allocators
📊 Advanced Usage
Multi-Timeframe Confirmation
Use on multiple timeframes for robust signals:
1D Chart: Tactical allocation (daily rebalancing)
4D Chart: Strategic allocation (weekly review)
Strong Confirmation:
- Both timeframes show same top 3 assets
- Both show similar cash allocation levels
- Orange zones aligned on both
Weak/Conflicting:
- Different top performers
- Diverging cash allocations
→ Wait for alignment or use shorter timeframe
Sector Rotation Analysis
Group assets by type and watch rotation:
L1 Dominance: BTC, ETH, SOL, SUI, ADA high → Layer 1 season
Alt L1s: TRX, FTM, CELO rising → Alternative platform season
Specialized: TAO, THETA, HYPE strong → Niche narrative season
Payment/Stable: XRP, BNB allocation → Risk reduction phase
Divergence Trading
Bullish Divergence:
Navy zone declining (less risk-off)
Orange zone flat or slightly rising
Few assets still allocated but strengthening
→ Early accumulation signal
Bearish Divergence:
Orange zone declining
Navy zone rising
Asset count decreasing in table
→ Distribution/exit signal
Performance Tracking
The performance line (overlay) shows cumulative strategy returns:
Compare to BTC/ETH: Is RSPS outperforming?
Drawdown analysis: How deep are pullbacks?
Correlation: Does it track market or provide diversification?
🔬 Technical Details
Data Sources
Price Data:
COINEX: Primary exchange for alt data
CRYPTO: Alternative price feeds
INDEX: Aggregated index prices (recommended for BTC)
Macro Data:
Dominance metrics (SUI.D, BTC.D, etc.)
MVRV ratios (on-chain valuation)
Active addresses (network activity)
Global money supply and macro indicators
Calculation Methodology
RSPS Scoring:
For each asset, calculate 14 relative trends (vs. all others)
Calculate asset's absolute trend
Average all 15 values
Apply penalty filter for extremely weak trends (≤ 0.1)
Trend Consensus:
Uses eth_4d_cal() from NormalizedIndicators library
Combines 8 normalized indicators per measurement
Returns value from -1 (bearish) to +1 (bullish)
Performance Calculation:
Daily Return = Σ(Asset ROC × Asset Allocation)
Cumulative Performance = Previous Perf × (1 + Daily Return / 100)
Assumes perfect rebalancing and no slippage (theoretical performance).
Filtering Logic
filter() function:
pinescriptfilter(input) => input >= 0 ? input : 0
This zero-floor filter ensures:
Only positive trend values contribute to allocation
Bearish assets receive 0 weight
No short positions or inverse allocations
Anti-Manipulation Safeguards
Null Handling:
All values wrapped in nz() to handle missing data
Prevents calculation errors from data gaps
Normalization:
Allocations always sum to 100%
Prevents over/under-allocation
Conditional Logic:
Assets need positive values on multiple metrics
Single metric cannot drive allocation alone
⚠️ Important Considerations
Required Timeframes
1D (Daily): Recommended for most users
4D (4-Day): More stable, fewer rebalances
Other timeframes: Use at your own discretion, may require recalibration
Data Requirements
Needs INDEX:BTCUSD or equivalent major crypto symbol
All 14 tracked assets must have available data
Macro indicators require specific TradingView data feeds
Rebalancing Frequency
System provides daily allocation updates
Practical rebalancing: Weekly or on significant changes (>10%)
Consider transaction costs and tax implications
Performance Notes
Theoretical returns: No slippage, fees, or execution delays
Backtest carefully: Validate on your specific market conditions
Past performance: Does not guarantee future results
Risk Warnings
⚠️ High Concentration Risk: May allocate heavily to 1-3 assets
⚠️ Volatility: Crypto markets are inherently volatile
⚠️ Liquidity: Some allocated assets may have lower liquidity
⚠️ Correlation: All assets correlated to BTC/ETH to some degree
⚠️ System Risk: Relies on continued availability of data feeds
Not Financial Advice
This indicator is a tool for analysis and research. It does not constitute:
Investment advice
Portfolio management services
Trading recommendations
Guaranteed returns
Always perform your own due diligence and risk assessment.
🎓 Use Cases
For Portfolio Managers
Systematic allocation framework
Objective rebalancing signals
Risk-adjusted exposure management
Performance tracking vs. benchmarks
For Active Traders
Identify strongest assets to focus trading on
Gauge overall market regime (risk-on/off)
Time entry/exit for portfolio shifts
Complement technical analysis with allocation data
For Institutional Allocators
Quantitative portfolio construction
Multi-asset exposure optimization
Drawdown management through cash allocation
Compliance-friendly systematic approach
For Researchers
Study relative strength dynamics in crypto markets
Analyze correlation between majors
Test macro factor impact on crypto allocations
Develop derived strategies and signals
🔧 Setup Checklist
✅ Chart Configuration
Set chart to INDEX:BTCUSD
Set timeframe to 1D or 4D
Hide chart candles for clean visualization
Add indicator from library
✅ Indicator Settings
Enable plot_table (see allocation table)
Set use_cash if tracking dollar amounts
Input your portfolio size in cash parameter
✅ Monitoring Setup
Bookmark chart for daily review
Set alerts for major allocation changes (optional)
Create spreadsheet to track allocations (optional)
Establish rebalancing schedule (weekly recommended)
✅ Validation
Verify all 14 assets appear in table (when allocated)
Check that percentages sum to ~100%
Confirm performance line is tracking
Test cash allocation calculation if enabled
📋 Quick Reference
Signal Interpretation
ConditionOrange ZoneNavy ZoneActionStrong BullHigh (>0.4)Low (<0.2)Full allocationModerate BullMid (0.2-0.4)Low-MidStandard allocationNeutralLow (0.1-0.2)Mid (0.3-0.4)Balanced allocationModerate BearVery Low (<0.1)Mid-HighReduce exposureStrong BearZero/NegativeHigh (>0.5)High cash/exit
Rebalancing Thresholds
Change TypeThresholdActionIndividual asset±5%Consider rebalanceIndividual asset±10%Strongly rebalanceCash allocation±10%Adjust exposureAsset entry/exitAnyAdd/remove position
Color Legend
Orange: Main portfolio strength/allocation
Navy: Cash/risk-off allocation
Blue text: Cash position in table
Orange text: Active asset allocation
Gray text: Weak/borderline allocation
White: Headers and labels
🚀 Getting Started
Beginner Path
Add indicator to INDEX:BTCUSD daily chart
Hide candles for clarity
Enable plot_table to see allocations
Check table daily, note top 3-5 assets
Start with small allocation, observe behavior
Gradually increase allocation as you gain confidence
Intermediate Path
Set up on both 1D and 4D charts
Enable use_cash with your portfolio size
Create tracking spreadsheet
Implement weekly rebalancing schedule
Monitor divergences between timeframes
Compare performance to buy-and-hold BTC
Advanced Path
Modify code to add/remove tracked assets
Adjust relative strength calculation methodology
Customize cash allocation factors and weights
Integrate with portfolio management platform
Develop algorithmic rebalancing system
Create alerts for specific allocation conditions
📖 Additional Resources
Related Indicators
NormalizedIndicators Library: Core calculation engine
Individual asset trend indicators for deeper analysis
Macro indicator dashboards for cash allocation factors
Complementary Analysis
On-chain metrics (MVRV, active addresses, etc.)
Order book liquidity for execution planning
Correlation matrices for diversification analysis
Volatility indicators for position sizing
Learning Materials
Study relative strength portfolio theory
Research tactical asset allocation strategies
Understand crypto market cycles and phases
Learn about risk management in volatile assets
🎯 Key Takeaways
✅ Systematic allocation across 14 major cryptocurrencies
✅ Dual-layer approach: Asset selection + Cash management
✅ Relative strength focused: Invests in comparatively strong assets
✅ Trend filtering: Only allocates to assets in positive trends
✅ Dynamic rebalancing: Automatically adjusts to market conditions
✅ Risk-managed: Increases cash during adverse conditions
✅ Transparent methodology: Clear calculation logic
✅ Practical visualization: Easy-to-read table and zones
✅ Performance tracking: See cumulative strategy returns
✅ Highly customizable: Adjust assets, weights, and factors
📋 License
This code is subject to the Mozilla Public License 2.0 at mozilla.org
Majors RSPS transforms complex multi-asset portfolio management into a systematic, data-driven process. By combining relative strength analysis with trend consensus and macro risk factors, it provides traders and portfolio managers with a robust framework for navigating cryptocurrency markets with discipline and objectivity.WiederholenClaude kann Fehler machen. Bitte überprüfen Sie die Antworten. Sonnet 4.5

Gold Sniper MGC1! - M30 Precision vPOCThis Pine Script, titled "Gold Sniper MGC1! - M30 Precision vPOC," is a high-precision intraday trading tool designed specifically for Micro Gold (MGC1!) futures. It integrates Market Profile and Volume Profile logic to identify key institutional levels across various trading sessions.
Core Functionality
The script identifies and plots the Volume Point of Control (vPOC)—the price level with the highest traded volume—for specific time windows:
P.vPOC (Previous vPOC): Calculated using a Daily VWAP sync to align perfectly with institutional data from the previous day.
vPOC Today: Tracks the developing Point of Control for the current global session (18:00 - 17:00).
Killzone vPOCs: Specifically isolates the highest volume price levels for the Asia (02h-08h), London (08h-14h), and New York (14h-17h) sessions.
Key Technical Features
Institutional Alignment: By utilizing request.security and hl2 median price calculations on a 30-minute basis, the script filters out market noise and aligns with the structural levels used by "Smart Money".
Dynamic Labels (Vignettes): Each level is projected to the right of the price action with a color-coded label. These labels dynamically display both the Level Name and the Exact Price (to two decimal places), facilitating rapid order entry.
Visual Hierarchy:
Black (Solid): Previous Day's Value (P.vPOC).
White (Dotted): Current Day's Developing Value.
Gold/Cyan/Orange: Specific Killzone session values.
Strategic Application
This script serves as the "Map" for the Gold Sniper MGC1! strategy. Traders use these levels to identify Liquidity Sweeps or Market Structure Shifts (MSS). When the price interacts with these vPOCs, it often signals institutional rejection or acceptance, providing high-probability entry points for intraday "Sniper" setups.

Liquidity Sweep Guardian (Universal % or point based)
Liquidity Sweep Guardian - Complete User Guide
## Overview
The **Liquidity Sweep Guardian** is a visual warning system designed to prevent premature counter-trend trades (fades) near Previous Day High (PDH) and Previous Day Low (PDL) levels. This indicator helps you avoid one of the most common trading mistakes: fading too early before liquidity sweeps complete.
---
## 🎯 Core Trading Principle
### **THE GOLDEN RULE: Don't Fade Until It's Unlocked**
Price often **accelerates into key levels** to sweep liquidity before reversing. Trading against this momentum is extremely dangerous.
**The Process:**
1. **Danger Zone** (Red/White Box) = ⚠️ **DO NOT FADE** - Sweep likely incoming
2. **Sweep Occurs** (Triangle marker appears) = Price penetrates the level
3. **Reclaim Happens** (Price returns above/below level) = Level is tested
4. **🔓 UNLOCKED** (Gold border, green label) = **NOW you may CONSIDER a fade**
> **Important:** "UNLOCKED" means you may now *consider* a fade setup. It is NOT a trade signal itself. You still need your entry confirmation, risk management, and trade plan.
---
## 📊 Visual Elements Explained
### 1. **Danger Zone Boxes (Red Border by Default)**
**Two types of zones around PDH/PDL:**
- **Outer Danger Zone** (White fill): ±75pts (or 0.30%) around the level
- Indicates proximity to a key level where sweeps commonly occur
- Yellow/cautious trading zone
- **Inner Critical Zone** (Black fill): ±25pts (or 0.10%) around the level
- Highest probability area for liquidity sweep traps
- Avoid fading here at all costs
**What to do:**
- When price enters these zones, **wait and watch**
- Do not initiate counter-trend positions
- Allow the sweep to play out
### 2. **Unlocked Zones (Gold Border #ffeb3b)**
When a zone turns **gold/yellow** with green fill:
- The level has been swept AND reclaimed
- The liquidity grab is complete
- You may now look for fade opportunities with proper confirmation
### 3. **PDH/PDL Lines**
- **PDH Line** (Red): Previous Day High with price label
- **PDL Line** (Green): Previous Day Low with price label
- These are your key reference levels for the session
### 4. **Sweep Labels**
**Triangle Markers (SWEEP):**
- **Green Triangle** = Clean sweep (10-25pts penetration)
- **Orange Triangle** = Extended sweep (25-50pts penetration)
- **Red Triangle** = Deep penetration (50+ pts) - likely continuation, not reversal
**Warning Labels:**
- **⚠️ DEEP CONTINUATION?** = Penetration too deep, probably NOT a reversal setup
**Unlock Labels:**
- **🔓 LONG UNLOCKED** = PDL swept and reclaimed, may consider long fades
- **🔓 SHORT UNLOCKED** = PDH swept and reclaimed, may consider short fades
---
## ⚙️ Settings Guide
### **Calculation Mode**
**Use Percentage Mode (Default: ON)**
- ✅ **Enabled**: Universal mode - works on NQ, ES, RTY, stocks, crypto, forex
- ❌ **Disabled**: Fixed points mode - for specific instruments only
**When to use each:**
- **Percentage Mode**: Trading multiple instruments, or instruments with varying price levels
- **Fixed Points Mode**: Single instrument focus (e.g., only trading NQ at current levels)
### **Danger Zone Settings**
**Percentage Mode (Default for Universal Use):**
- **Danger Zone**: 0.30% each side (≈75pts on NQ@25,000)
- **Critical Zone**: 0.10% each side (≈25pts on NQ@25,000)
**Fixed Points Mode (For NQ Specifically):**
- **Danger Zone**: 75 points each side
- **Critical Zone**: 25 points each side
**Adjustment Tips:**
- For more volatile instruments: Increase percentages/points
- For less volatile instruments: Decrease percentages/points
- For higher timeframes: Use wider zones
- For lower timeframes: Use tighter zones
### **Sweep Classification**
**What defines a "real" sweep:**
- **Minimum**: 10pts / 0.04% - Shallow penetration may not grab enough liquidity
- **Optimal**: 10-25pts / 0.04-0.10% - "Goldilocks zone" for reversal setups
- **Extended**: 25-50pts / 0.10-0.20% - Deeper sweep, less reliable
- **Continuation**: 50+pts / 0.20%+ - Too deep, likely NOT reversing
**Max Bars for Reclaim**: 5 bars (default)
- Price should reclaim the level relatively quickly
- If it takes too long, the sweep may have failed
### **Visual Customization**
**Box Settings:**
- **Left Extension**: 60 bars (how far back the box extends)
- **Right Extension**: 50 bars (how far forward the box extends)
**Toggle Options:**
- Show/Hide Danger Zone Boxes
- Show/Hide PDH/PDL Lines
- Show/Hide Price Labels on lines
- Show/Hide Sweep Labels
- Show/Hide Unlock Labels
### **Color Customization**
All colors are fully customizable:
- Danger Zone Fill & Border
- Critical Zone Fill & Border
- Unlocked Zone Fill & Border
- PDH/PDL Line Colors
- PDH/PDL Label Colors
- Border Widths (1-5 pixels)
- Line Widths (1-5 pixels)
---
## 🎓 Trading Strategy Examples
### **Example 1: Long Setup at PDL**
1. **Morning**: Price approaches PDL (danger zone appears)
2. **Don't Fade Yet**: Price enters critical zone - resist urge to buy
3. **Sweep**: Price drops 15pts below PDL (green triangle appears)
4. **Reclaim**: Price closes back above PDL within 3 bars
5. **🔓 UNLOCKED**: Gold border + "LONG UNLOCKED" label appears
6. **Trade Setup**: Now look for bullish confirmation (order flow, structure, etc.)
### **Example 2: Avoiding a Trap at PDH**
1. **Afternoon**: Price rallies into PDH danger zone
2. **Temptation**: You want to short here (it "looks toppy")
3. **Sweep**: Price breaks 50pts above PDH (red triangle + ⚠️ warning)
4. **Continuation**: Deep penetration suggests continuation, not reversal
5. **Result**: No unlock occurs, price keeps running higher - trap avoided!
### **Example 3: Failed Unlock (No Trade)**
1. Price sweeps PDL by 12pts (green triangle)
2. Price struggles to reclaim PDL, stays below for 10+ bars
3. No "UNLOCKED" label appears
4. **Correct Action**: Do not fade - sweep failed to reclaim
---
## 📱 Alerts
The indicator includes built-in alerts for:
- **Entering Danger Zones**: Get warned when price approaches PDH/PDL
- **Sweep Detection**: Know immediately when a level is swept
- **Unlock Signals**: Get notified when fade setups become available
- **Continuation Warnings**: Alert when penetration suggests continuation
**To Set Alerts:**
1. Right-click indicator → "Add Alert"
2. Select desired alert condition
3. Configure notification preferences
---
## ⚠️ Important Disclaimers
### **What This Indicator IS:**
✅ A visual warning system to prevent premature fades
✅ A tool to identify when liquidity sweeps have completed
✅ A framework for counter-trend trade timing
### **What This Indicator IS NOT:**
❌ A complete trading system
❌ An entry signal generator
❌ A guarantee of trade success
❌ A substitute for proper risk management
### **Always Remember:**
- "UNLOCKED" = You may CONSIDER a fade (not a signal to trade)
- You still need your own entry confirmation
- You still need proper stop placement
- You still need position sizing and risk management
- Not every unlock leads to a successful trade
- Market context and order flow still matter
---
## 🔧 Recommended Settings by Instrument
### **NQ (Nasdaq-100 E-mini Futures)**
- Mode: Percentage or Fixed Points
- Percentage: 0.30% / 0.10% (default)
- Fixed Points: 75pts / 25pts (default)
### **ES (S&P 500 E-mini Futures)**
- Mode: Percentage
- Danger: 0.25% / Critical: 0.08%
- Or Fixed Points: 15pts / 5pts
### **RTY (Russell 2000 E-mini Futures)**
- Mode: Percentage
- Danger: 0.35% / Critical: 0.12%
- Or Fixed Points: 8pts / 3pts
### **Stocks (High Volume Large Caps)**
- Mode: Percentage (recommended)
- Danger: 0.20-0.40% / Critical: 0.08-0.15%
- Adjust based on ATR and volatility
### **Crypto (BTC, ETH)**
- Mode: Percentage (essential)
- Danger: 0.40-0.60% / Critical: 0.15-0.20%
- Higher volatility requires wider zones
---
## 💡 Pro Tips
1. **Use on Higher Timeframes**: Works best on 5min, 15min, 1hr charts
2. **Combine with Order Flow**: Use with footprint/delta for confirmation
3. **Watch Volume**: Strong volume on sweep = better reversal potential
4. **Consider Time of Day**: Sweeps during RTH often more reliable
5. **Multiple Timeframes**: Check if higher TF also shows unlock
6. **Don't Force Trades**: Not every session produces clean setups
7. **Journal Results**: Track which unlock types work best for you
8. **Respect Continuation Signals**: When indicator says "too deep," listen
---
## 🆘 Troubleshooting
**Q: Box isn't showing up**
A: Check that "Show Danger Zone Boxes" is enabled in Visual Settings
**Q: No price on labels**
A: Enable "Show Price Labels on Lines" in Visual Settings
**Q: Zones seem too tight/wide**
A: Adjust Danger Zone % or points based on current volatility
**Q: Getting too many/too few unlocks**
A: Adjust sweep classification thresholds (min/max penetration)
**Q: Want thicker/thinner lines**
A: Adjust line widths in "PDH/PDL Line Colors" section
**Q: Colors not matching my chart theme**
A: Fully customize all colors in the color settings groups
---
## 📚 Additional Resources
- Study price action around PDH/PDL on your instruments
- Learn about liquidity sweeps and stop hunts
- Understand market structure and order flow
- Practice identifying setups on replay/historical data
- Keep a trading journal of unlock scenarios
---
*Remember: The best trade is often the one you don't take. This indicator helps you avoid the trades you shouldn't take, so you can focus on the ones you should.*

Order Flow Signals - Alphaomega18═══════════════════════════════════════════════════════════════════════════════
ORDER FLOW SIGNALS - TRADINGVIEW PUBLICATION (ENGLISH)
Created by Alphaomega18
═══════════════════════════════════════════════════════════════════════════════
📌 PUBLICATION TITLE
═══════════════════════════════════════════════════════════════════════════════
Order Flow Signals - Absorptions & CVD Divergences - Alphaomega18
📝 COMPLETE DESCRIPTION
═══════════════════════════════════════════════════════════════════════════════
🎯 DETECT INSTITUTIONAL MOVES IN REAL-TIME
Order Flow Signals is an advanced order flow analysis indicator that displays institutional absorption signals, hidden CVD divergences, and extreme buy/sell pressure directly on your chart.
Fully customizable with 9 configurable colors, adjustable label sizes, and extreme absorption detection (300%+), this indicator allows you to trade WITH institutions, not against them.
🔥 THE PROBLEM IT SOLVES
Have you ever:
✗ Taken a technically perfect setup but got stopped out?
✗ Seen price reject a support/resistance but go the other way?
✗ Entered counter-trend without knowing institutions were accumulating?
✗ Missed big moves due to lack of confirmation?
Order Flow Signals solves these problems by revealing what smart money is REALLY doing behind each candle.
📊 SIGNALS DISPLAYED ON CHART
🔷 ABSORPTIONS (💎 Diamonds)
Institutions absorb order flow when volume is high BUT price doesn't move in the expected direction.
💎 BULLISH ABSORPTION (Cyan)
→ Volume spike + bearish candle + positive delta
→ Institutions are BUYING despite selling pressure
→ Strong accumulation signal
💎 BEARISH ABSORPTION (Orange)
→ Volume spike + bullish candle + negative delta
→ Institutions are SELLING despite buying pressure
→ Strong distribution signal
🔥 EXTREME ABSORPTIONS (Fuchsia Fire)
→ Volume > 300% of average (customizable)
→ MASSIVE institutional activity
→ Ultra-rare and ultra-strong signals
→ Indicates major moves in preparation
🔺 DIVERGENCES (▲ Green Triangles)
Price makes lower lows BUT CVD makes higher lows
→ Hidden accumulation in progress
→ Bullish reversal signal likely
→ Confirms your BUY entries
🔻 DIVERGENCES (▼ Red Triangles)
Price makes higher highs BUT CVD makes lower highs
→ Hidden distribution in progress
→ Bearish reversal signal likely
→ Confirms your SELL entries
🚀 EXTREME BUY PRESSURE (Rockets)
Delta > 2x average
→ Massive aggressive buying
→ Strong bullish momentum
→ Continuation likely
💥 EXTREME SELL PRESSURE (Explosions)
Delta < -2x average
→ Massive aggressive selling
→ Strong bearish momentum
→ Capitulation or panic
📈 DELTA PER CANDLE DISPLAY (NEW)
Option to display numerical delta on each candle:
• ✅ GREEN when delta positive (+250, +180, etc.)
• ❌ RED when delta negative (-320, -150, etc.)
• Tiny size to avoid clutter
• Perfect for tracking flow in real-time
🎯 REAL USE CASES
📌 Example 1: Avoid the Classic Trap
Technical setup:
→ Price rejects VWAP Weekly (resistance)
→ FVG below attracting
→ Single Prints above
→ You think: "Perfect SELL setup!"
WITHOUT Order Flow Signals:
❌ You enter SELL
❌ Price goes up and stops you out
❌ Frustration and loss
WITH Order Flow Signals:
✅ You see 💎 CYAN DIAMOND (Bullish absorption)
✅ Institutions are BUYING despite rejection
✅ You DON'T ENTER SELL
✅ Trade saved, loss avoided!
📌 Example 2: Confirm a Breakout
Setup:
→ Price breaks major resistance
→ But is it a real breakout or fakeout?
Check Order Flow Signals:
→ 🚀 ROCKET appears (extreme buy pressure)
→ 💎 CYAN DIAMOND (bullish absorption)
→ Massive positive delta visible
Clear signal: It's a REAL breakout!
→ Enter BUY with confidence
→ Institutions pushing price
📌 Example 3: Detect Hidden Accumulation
Situation:
→ Price consolidating in range
→ Apparently neutral
→ No clear technical signal
Order Flow Signals reveals:
→ ▲ GREEN TRIANGLE (bullish divergence)
→ Price flat BUT CVD rising progressively
→ Institutional accumulation in progress
Action: Prepare LONG position
→ When price breaks, it will be violent!
⚙️ COMPLETE CUSTOMIZATION
🎨 COLORS (9 configurable colors)
• Bullish Absorption (default: cyan)
• Bearish Absorption (default: orange)
• EXTREME Absorption (default: fuchsia)
• Bullish Divergence (default: green)
• Bearish Divergence (default: red)
• Buy Pressure (default: lime)
• Sell Pressure (default: fuchsia)
• Positive Delta (default: green)
• Negative Delta (default: red)
Adapt the indicator to your chart style!
📏 LABEL SIZES
5 sizes available: Tiny / Small / Normal / Large / Huge
→ Perfect for all screen types
→ Large 4K screen? → Large or Huge
→ Small laptop? → Small or Normal
🔍 CUSTOMIZABLE DETECTION
• Normal Absorption Threshold: 1.5x (default)
• EXTREME Absorption Threshold: 3.0x (default)
• Divergence Periods: 14 (default)
• All thresholds adjustable to your style
👁️ ON/OFF DISPLAY
• Absorptions 💎 (On/Off)
• Divergences ▲▼ (On/Off)
• Extreme Pressure 🚀💥 (On/Off)
• Delta per Candle (On/Off)
Display only what you need!
🔔 COMPLETE ALERT SYSTEM
8 independently configurable alert types:
1. 🔵 Bullish Absorption
2. 🔴 Bearish Absorption
3. 🔥🔵 EXTREME Bullish Absorption
4. 🔥🔴 EXTREME Bearish Absorption
5. 📈 Bullish Divergence
6. 📉 Bearish Divergence
7. 🚀 Extreme Buy Pressure
8. 💥 Extreme Sell Pressure
Receive push, email or SMS notifications when institutions act!
💡 MARKETS AND TIMEFRAMES
✅ ALL markets compatible:
• Futures (ES, NQ, YM, RTY, MNQ, MES, etc.)
• Forex (EUR/USD, GBP/USD, USD/JPY, etc.)
• Crypto (BTC, ETH, altcoins)
• Stocks (Tesla, Apple, Nvidia, etc.)
• Indices (S&P 500, Nasdaq, Dow Jones)
• Commodities (Gold, Oil, etc.)
✅ All timeframes:
• Scalping: 1min, 5min
• Day Trading: 15min, 30min, 1H ⭐ (optimal!)
• Swing Trading: 4H, Daily
Note: More reliable signals with real volume data
→ TradingView Premium recommended for tick data
🏆 UNIQUE ADVANTAGES
✅ Automatic institutional absorption detection
✅ EXTREME absorptions (300%+) for ultra-strong signals
✅ Integrated CVD (Cumulative Volume Delta)
✅ Optional per-candle delta display (green/red)
✅ 9 customizable colors - adapt to your style
✅ 5 label sizes - perfect for all screens
✅ Clear visual signals directly on chart
✅ Detailed tooltips on each signal
✅ 8 independent configurable alerts
✅ Clean, optimized code, no repaint
✅ Compatible all markets and timeframes
📊 RECOMMENDED CONFIGURATION
For MNQ / ES / NQ (15min):
```
Detection:
├─ Normal Absorption Threshold: 1.5x
└─ EXTREME Absorption Threshold: 3.0x
Display:
├─ Absorptions: ✅ ON
├─ Divergences: ✅ ON
├─ Extreme Pressure: ✅ ON
└─ Delta per Candle: ❌ OFF (or ON if preferred)
Customization:
└─ Label Size: Normal (or Large for big screen)
Colors:
└─ Default (or customize!)
Alerts:
└─ All ✅ ON
```
For Scalping (1-5min):
```
└─ Label Size: Small
└─ Delta per Candle: ✅ ON (useful in scalping)
└─ Absorption Threshold: 2.0x (stricter)
```
🎓 SUPPORT AND TOOLTIPS
Each signal includes detailed tooltip on hover:
• Exact volume and multiplier (e.g. 2.3x)
• Precise delta
• Signal explanation
• Suggested action
Hover over 💎▲🚀 to understand each signal!
🔗 PERFECT COMPLEMENT
This indicator works perfectly with:
• Order Flow Dashboard (to see CVD and pressures)
• VWAP Multi-Timeframe
• Fair Value Gaps (FVG)
• Market Profile (POC/VPOC)
• Support/Resistance
Combine Order Flow signals with your technical analysis!
⚠️ DISCLAIMER
Technical indicators are decision support tools. No indicator guarantees profits. Always use:
• Appropriate risk management
• Stop loss on every trade
• Proper position sizing
• Demo account testing first
Order Flow Signals improves your analysis but doesn't replace a complete strategy.
📞 CONTACT AND SUPPORT
Created by Alphaomega18
For questions, bugs or suggestions:
Find my other indicators:
• Order Flow Dashboard (CVD and pressures)
• VWAP Multi-Timeframe Pro
• Fair Value Gap Detector
• Volume & Volatility Crisis Detector

CVD Oscillator - Alphaomega18ORDER FLOW DASHBOARD OSCILLATOR - TRADINGVIEW PUBLICATION (ENGLISH)
Created by Alphaomega18
═══════════════════════════════════════════════════════════════════════════════
📌 PUBLICATION TITLE
═══════════════════════════════════════════════════════════════════════════════
Order Flow Dashboard - CVD Oscillator & Pressures - Alphaomega18
📝 COMPLETE DESCRIPTION
═══════════════════════════════════════════════════════════════════════════════
🎯 TRACK INSTITUTIONAL FLOW IN REAL-TIME
Order Flow Dashboard Oscillator is an advanced indicator that displays CVD (Cumulative Volume Delta) as a percentage oscillator, combined with real-time buy/sell pressures.
Unlike traditional CVD indicators where raw CVD reaches millions and crushes other data, this oscillator displays CVD deviation from its average in %, allowing clear reading on the SAME scale as pressures.
🔥 THE PROBLEM SOLVED
Classic CVD indicator problem:
✗ Raw CVD climbs to 1,000,000+ → Unreadable
✗ Pressures stay small (0-500) → Invisible
✗ Impossible to see both simultaneously
✗ Cluttered and confusing chart
Solution with CVD Oscillator:
✅ CVD displayed as % deviation (oscillates around 0)
✅ Pressures normalized on same scale
✅ EVERYTHING visible simultaneously
✅ Clear and intuitive reading
📊 INDICATOR COMPONENTS
🔷 CVD OSCILLATOR (Thick white line)
Traditional CVD accumulates infinitely:
→ Raw CVD = 50,000 ... 100,000 ... 500,000 ... 1,000,000+
→ Hard to interpret
CVD Oscillator shows DEVIATION:
→ CVD Oscillator = +5% ... +12% ... -3% ... -8%
→ Easy to interpret!
**How it works:**
• Calculates distance between CVD and its moving average (20 periods default)
• Converts to percentage
• Oscillates around 0 (gray center line)
**Interpretation:**
• **Above 0** → CVD > Average = BULLISH trend
• **Below 0** → CVD < Average = BEARISH trend
• **+10% zone** (green dotted line) → Buyer strength
• **-10% zone** (red dotted line) → Seller strength
🔷 BUY/SELL PRESSURES (Green/Red zones)
**Buy Pressure (Green zone)**
→ Calculated on bullish candles
→ Proportional to candle size
→ Normalized for optimal visibility
**Sell Pressure (Red zone)**
→ Calculated on bearish candles
→ Proportional to candle size
→ Normalized for optimal visibility
**Extreme Pressures** (Background)
→ 🟢 Light green background = EXTREME buy pressure (delta > 2x average)
→ 🔴 Light red background = EXTREME sell pressure (delta < -2x average)
🔷 REAL-TIME DASHBOARD (Top right corner)
Displays 6 key metrics:
1. **CVD Osc**: Oscillator value in %
2. **CVD Raw**: Raw CVD value (reference)
3. **Trend**: 🟢 Bullish or 🔴 Bearish
4. **Delta**: Current candle delta
5. **Volume**: HIGH (spike) or Normal
6. **Pressure**: 🚀 BUY / 💥 SELL / Neutral
🎯 HOW TO USE IT
📌 CASE 1: HOLD TRADES LONGER
**Classic problem:**
→ You're in a LONG
→ Price pulls back slightly, you panic
→ You exit... then price resumes up
→ Frustration: "I was right but exited too early!"
**Solution with CVD Oscillator:**
Example LONG trade:
1. You enter LONG on breakout
2. You watch CVD Oscillator
3. **As long as it stays ABOVE 0** → Keep the trade
4. Institutions continue accumulating
5. Trend remains intact
Exit:
→ CVD Oscillator **crosses below 0**
→ Signal: Institutions now selling
→ You exit or take profits
**Result:**
✅ You maximize your gains
✅ You exit at right time (when flow changes)
✅ You don't panic on small corrections
📌 CASE 2: CONFIRM TREND STRENGTH
**Setup:**
→ Price in uptrend
→ But is it real trend or just noise?
**Check CVD Oscillator:**
STRONG trend:
→ CVD Oscillator **stays positive** (+5%, +8%, +12%)
→ Dominant buy pressures (green zones)
→ Few or no red backgrounds
WEAK trend:
→ CVD Oscillator **oscillates around 0** (+2%, -1%, +3%)
→ Mixed pressures (green and red alternate)
→ Lack of conviction
**Action:**
✅ Strong trend → Trade with confidence
⚠️ Weak trend → Be cautious or avoid
📌 CASE 3: DETECT TREND CHANGE
**CVD Oscillator Divergence:**
Price makes higher highs BUT:
→ CVD Oscillator makes lower highs
→ +15% ... +12% ... +8% (progressive decline)
→ Sell pressures increasing
Signal: Distribution in progress
→ Institutions selling into rally
→ Reversal likely
→ Prepare SHORT or exit LONG
📌 CASE 4: OPTIMAL ENTRY TIMING
**Situation:**
→ Price consolidating
→ You wait for signal to enter
**LONG entry signal:**
→ CVD Oscillator **crosses above 0**
→ Green background (extreme buy pressure) appears
→ Dashboard: 🚀 BUY
Action: Enter LONG immediately
**SHORT entry signal:**
→ CVD Oscillator **crosses below 0**
→ Red background (extreme sell pressure) appears
→ Dashboard: 💥 SELL
Action: Enter SHORT immediately
⚙️ CUSTOMIZABLE PARAMETERS
🔧 **CVD Moving Average Length** (default: 20)
→ Moving average period for oscillator
→ Shorter (10-15) = More reactive, more signals
→ Longer (30-50) = Smoother, fewer false signals
👁️ **Show CVD Oscillator** (On/Off)
→ Show/hide CVD Oscillator line
👁️ **Show Buy/Sell Pressure** (On/Off)
→ Show/hide pressure zones
👁️ **Show Info Dashboard** (On/Off)
→ Show/hide information table
📊 RECOMMENDED CONFIGURATIONS
**For Day Trading (15min-1H):**
```
CVD MA Length: 20
Show CVD Oscillator: ✅ ON
Show Buy/Sell Pressure: ✅ ON
Show Info Dashboard: ✅ ON
```
**For Scalping (1-5min):**
```
CVD MA Length: 10 (more reactive)
Show CVD Oscillator: ✅ ON
Show Buy/Sell Pressure: ✅ ON
Show Info Dashboard: ✅ ON
```
**For Swing Trading (4H-Daily):**
```
CVD MA Length: 30 (smoother)
Show CVD Oscillator: ✅ ON
Show Buy/Sell Pressure: ✅ ON
Show Info Dashboard: ✅ ON
```
💡 MARKETS AND TIMEFRAMES
✅ **ALL markets compatible:**
• Futures (ES, NQ, YM, RTY, MNQ, MES, etc.)
• Forex (EUR/USD, GBP/USD, USD/JPY, etc.)
• Crypto (BTC, ETH, altcoins)
• Stocks (Tesla, Apple, Nvidia, etc.)
• Indices (S&P 500, Nasdaq, Dow Jones)
✅ **All timeframes:**
• Scalping: 1min, 5min
• Day Trading: 15min, 30min, 1H ⭐ (optimal!)
• Swing Trading: 4H, Daily
Note: More reliable with real volume data
→ TradingView Premium recommended
🏆 UNIQUE ADVANTAGES
✅ **CVD Oscillator**: % deviation instead of raw value
✅ **Same scale**: CVD and pressures visible together
✅ **Intuitive reading**: Above/below 0
✅ **Normalized pressures**: Always visible
✅ **Real-time dashboard**: 6 key metrics
✅ **Strength zones**: +10% and -10% marked
✅ **Background alerts**: Visual extreme pressures
✅ **Optimized code**: Light and fast
✅ **No repaint**: Reliable signals
🔗 PERFECT COMPLEMENT
Use with **Order Flow Signals** for complete system:
• **Order Flow Signals** (overlay=true) → Signals on chart
→ 💎 Absorptions, ▲ Divergences, 🚀 Pressures
• **Order Flow Dashboard** (overlay=false) → CVD and metrics
→ CVD Oscillator, Pressures, Live dashboard
**Complete system = 360° order flow vision!**
🎓 QUICK INTERPRETATION
**CVD Oscillator:**
• +5% to +10% = Moderate bullish
• +10% and above = STRONG bullish
• -5% to -10% = Moderate bearish
• -10% and below = STRONG bearish
• Near 0 = Neutral / Consolidation
**Pressures:**
• Large green zones = Dominant buying
• Large red zones = Dominant selling
• Balanced = Indecision
**Dashboard:**
• 🟢 Bullish + 🚀 BUY = Strong LONG signal
• 🔴 Bearish + 💥 SELL = Strong SHORT signal
• Massive positive delta = Bullish momentum
• Massive negative delta = Bearish momentum
⚠️ DISCLAIMER
Technical indicators are decision support tools. No indicator guarantees profits. Always use:
• Appropriate risk management
• Stop loss on every trade
• Proper position sizing
• Demo account testing first
Order Flow Dashboard improves your analysis but doesn't replace a complete strategy.
🚀 INSTALLATION
1. Copy the Pine Script code
2. Open Pine Editor in TradingView
3. Paste the code
4. Click "Add to Chart"
5. Indicator displays in separate pane (below)
6. Configure parameters to your preferences
7. Combine with Order Flow Signals for complete system!
💡 USAGE TIPS
**Golden Rule for Holding Trades:**
→ LONG: Keep as long as CVD Osc > 0
→ SHORT: Keep as long as CVD Osc < 0
**Strength Signals:**
→ CVD Osc > +10% = Very bullish
→ CVD Osc < -10% = Very bearish
**Trend Change:**
→ CVD Osc crosses 0 = Potential change
→ + Extreme background = Strong confirmation
📞 CONTACT AND SUPPORT
Created by Alphaomega18
For questions, bugs or suggestions:
Find my other indicators:
• Order Flow Signals (signals on chart)
• VWAP Multi-Timeframe Pro
• Fair Value Gap Detector
• Volume & Volatility Crisis Detector
