ATR Based Trendlines - JDThis script draws trendlines from the pivot points in the price chart.
The angle of the trendlines is determined by (a percentage of) the atr.
The angle follows the change in price, dictated by the atr at the moment where the pivot point is detected.
The atr percentage determines if the trendline follows the rate of change of the atr or a fraction ( value < 100) or a multiple ( value > 100) of that
JD.
#NotTradingAdvice #DYOR
Disclaimer.
I AM NOT A FINANCIAL ADVISOR.
THESE IDEAS ARE NOT ADVICE AND ARE FOR EDUCATION PURPOSES ONLY.
ALWAYS DO YOUR OWN RESEARCH!
在腳本中搜尋"trend"

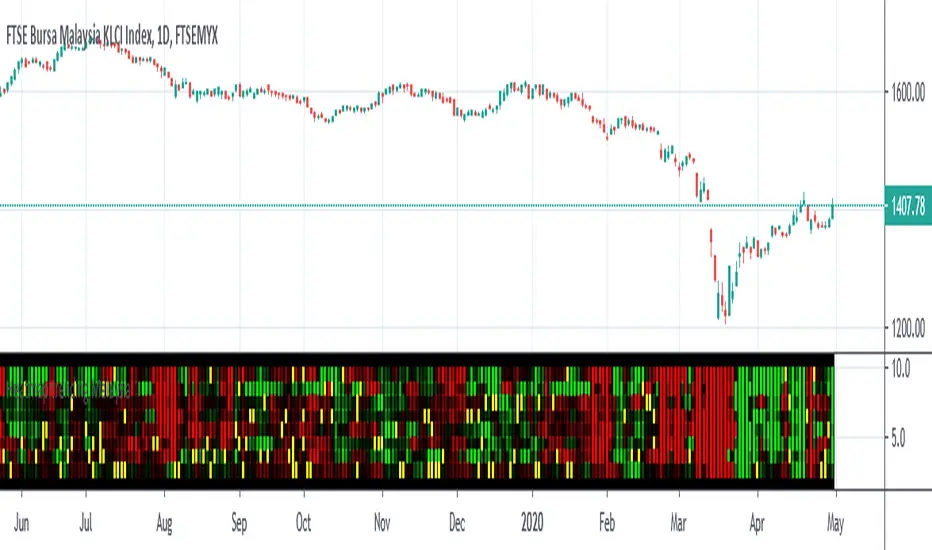
Heatmap trending MalaysiaThis heatmap chart is created base on Heikin Ashi trend for Malaysia Major Index
CONSTRUCTN ,TECHNOLOGY,FINANCE,CONSUMER,PROPERTIES,IND-PROD,PLANTATION,REIT.
This allow compare to malaysia stock for macro trending.
Lastly ,thank to LonesomeTheBlue which inspire me for this coding .
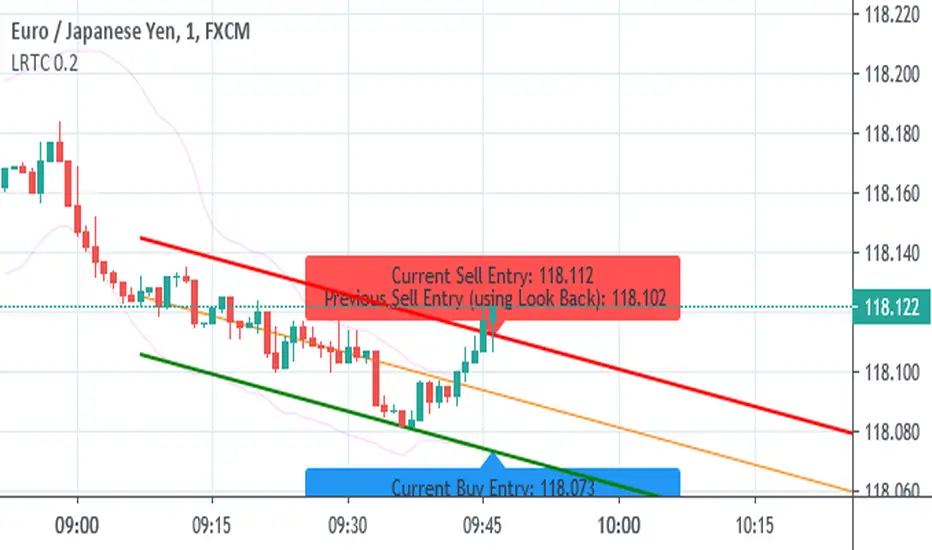
Linear Regression Trend Channel with Entries & AlertsPlease Use this Indicator If you understand the risk posed by linear regression trend channel
Features
Provides trend channel (best value for period is 40 on 5 minute timeframe
Provides BUY/SELL entries based on current channel
Provides custom color for channel
Best used with MattyPips strategy indicators
Risks : Please note, this script is the likes of Bollinger bands and poses a risk of falling in a trend range.
Entries may keep running on the same direction while the market is moving.
FTSMA - Trend is your frendThis my new solid strategy: if you belive that "TREND IS YOUR FRIEND" this is for you!
I have tested with many pairs and at many timeframes and have profit with just minor changes in settings.
I suggest to use it for intraday trading .
VERY IMPORTANT NOTE: this is a trend following strategy, so the target is to stay in the trade as much as possible. If your trading style is more focused on scalping and/or pullbaks, this strategy is not for you.
This strategy uses moving averages applied to Fourier waves for forecasting trend direction.
How strategy works:
- Buy when fast MA is above mid MA and price is above slow MA, which acts as a trend indicator.
- Sell when fast MA is below mid MA and price is below slow MA, which acts as a trend indicator.
Strategy uses a lot of pyramiding orders because when you are in a flat market phase it will close 1 or 2 orders with a loss, but when a big trend starts, it will have profit in a lot of orders.
So, if you analize carefully the strategy results, you will note that "Percent Profitable" is very low (30% in this case) because strategy opened a lot of orders also in flat markets with small losses, BUT "Avg # bars in winning trades" is very high and overall Profit is very high: when a big trend starts, orders are kept open for long time generating big profits.
Thanks to all pinescripters mentioned in the code for their snippets.
I have also a study with alerts. Next improvement (only to whom is interested to this script and follows me): study with alerts on multiple tickers all at one. Leave a comment if you want to have access to study.
HOW TO USE STRATEGY AND STUDY TOGHETER:
1- Add to chart the strategy first, so your workspace will be as clean as possible.
2- Open the Strategy Tester tab at footer of the page.
3- Modify settings to get best results (Profit, Profit Factor, Drawdown).
4- Add study with alerts to your chart with same setting of strategy.
I WILL PROVIDE A DETAILED QUICK INSTALLATION GUIDE WITH THE STUDY!
Please use comment section for any feedback or contact me if you need support.

Grand Trend Forecasting - A Simple And Original Approach Today we'll link time series forecasting with signal processing in order to provide an original and funny trend forecasting method, the post share lot of information, if you just want to see how to use the indicator then go to the section "Using The Indicator".
Time series forecasting is an area dealing with the prediction of future values of a series by using a specific model, the model is the main tool that is used for forecasting, and is often an expression based on a set of predictor terms and parameters, for example the linear regression (model) is a 1st order polynomial (expression) using 2 parameters and a predictor variable ax + b . Today we won't be using the linear regression nor the LSMA.
In time series analysis we can describe the time series with a model, in the case of the closing price a simple model could be as follows :
Price = Trend + Cycles + Noise
The variables of the model are the components, such model is additive since we add the component with each others, we should be familiar with each components of the model, the trend represent a simple long term variation of high amplitude, the cycles are periodic fluctuations centered around 0 of varying period and amplitude, the noise component represent shorter term irregular variations with mean 0.
As a trader we are mostly interested by the cycles and the trend, altho the cycles are relatively more technical to trade and can constitute parasitic fluctuations (think about retracements in a trend affecting your trend indicator, causing potential false signals).
If you are curious, in signal processing combining components has a specific name, "synthesis" , here we are dealing with additive synthesis, other type of synthesis are more specific to audio processing and are relatively more complex, but could be used in technical analysis.
So what to do with our components ? If we want to trade the trend, we should estimate right ? Estimating the trend component involve removing the cycle and noise component from the price, if you have read stuff about filters you should know where i'am going, yep, we should use filters, in the case of keeping the trend we can use a simple moving average of relatively high period, and here we go.
However the lag problem, which is recurrent, come back again, we end up with information easier to interpret (here the trend, which is a simple fluctuation such as a line or other smooth curve) at the cost of decision timing, that is unfortunate but as i said the information, here the moving average output, is relatively simple, and could be easily forecasted right ? If you plot a moving average of high period it would be easier for you to forecast its future values. And thats what we aim to do today, provide an estimate of the trend that should be easy to forecast, and should fit to the price relatively well in order to produce forecast that could determine the position of future closing prices observations.
Estimating And Forecasting The Trend
The parameter of the indicator dealing with the estimation of the trend is length , with higher values of length attenuating the cycle and noise component in the price, note however that high values of length can return a really long term trend unlike a simple moving average, so a small value of length, 14 for example can still produce relatively correct estimate of trend.
here length = 14.
The rough estimate of the trend is t in the code, and is an IIR filter, that is, it is based on recursion. Now i'll pass on the filter design explanation but in short, weights are constants, with higher weights allocated to the previous length values of the filter, you can see on the code that the first part of t is similar to an exponential moving average with :
t(n) = 0.9t(n-length) + 0.1*Price
However while the EMA only use the precedent value for the recursion, here we use the precedent length value, this would just output a noisy and really slow output, therefore in order to create a better fit we add : 0.9*(t(n-length) - t(n-2length)) , and this create the rough trend estimate that you can see in blue. On the parameters, 0.9 is used since it gives the best estimate in my opinion, higher values would create more periodic output and lower values would just create a rougher output.
The blue line still contain a residual of the cycle/noise component, this is why it is smoothed with a simple moving average of period length. If you are curious, a filter estimating the trend but still containing noisy fluctuations is called "Notch" filter, such filter would depending on the cutoff remove/attenuate mid term cyclic fluctuations while preserving the trend and the noise, its the opposite of a bandpass filter.
In order to forecast values, we simply sum our trend estimate with the trend estimate change with period equal to the forecasting horizon period, this is a really really simple forecasting method, but it can produce decent results, it can also allows the forecast to start from the last point of the trend estimate.
Using The Indicator
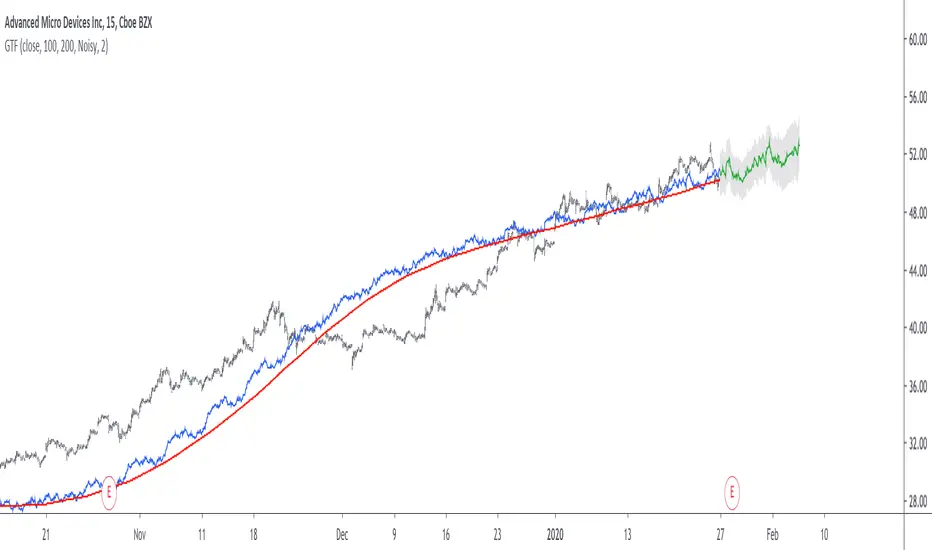
We explained the length parameter in the precedent section, src is the input series which the trend is estimated, forecast determine the forecasting horizon, recommend values for forecast should be equal to length, length/2 or length*2, altho i strongly recommend length.
here length and forecast are both equal to 14 .
The corrective parameter affect the trend estimate, it reduce the overshoot and can led to a curve that might fit better to the price.
The indicator with the non corrective version above, and the corrective one below.
The source parameter determine the source of the forecast, when "Noisy" is selected the source is the blue line, and produce a noisy forecast, when "Smooth" is selected the source is the moving average of t , this create a smoother forecast.
The width interval control...the width of the intervals, they can be seen above and under the forecast plot, they are constructed by adding/subtracting the forecast with the forecast moving average absolute error with respect to the price. Prediction intervals are often associated with a probability (determining the probability of future values being between the interval) here we can't determine such probability with accuracy, this require (i think) an analysis of the forecasting distribution as well as assumptions on the distribution of the forecasting error.
Finally it is possible to see historical forecasts, that is, forecasts previously generated by checking the "Show Historical Forecasts" option.
Examples
Good forecasts mostly occur when the price is close to the trend estimate, this include the following highlighted periods on AMD 15TF with default settings :
We can see the same thing at the end of EURUSD :
However we can't always obtain suitable fits, here it is isn't sufficient on BTCUSD :
We can see wide intervals, we could change length or use the corrective option to get better results, another option is to use a log scale.
We will end the examples with the log SPX, who posses a linear trend, so for example a linear model such as a linear regression would be really adapted, lets see how the indicator perform :
Not a great fit, we could try to use an higher length value and use "Smooth" :
Most recent fits are quite decent.
Conclusions
A forecasting indicator has been presented in this post. The indicator use an original approach toward estimating the trend component in the closing price. Of course i should have given statistics related to the forecasting error, however such analysis is worth doing with better methods and in more advanced environment allowing for optimization.
But we have learned some stuff related to signal processing as well as time series analysis, seeing a time series as the sum of various components is really helpful when it comes to make sense of chaotic and noisy series and is a basic topic in time series analysis.
You can see that in this new year i work harder on the visual of my indicators without trying to fall in the label addict trap, something that i wasn't really doing before, let me know what do you think of it.
Thanks for reading !
Efficient Trend Step ChannelIntroduction
The efficient trend-step indicator is a trend indicator that make use of the efficiency ratio in order to adapt to the market trend strength, this indicator originally aimed to remain static during ranging states while fitting the price only when large variations occur. The trend step indicator family unlike most moving averages has a boxy appearance and could therefore not be classified as smooth, this makes it an indicator relatively uninteresting to use as input for other non-trending indicators such as oscillators.
Today a channel indicator making use of the efficient trend-step is proposed, the indicator has an upper and a lower extremity who can be used for breakout or support and resistance methodologies, however we will see that the indicator is sometimes able to return accurate support and resistance levels.
The Indicator
The indicator has the same settings has the efficient trend step indicator, length control the period of the efficiency ratio, fast control the period of the rolling standard deviation used for trending states, slow control the period of the rolling standard deviation used for ranging states, fast should be lower than slow , if both are equal then the indicator is equal to the classical trend step indicator and length does no longer affect the indicator output. Lower values of fast/slow will make the indicator more reactive to small variations thus changing direction more often.
The color changes you can see on the indicator are changed depending on the prior direction took by the indicator output, if the indicator where higher than its precedent value, then the color will be blue until the indicator is lower than its precedent value. Those colors help you have an estimate of the current trend direction.
Channel Calculation And Role
The extremities made from the efficient trend step allow for more advanced trading rules, they can act as stop/target level and can also give a rough estimate of the current market volatility, with wider extremities indicating a more volatile market.
The extremities are made directly from the dev element used by the efficient trend-step, the upper extremity is made by summing the efficient trend step with the value of dev when the efficient trend step change, the lower extremity is made the same way but the value is subtracted instead.
Is it a weird choice ? It sure is strange to see such approach, the absolute rolling average error between the price and the efficient trend step could have been a logical measure but using dev instead is more efficient and also allow for a more adaptive approach which can benefit the support and resistance methodology, the last reason is because i didn't wanted to "denature" the trend-step signature of the indicator.
The figure above represent the measurement used for making the extremities (in green).
Since the previously described measure change only when the efficient trend step change, we can conclude that such measure is representative of a relatively large variation, since the efficient trend step aim to only change when a large variations appear.
We can see that the upper extremity acted as an accurate resistance in this upper variation of AMD,
Here as well, however like other bands indicators it is safer to take into account the current trend direction, a strong uptrend will have less difficulties crossing the upper extremity, therefore it might be better to rely on the support (lower extremity) on an up-trending market (indicator in blue), and on the resistance (upper extremity) on an down-trending market (indicator in orange).
The figure above show support and resistances signals, a cross represent a false signal, while green arrows represent correct ones with their respective direction.
Conclusion
The presented indicator add more possibilities to the interpretation of the efficient trend step, the extremities can act as stop/target level, however this use has to be controlled, and the level should be in accordance to your risk/reward ratio.
Showcasing another trend-step indicator was a real pleasure. Thanks for reading :)

Trend Follower | jhThis is a trend following system that combines 3 indicators which provide different functionalities, also a concept conceived by VP's No Nonsense FX / NNFX method.
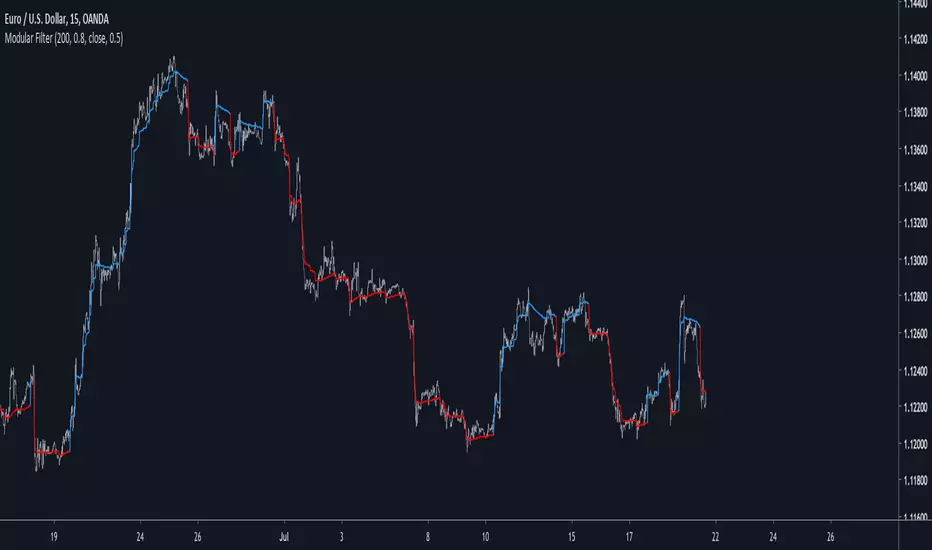
1. Baseline
The main baseline filter is an indicator called Modular Filter created by Alex Grover
- www.tradingview.com
- Alex Grover - Modular Filter
-------
That's the moving average like baseline following price, filtering long and short trends and providing entry signals when the price crosses the baseline.
Entry signal indicated with arrows.
2. Volume/Volatility, I will called it Trend Strength
The next indicator is commonly known as ASH, Absolute Strength Histogram.
This indicator was shared by VP as a two line cross trend confirmation indicator, however I discovered an interesting property when I modified the calculation of the histogram.
- Alex Grover Absolute Strength
-------
My modification and other info here
- Absolute Strength Histogram v2
-------
I simplified the display of the trend strength by plotting squares at the bottom of the chart.
- Lighted Squares shows strength
- Dimmed Squares shows weakness
3. Second Confirmation / Exits / Trailing Stop
Finally the last indicator is my usage of QQE (Qualitative Quantitative Estimation), demonstrated in my QQE Trailing Line Indicator
- QQE Trailing Line for Trailing Stop
-------
Three usages of this amazing indicator, serving as :
- Second trend confirmation
- Exit signal when price crosses the trailing line
- Trailing stop when you scaled out the second trade
This indicator is plotted with crosses.
Additional plots and information
Bar Color
- Green for longs, Red for shorts, White when the baseline direction conflicts with the QQE trailing line direction
- When it's white, it's usually ranging and not trending, ASH will also keep you off ranging periods.
-------
ATR Filter
- White circles along the baseline, they will show up if the price has moved more than one ATR from the baseline
- The default allowance is 1 ATR.
-------
The previous and current ATR value
- Label on the right side of the chart showing the previous and current value of ATR
Adding my Didi and ASH indicators up on this screenshot
Didi Index Improved with QQE

Estamina Trend Strategy By KrisWatersTrend following strategy based on moving avarage crossovers. Strategy provides only long signals. Use only for BTCUSDT pair on 4H timeframe.

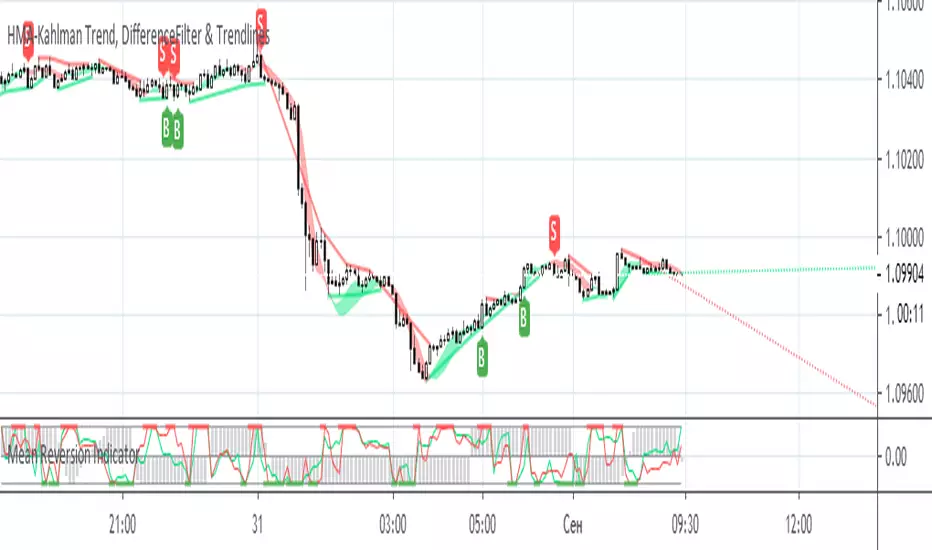
HMA-Kahlman Trend, DifferenceFilter & TrendlinesThis update to the previous HMA-Kahlman Trend, Clipping & Trendlines script features the same structure with the three modules:
- Trendlines module,
- NEW Winsorizing submodule using difference-based filtering.
- HMA-Kahlman Trend module.
The Winsorizing submodule filters signals by a volume level, eliminating the ones with the volume below a threshold. This module substitutes the previous 'low-level' filtering implementation. This time it filters out based on difference between scaled volume and its moving average.
Tested with BTCUSD.
Trend Direction Helper (ZigZag and S/R and HH/LL labels)Hey everyone
First of all, I'd like to thank Ricardo Santos, Backtest Rookies for the inspiration for this script.
Actually, most of it is coming from them and I only mixed them up (and added my secret sauce ^^). If some of you are not thinking about a trading secret sauce, please get serious for a moment :)
Some of you asked me how I do to set the trend direction. You all understood that if you get an UP label, then the price should go up and vice-versa for down.
But it's not so easy to define the good signals for each asset and each timeframe. I'm going to repeat what I said yesterday because ... well... that's what trading is about
So quoting myself here "The inputs set by default will have to be changed for your asset/timeframe and can't be generic for everything. You have to play with the inputs until the signals will make sense to you
The indicator/strategy with a unique configuration that you'll never check or update according to the market condition DOES NOT exit. "
BUT... a bit of patience and practice and you might do wonders.
The Method
I never realized until now but by connecting the higher highs/lower lows, I was drawing zigzag lines.
The Zig Zag Master is Ricardo Santos . Please give him a follow, he's awesome
For those who don't want to draw on the chart or (my preferred choice) need some inspiration to define your trend directions, this script is for YOU (and your family, your pet, your girlfriend/boyfriend, ...)
I think that each asset/timeframe chart has its own history. What worked in a post could work in the future.
In that regard, if a trend direction worked in the past, that's the parameter that I'll use to trade with it in a demo account and make sure it's relevant. If not then I will adjust
If you're trading with new indicators or a new method right away on your real trading account, you're gonna have a bad time imgflip.com
Lines EVERYWHERE
The script draws the classical horizontal pivots + the zig zag lines + the Higher Highs/Lower Lows label in just 1 script. I'm very excited to share a script (on which I coded 100 lines out of 500) but no one else did it
The horizontal pivots part are coming from Backtest Rookies
For more security, you can add a pullback on a moving average after getting a signal. Pullbacks are necessary to limit any eventual loss or maximize your gains by getting in the trend sooner.
I really give you a solid method and a great script in my opinion. 6 years of experience given away for FREE :p (when Dave will start thinking as a business man instead :O)
Does it repaint ?
Getting this question twice a day. You guys are obsessed with the repainting :)
Short answer, yes because it will calculate the pivots and zig zags whenever new higher highs/lower lows will be formed.
However, the trend direction code is based on the candle close so it shouldn't repaint. If it does, please let me know
See you all on Monday
Love you all
Dave
____________________________________________________________
Be sure to hit the thumbs up. Building those indicators take a lot of time and likes are always rewarding for me :) (tips are accepted too)
- If you want to suggest some indicators that I can develop and share with the community, please use my personal TRELLO board
- I'm an officially approved PineEditor/LUA/MT4 approved mentor on codementor. You can request a coaching with me if you want and I'll teach you how to build kick-ass indicators and strategies
Jump on a 1 to 1 coaching with me
- You can also hire for a custom dev of your indicator/strategy/bot/chrome extension/python
Disclaimer:
Trading involves a high level of financial risk, and may not be appropriate because you may experience losses greater than your deposit. Leverage can be against you.
Do not trade with capital that you can not afford to lose. You must be aware and have a complete understanding of all the risks associated with the market and trading. We can not be held responsible for any loss you incur.
Trading also involves risks of gambling addiction.
Please notice I do not provide financial advice - my indicators, strategies, educational ideas are intended to provide only some source code for anyone interested in improving their trading
The proprietary indicators and strategies developed by Best Trading Indicator, the object of intellectual property rights are and remain the exclusive property of Best Trading Indicator, at the exclusion of images and videos and texts free of rights or provided by the Company or external legal or physical person.
No assignment of intellectual property rights is carried out through these Terms and Conditions.
Any total or partial reproduction, modification or use of these properties for any reason whatsoever is strictly prohibited without the express written authorization of the Company.

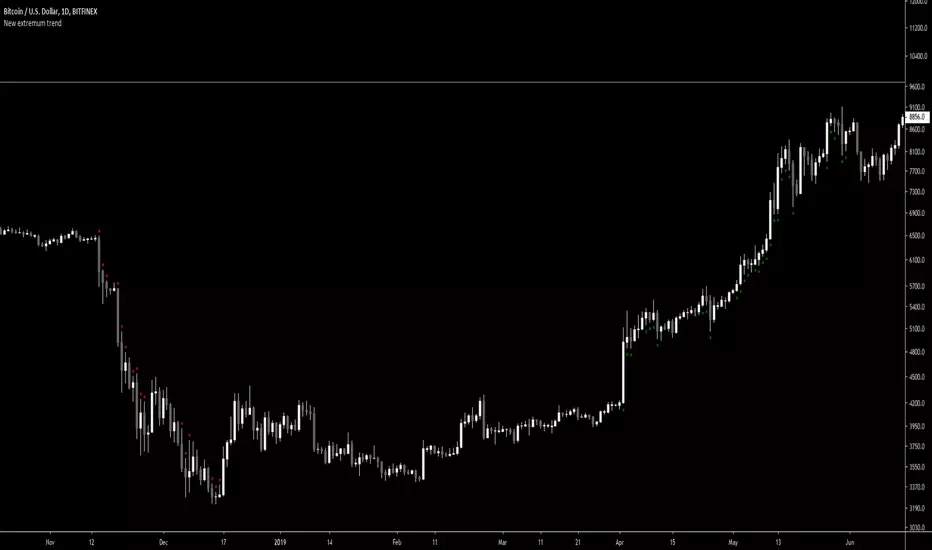
New extremum trendScript for filtering out periods when market is not trending.
It defines downtrend as following:
Lowest price of last 2 days is equal or lower then lowest price of last 100 days.
Values 2 and 100 are customizable.
Uptrend analogically with highs.
Trend Scores + Volume-Weighted Trend ScoresHere is a simple indicator based on Tushar Chande's TrendScore .
The main purpose of the TrendScore is to determine the strength and direction of a trend, which it does by comparing the current price to the prices within a user-defined window of historical prices.
In the input menu, the user defines the starting and ending period. The current price is then compared to each historical price. If the current price is greater than the given historical price, then the TrendScore is incremented, while it is decremented if it is below the given historical price. TrendScore values fluctuate between a maximum of 100 and a minimum of -100, with 100 meaning that the current price is greater than each historical price in the window and a value of -100 meaning the inverse is true.
We then use the same process to calculate the volume trend score by passing in volume to the 'getTrendScore' function. Lastly, the indicator also also calculates a 'volume-weighted trend score'. This is simply the average of the price trend score and the volume trend score. It is not plotted by default, but users can set the input option to true in the input menu and it will be plotted as a yellow line (as seen in the bottom chart).
The Chart:
The trend scores for price are plotted as a histogram. We've summarized the meaning behind its color changes below:
-If ( trendScore == 100)
then color = dark green
-if ( trendScore < 100 and trendScore is increasing)
then color = light green
-if ( trendScore > 0 and trendScore is DECREASING)
then color = pink
-if ( trendScore < 0)
then color = red
The volume trend score is plotted as a blue line. We felt that using a similar coloring system for the volume trend scores would over-crowd the chart and take away from the simplicity that makes this indicator useful. The volume-weighted trend score is plotted as a yellow line.
The main price bars change color based on the price trend score to make the values easier to visualize as well.
Interpretation:
This is a pretty versatile indicator. We summarized the ways in which traders can use it:
-Enter Long Positions when the trend score crosses zero from negative to positive territory.
-Exit Long Positions when the trend score was previously 100 and begins decreasing (ie bar color changes from dark green to pink).
-Spot bearish divergences when price trend score is 100 or relatively high and the volume trend score decreases significantly.
-Identify bullish divergences when price trend score is relatively low and volume trend score is increasing.
~Happy Trading~

Modular Filter - Spot Trends And Smooth PriceIntroduction
This indicator can have a wide variety of usages, and since it is based on exponential averaging then the whole indicator can be made adaptive, thus ending up with a really promising tool. This indicator who can both smooth price and act as a trailing stop depending on user preferences, i tried to make it as reactive, stable and efficient as possible in order to both smooth and spot trends, lets view it more in depth.
The Indicator
line 8 and 9 create two bands, one upper and one lower, then based on certain conditions the indicator will only return a certain band or an average of both with different weights, this weight is controlled by the beta parameter, values of 1 will return a simple filter while values of 0 will return a classical trailing stop.
beta = 0
The indicator can use output values as input, thus using smoother values as input, in order to do so just check "Feedback", this help the overall output to be smoother as well as giving more long terms signals
The amount of feedback is controlled by the feedback weighting parameter, lower values will weight more the output values thus creating smoother results.
Feedback weighting of 0.2
Using beta = 0 thus having the indicator act as a trailing stop while having the feedback option activated return more long terms signals. Notes that the colors are based on the initial conditions of the indicator.
Conclusion
You can replace length and change alpha for any smoothing variable such as the efficiency ratio or anything with scale (1,0), same goes for beta and the feedback weighting parameter, this is why the indicator is "Modular" in addition of providing different usages. This indicator can look like cluster filters (smooth price monarch, forexguru) , filters with the ability to follow the price quite fine while being stables. I really hope you find an use to it.
Thanks for reading !
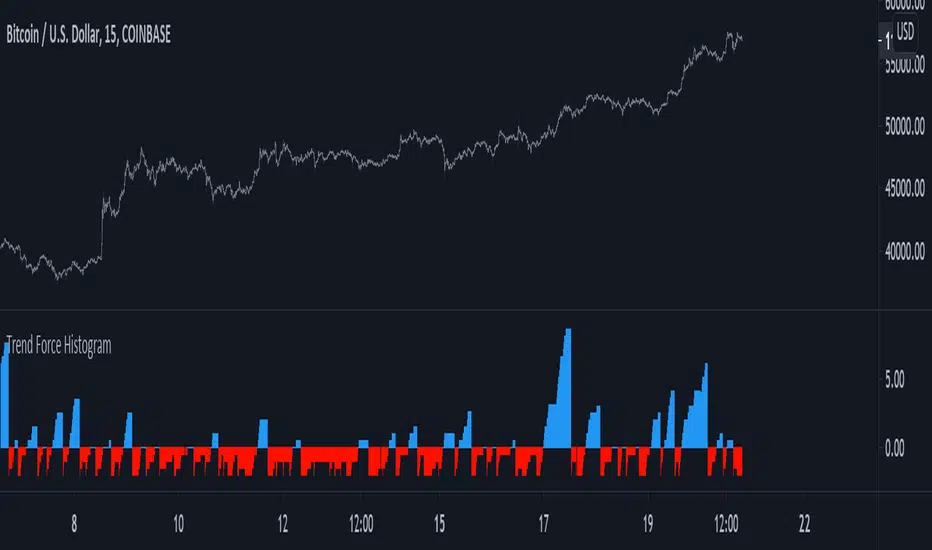
Trend Force HistogramA way to see if market is trending or not trending based on highest and lowest closing price. Market is considered to be trending when the indicator is above 0 (in blue) and ranging when under 0 (in red)
Quite simple but its a way to calculate the trend force since trend can be measured thanks to highest/lowest.

Trend Direction Force Index - TDFI [wm]TDFI can range from -1 to 1 and thus indicate the direction of the trend.
In periods of consolidation ratios take very low values close to zero as a rule, do not exceed the value of 0.05 (and -0.05), which have set arbitrarily as horizontal signal lines. Rate accelerates rapidly to higher values when the consolidation ends and is a good chance of becoming a permanent trend.
As an extension, the trader can assume that as long as the pointer moves above the signal line and does not come down to the low value of less than 0.05 for at least two bars the trend continues. So the descent below signal line and a return to higher values should be interpreted as a temporary weakening trend. Not before rate remains below 0.05 for at least 2 bars, can we consider that the market is likely to begin to consolidate
In addition, we can assess the strength of the trend, depending on the value of the index – the index reaches 1 trend is strong (-1 is a strong downward trend) and generally values above 0.6 should be so interpreted. Less than in decline should be considered that the trend is losing its momentum.


Trend Strength Index by TradingeneТhis indicator shows the strength of the trend. Although its logic is quite simple but it copes with its task well. Аnd that's its advantage.

Reversal Candlestick Pattern With Trend IndentifierThis script help to identified popular candlestick pattern combined with trend identifier.
Most script only focus on criteria of the pattern. Such as how much the length of the body compared to previous candle etc.
Besides criteria of the candle, this script also considered the trend into the logic.
For example bullish engulfing is a bullish reversal signal, which is only valid in a down trend.
To identified trend, I'm using RSI. Normally, RSI less than 50 is considered a down trend, and RSI greater than 50 is considered up trend. In this script, you can customize the criteria of how much RSI is up trend and down trend.
Default value RSI >= 55 is up trend, RSI <= 45 is down trend.
Your feedback and suggestion is welcome.
Supported pattern:
White Marubozu (wm)
Black Marubozu (bm)
Hammer (h)
Hanging Man (hm)
Inverted Hammer (ih)
Shooting Star (ss)
Bullish Engulfing (e)
Bearish Engulfing (e)
Tweezer Bottom (tb)
Tweezer Top (tt)
Three White Soldiers (tws)
Three Black Crows (tbc)
Morning Star (ms)
Evening Star (es)
Three Inside Up (tiu)
Three Inside Down (tid)
Reference:
babypips.com

VWF Trend VWF Trend – Fear-Based Trend Detection
VWF Trend is a price-overlay indicator designed to detect trend direction and strength using a volatility-based approach derived from Williams Vix Fix (WVF).
Unlike classic momentum indicators, VWF Trend focuses on fear and pressure zones and projects them directly onto the price chart for intuitive trend reading.
Key Concept (Important)
When the VWF lines contract and stay close to each other, the trend is strong.
This contraction means:
Volatility is controlled
Price is moving with commitment
Trend continuation probability is high
When the distance between the lines expands, trend strength weakens and the market is more likely to enter consolidation or transition.
How It Works
The central VWF EMA line acts as a dynamic trend threshold
Upper and lower VWF bands define
define pressure boundaries
Price position relative to the VWF line determines trend bias
How to Read
🟢 Bullish Trend
Price stays above the VWF line
VWF bands remain tight and compressed
Indicates strong upward trend
🔴 Bearish Trend
Price stays below the VWF line
VWF bands remain tight and compressed
Indicates strong downward trend
⚠️ Weak or Transition Zone
Bands start expanding
Price oscillates around the VWF line
Trend strength is decreasing
Why VWF Trend?
Highlights trend strength visually
Helps identify early trend continuation
Filters noise during strong moves
Works well after high-volatility events
Clean and chart-friendly design
Note:
VWF Trend is best used as a trend strength and direction filter,
not as a standalone buy/sell signal.
It performs best when combined with price action, structure, or volume analysis.

KCP TEMA 50 & VWAP Trend [Dr.K.C.Prakash]This indicator displays TEMA 50 High and Low lines to capture fast-reacting dynamic support and resistance, along with VWAP as an intraday reference. It helps identify short-term trend direction and price positioning relative to volume-weighted market value.

AI Adaptive Trend Navigator Echo EditionAI Adaptive Trend Navigator
This is an advanced trend-following system optimized for high-volatility index futures (TX). Built upon the LuxAlgo clustering framework, this version introduces several critical enhancements to meet professional trading standards:
1. State Consistency Iteration Enhanced the underlying logic for dynamic arrays and User-Defined Types (UDTs) to ensure stable "State Persistence." This fix eliminates logic gaps during real-time price fluctuations, ensuring that historical backtests perfectly align with live execution.
2. Adaptive Factor Tuning (K-means) The system simulates dozens of parameter paths in real-time, using K-means clustering to automatically select the optimal factor suited for the current market volatility.
3. Advanced Practical Filters
Dynamic Buffer Strategy: Filters out market noise during consolidation and early session volatility.
Confidence Threshold: Only triggers signals when the AI performance score meets the required quality.
Cooldown Logic: Prevents rapid signal flipping in choppy markets.
🧠 開發理念:將 AI 自適應力帶入台指期實戰 針對台指期(TX)高波動特性開發,透過機器學習演算法動態尋優,解決傳統指標參數固定的滯後性。
✨ Echo 版核心優化點
數據連續性迭代:底層邏輯優化,確保訊號在即時盤勢中穩定不跳斷,回測與實戰高度吻合。
自適應動態尋優:透過 K-means 聚類自動鎖定當前最佳 ATR 因子。
實戰多重濾網:包含空間緩衝區 (Buffer) 與信心門檻,大幅提升訊號品質。
📊 視覺說明
🚀 Rocket: AI confirms trend momentum.
⚡ Lightning: Trend exhaustion or reversal warning.
⚠️ Disclaimer: For educational and technical analysis purposes only.

McGinley + Hull TrendMcGinley + Hull Trend — Synopsis
The McGinley + Hull Trend indicator is a fast, adaptive trend filter designed for intraday trading. It combines the Hull Moving Average for early trend detection with the McGinley Dynamic for volatility-adaptive confirmation.
Using short lengths (e.g. 10 & 10) on a higher timeframe such as 1-hour, the indicator identifies real directional intent early while filtering out VWAP and Bollinger Band fakeouts. Trades are best taken only when both Hull and McGinley slopes align, providing a clear bullish or bearish bias.
This tool is intended to be used as a trend-direction filter, not an entry signal, and pairs effectively with VWAP ±1σ, Bollinger Bands, and ADX for strength only on lower timeframes (e.g. 10-minute entries).
