Multi-Average Trend Indicator (MATI)[FibonacciFlux]Multi-Average Trend Indicator (MATI)
Overview
The Multi-Average Trend Indicator (MATI) is a versatile technical analysis tool designed for traders who aim to enhance their market insights and streamline their decision-making processes across various timeframes. By integrating multiple advanced moving averages, this indicator serves as a robust framework for identifying market trends, making it suitable for different trading styles—from scalping to swing trading.
MATI 4-hourly support/resistance
MATI 1-hourly support/resistance
MATI 15 minutes support/resistance
MATI 1 minutes support/resistance
Key Features
1. Diverse Moving Averages
- COVWMA (Coefficient of Variation Weighted Moving Average) :
- Provides insights into price volatility, helping traders identify the strength of trends in fast-moving markets, particularly useful for 1-minute scalping .
- DEMA (Double Exponential Moving Average) :
- Minimizes lag and quickly responds to price changes, making it ideal for capturing short-term price movements during volatile trading sessions .
- EMA (Exponential Moving Average) :
- Focuses on recent price action to indicate the prevailing trend, vital for day traders looking to enter positions based on current momentum.
- KAMA (Kaufman's Adaptive Moving Average) :
- Adapts to market volatility, smoothing out price action and reducing false signals, which is crucial for 4-hour day trading strategies.
- SMA (Simple Moving Average) :
- Provides a foundational view of the market trend, useful for swing traders looking at overall price direction over longer periods.
- VIDYA (Variable Index Dynamic Average) :
- Adjusts based on market conditions, offering a dynamic perspective that can help traders capture emerging trends.
2. Combined Moving Average
- The MATI's combined moving average synthesizes all individual moving averages into a single line, providing a clear and concise summary of market direction. This feature is especially useful for identifying trend continuations or reversals across various timeframes .
3. Dynamic Color Coding
- Each moving average is visually represented with color coding:
- Green indicates bullish conditions, while Red suggests bearish trends.
- This visual feedback allows traders to quickly assess market sentiment, facilitating faster decision-making.
4. Signal Generation and Alerts
- The indicator generates buy signals when the combined moving average crosses above its previous value, indicating a potential upward trend—ideal for quick entries in scalping.
- Conversely, sell signals are triggered when the combined moving average crosses below its previous value, useful for exiting positions or entering short trades.
Insights and Applications
1. Scalping on 1-Minute Charts
- The MATI excels in fast-paced environments, allowing scalpers to identify quick entry and exit points based on short-term trends. With dynamic signals and alerts, traders can react swiftly to price movements, maximizing profit potential in brief price fluctuations.
2. Day Trading on 4-Hour Charts
- For day traders, the MATI provides essential insights into intraday trends. By analyzing the combined moving average and its relation to individual moving averages, traders can make informed decisions on when to enter or exit positions, capitalizing on daily price swings.
3. Swing Trading on Daily Charts
- The MATI also serves as a valuable tool for swing traders. By evaluating longer-term trends through the combined moving average, traders can identify potential swing points and adjust their strategies accordingly. The flexibility of adjusting the lengths of the moving averages allows for tailored approaches based on market volatility.
Benefits
1. Clarity and Insight
- The combination of diverse moving averages offers a clear visual representation of market trends, aiding traders in making informed decisions across multiple timeframes.
2. Flexibility and Customization
- With adjustable parameters, traders can adapt the MATI to their specific strategies, making it suitable for various market conditions and trading styles.
3. Real-Time Alerts and Efficiency
- Built-in alerts minimize response times, allowing traders to capitalize on opportunities as they arise, regardless of their trading style.
Conclusion
The Multi-Average Trend Indicator (MATI) is an essential tool for traders seeking to enhance their technical analysis capabilities. By seamlessly integrating multiple moving averages with dynamic color coding and real-time alerts, this indicator provides a comprehensive approach to understanding market trends. Its versatility makes it an invaluable asset for scalpers, day traders, and swing traders alike.
Important Note
As with any trading tool, thorough analysis and risk management are crucial when using this indicator. Past performance does not guarantee future results, and traders should always be prepared for market fluctuations.
在腳本中搜尋"trend"

Candlestick Trend Strength [AlgoAlpha]🚀🎉 Introducing the Candlestick Trend Strength by AlgoAlpha, a dynamic TradingView indicator designed to visually communicate the strength and direction of market trends right on your charts! 🕯️💪
Key Features:
🌈 Visual gauge for trend strength, color-coded for intuitive insights.
⏳ Customizable trend detection and normalization periods to match your trading strategy.
🎨 Flexible color settings for both uptrend (green) and downtrend (red).
🔔 Real-time alerts for trend reversals, helping you stay ahead of market moves.
How to Use:
🛠 Add the Indicator: Add the indicator to favorites and customize it to suit your needs.
🔍 Analyze the Trends: Monitor the color changes in the gauge and bar color to identify strengthening or weakening trends.
🔔 Set Alerts: Configure alerts to notify you of trend changes, allowing you to react swiftly to trading opportunities without constant monitoring.
Basic Logic Explained:
The "Candlestick Trend Strength" indicator calculates the trend strength score by analyzing the ratio of the candle's wick to its body, alongside the direction of the candle (up or down). It uses a normalization period to adjust the sum of the trend score into a scale from -1 to 1, which is then plotted as a color gradient gauge from red (downtrend) to green (uptrend) on the chart. This representation helps traders quickly assess whether a trend is gaining or losing strength, and it updates in real-time with each new bar, providing a highly responsive tool for technical analysis.
Embrace the power of visual trend analysis with the "Candlestick Trend Strength" by AlgoAlpha and transform your trading experience today! 🌟📈
Adaptive Schaff Trend Cycle (STC) [AlgoAlpha]Introducing the Adaptive Schaff Trend Cycle by AlgoAlpha: Elevate Your Trading Strategies 🚀
Discover precision and adaptability with the Adaptive Schaff Trend Cycle 🎯, meticulously crafted for traders seeking an edge in the markets. This advanced tool integrates sophisticated algorithms to offer clear insights and real-time analytics 📈.
Key Features:
⚙️Adaptive Signal Processing: Utilizes evolving calculations to adjust to market changes, offering highly responsive signals.
🔍Enhanced MACD Analysis: Innovates on the traditional MACD, providing new insights into market dynamics through an adaptive lens.
🎨Customizable Visual Experience: Features customizable up and down colors for tailored chart analysis.
🔔Real-Time Alerts: Stay informed with instant alerts on indicator changes.
Quick Guide to Using the Adaptive STC Indicator
1. 🔧 Adding the Indicator: Search for "Adaptive Schaff Trend Cycle (STC) " within TradingView's Indicators & Strategies and apply it to your chart. Customize the settings according to your trading style for optimum results.
2.👀 Market Analysis: Monitor the STC and Histogram values closely. The indicator's color gradients provide a visual representation of momentum shifts, helping you to identify trends more clearly.
3. 🚨 Set Alerts: Enable alerts for specific conditions like significant moves up or down, or when the histogram crosses zero. This feature ensures you never miss a potential trading opportunity.
How It Works:
The Adaptive Schaff Trend Cycle by AlgoAlpha introduces a dynamic approach to market analysis, refining traditional indicators through adaptive logic to align with fluctuating market conditions. Here's a concise overview of its operation:
🔄 Adaptive MACD Adjustment: The foundation of the indicator is an enhanced MACD calculation, which dynamically adjusts its parameters based on real-time market trends and momentum. This algorithmic adjustment aims to ensure the MACD's responsiveness to market changes, adapting its sensitivity to offer timely insights .
🌟 Integration of Schaff Trend Cycle (STC): After adjusting the MACD, the indicator calculates STC values to provide a smoothed representation of market trends. By normalizing and smoothing the MACD values on a scale from 0 to 100, the STC method helps in identifying market phases with a clear visualization. The smoothing process is designed to mitigate noise and focus on significant market movements .
📊 Visualization and Alerts: To aid in the interpretation of these insights, the Adaptive Schaff Trend Cycle employs color gradients and customizable visual settings to indicate momentum shifts. These visual cues, combined with alert functionalities, are structured to assist traders in monitoring market developments, enabling them to make informed decisions based on the presented data .
🛠️The Adaptive Schaff Trend Cycle thus merges adaptive MACD adjustments with STC methodology, supported by visual and alert features, to create a tool aimed at enhancing market analysis. By focusing on adaptability and current market conditions, it provides a nuanced view of market trends, intended to support traders in their decision-making processes without promising predictive accuracy or reliability .
Highest-Lowest Trend𝙃𝙄𝙂𝙃𝙀𝙎𝙏-𝙇𝙊𝙒𝙀𝙎𝙏 𝙏𝙍𝙀𝙉𝘿 𝙄𝙉𝘿𝙄𝘾𝘼𝙏𝙊𝙍
Overview:
The "Highest-Lowest Trend" indicator helps traders identify trends based on the highest and lowest values within a specified period. It provides visual cues to understand potential trend changes, making it a valuable tool for technical analysis.
Settings:
Length and Offset: Adjust the length and offset parameters to customize the sensitivity of the indicator.
Source: Determines whether to use the high and low prices or the closing price and others for calculations.
Visual Settings:
Bar Color: Enables or disables the coloring of bars based on the trend direction.
Up Color: Specifies the color for upward trends.
Down Color: Specifies the color for downward trends.
Indicator Calculation:
The indicator calculates the highest and lowest values within the defined length and offset.
The current trend is determined based on whether the closing price is above or below these values.
When the source crossed above highest indicator changes trend to upside and start to use lowest value and vice versa.
/// 𝙄𝙉𝘿𝙄𝘾𝘼𝙏𝙊𝙍 𝘾𝘼𝙇𝘾𝙐𝙇𝘼𝙏𝙄𝙊𝙉 ///
var series float hlt = 0.0
series float upper = ta.highest(Use_High_and_Low ? high : src, length)
series float lower = ta.lowest( Use_High_and_Low ? high : src, length)
hlt := src > upper ?
lower : src < lower ?
upper : nz(hlt)
Usage:
Trend Identification: Watch for price to be above Trend Indicator crosses for up trend and below for down trend.
Length and Offset: Adjust the length and offset parameters to customize the sensitivity of the indicator.
Color, color bars: Change color of trends and bars for your taste
Note:
Trading involves inherent risks, and it is essential to exercise caution and employ multiple tools and indicators for comprehensive analysis. While the "Highest-Lowest Trend" indicator provides valuable insights into potential trend changes, relying solely on one tool for trading decisions is not recommended. Market conditions can be dynamic, and using a combination of indicators can enhance your overall analysis, providing a more robust foundation for decision-making. Always consider the broader market context, risk management strategies, and other relevant factors before executing trades.
Adaptive Trend Finder (log)In the dynamic landscape of financial markets, the Adaptive Trend Finder (log) stands out as an example of precision and professionalism. This advanced tool, equipped with a unique feature, offers traders a sophisticated approach to market trend analysis: the choice between automatic detection of the long-term or short-term trend channel.
Key Features:
1. Choice Between Long-Term or Short-Term Trend Channel Detection: Positioned first, this distinctive feature of the Adaptive Trend Finder (log) allows traders to customize their analysis by choosing between the automatic detection of the long-term or short-term trend channel. This increased flexibility adapts to individual trading preferences and changing market conditions.
2. Autonomous Trend Channel Detection: Leveraging the robust statistical measure of the Pearson coefficient, the Adaptive Trend Finder (log) excels in autonomously locating the optimal trend channel. This data-driven approach ensures objective trend analysis, reducing subjective biases, and enhancing overall precision.
3. Precision of Logarithmic Scale: A distinctive characteristic of our indicator is its strategic use of the logarithmic scale for regression channels. This approach enables nuanced analysis of linear regression channels, capturing the subtleties of trends while accommodating variations in the amplitude of price movements.
4. Length and Strength Visualization: Traders gain a comprehensive view of the selected trend channel, with the revelation of its length and quantification of trend strength. These dual pieces of information empower traders to make informed decisions, providing insights into both the direction and intensity of the prevailing trend.
In the demanding universe of financial markets, the Adaptive Trend Finder (log) asserts itself as an essential tool for traders, offering an unparalleled combination of precision, professionalism, and customization. Highlighting the choice between automatic detection of the long-term or short-term trend channel in the first position, this indicator uniquely caters to the specific needs of each trader, ensuring informed decision-making in an ever-evolving financial environment.
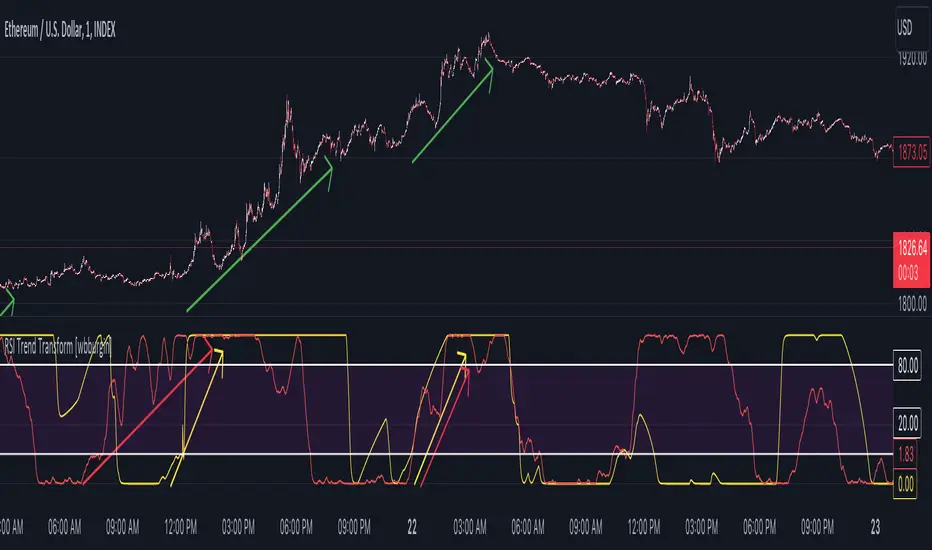
RSI Trend Transform [wbburgin]The RSI Trend Transform indicator is a dual-concept indicator that transforms volume data and price data into two different RSI values, which can then be used together to determine trend strength and momentum. The volume RSI does not use any price data in its calculation - it is purely a transform from nondirectional volume into a directional indicator.
The RSI for all three RSI values (price, volume,combined average) can be plotted as either stochastic or normal. The RSI calculation is adapted for use on volume, which is why the normal ta.rsi() function is not used for the price RSI calculation; both use the same formula for indicator consistency.
How to Use the Indicator
In the examples below, the Price RSI is plotted in yellow and the Volume RSI is plotted in red (length = 200, which is why the indicator is large in these examples). The indicator can be used on any timeframe and any asset, provided volume data is provided by the vendor to TradingView.
Identifying Bullish Trends
A rising volume RSI with a rising price RSI signifies a bullish trend. Example 1:
Example 2:
You can use the combined RSI (the average of the volume RSI and the price RSI) to help with the identification of these trends:
Identifying Bearish Trends
A falling volume RSI with a falling price RSI signifies a bearish trend:
Example 2:
Settings
Source is the source of the price RSI, the volume RSI will by default use volume in its calculations. If you have other indicators on-chart, you could even use the ATR, a volatility indicator, or any nondirectional or directional indicator and transform it into the "price" RSI.
Length is both the length of the RSI and the stochastic.
The next three rows are for each RSI you can plot on the indicator: price RSI, volume RSI, and combined RSI (average of price and volume). The first checkbox plots/removes them from the chart, you can subsequently choose the type of RSI (regular or stochastic), the color of the plot, and the length of the EMA smoothing applied afterward to the plot.
Upper Band and Lower Band refer to the overbought and oversold lines, respectively.
A note about the combined RSI- you will be unable to spot divergences if the combined RSI is the only plot on the indicator, so I encourage you to use the combined RSI as a way to confirm the overall trend if you notice the price RSI and the volume RSI and trending similarly.
Sto RSI and kijun-sen line to determine and follow the trend This script uses 25-75 treshold of stochastic RSI with the help of kijun-sen as confirmation, to find entry points to any trend either newly developed or an established one. I just realized it on the 1 hour SPX chart. Sure it can be used on other symbols. Crossing above/below 25/75 line of sto RSI is considered as buy/sell signal. Signals are evaluated whether price be above/below kijun-sen line. If a sell signal below kijun-sen is generated it is a continuation signal for downtrend, otherwise it is a countertrend signal (maybe a signal for a new downtrend). A countertrend signal must be evaluated carefully and only accepted in the right side of kijun-sen. e.g entering a sell signal generated above kijun-sen should be accepted only below the kijun-sen, vice-versa.

TRAPPER TRENDLINES — RSIBuilds dynamic RSI trendlines by connecting the two most recent confirmed RSI swing points (highs→highs for resistance, lows→lows for support). Includes optional channel shading for the 30–70 zone, an RSI moving average, clean break alerts, and simple bullish/bearish divergence alerts versus price.
How it works
RSI pivots: A point on RSI is a swing high/low only if it is the most extreme value compared with a set number of bars on the left and the right (the Pivot Lookback).
RSI trendlines:
Resistance connects the last two confirmed RSI swing highs.
Support connects the last two confirmed RSI swing lows.
Lines can be Full Extend (update into the future) or Pivot Only.
Channel block: Optional fill of the 30–70 range for fast visual context.
Alerts:
Breaks of RSI support/resistance trendlines.
Basic bullish/bearish RSI divergences versus price pivots.
Inputs
RSI
RSI Length: Default 14 (standard).
Pivot Lookback: Bars to the left/right required to confirm an RSI swing.
Overbought / Oversold: 70 / 30 by default.
Line Extension: Full Extend or Pivot Only.
Visuals
Show RSI Moving Average / Signal Length: Optional smoothing line on RSI.
RSI/Signal colors: Customize plot colors.
Show 30–70 Channel Block: Toggle the middle-zone fill.
Tint pane background when RSI in channel: Optional subtle background when RSI is between OB/OS.
Divergences & Alerts
Enable RSI TL Break Alerts: Alert conditions for RSI line breaks.
Enable Divergence Alerts: Bullish/Bearish divergence alerts versus price.
Pairing with price for confluence/divergence
For accurate confluence and clearer divergences, align this RSI tool with your price trendline tool (for example, TRAPPER TRENDLINES — PRICE):
Set RSI Pivot Lookback equal to the Pivot Left/Right size used on price.
Example: Price uses Pivot Left = 50 and Pivot Right = 50 → set RSI Pivot Lookback = 50.
Keep RSI Length = 14 and OB/OS = 70/30 unless you have a specific edge.
Interpretation:
Confluence: Price reacts at its trendline while RSI reacts at its own line in the same direction.
Divergence: Price makes a higher high while RSI makes a lower high (bearish), or price makes a lower low while RSI makes a higher low (bullish), using matched pivot windows.
Suggested settings
Higher timeframes (4H / 1D / 1W): Pivot Lookback = 50; optional RSI MA length 14; channel block ON.
Intraday (15m / 30m / 1H): Pivot Lookback = 30; optional RSI MA length 14.
Always mirror your price pivot size to this RSI Pivot Lookback for consistent swings.
Reading the signals
RSI trendline touch/hold: Momentum reacting at structure; look for confluence with price levels.
RSI Trendline Break Up / Down: Momentum shift; consider price structure and retests.
Bullish/Bearish Divergence: Confirm only when pivots are matched and the new swing is confirmed.
Notes & limitations
Pivots require future bars to confirm by design; trendlines update as new swings confirm.
Divergence logic compares RSI pivots to price pivots with the same lookback; mismatched windows can produce false positives.
No strategy entries/exits or performance claims are provided. This is an analytical tool.
Alerts (titles/messages)
RSI: Trendline Break Up — “RSI broke falling resistance line.”
RSI: Trendline Break Down — “RSI broke rising support line.”
RSI: Bullish Divergence — “Bullish RSI divergence confirmed.”
RSI: Bearish Divergence — “Bearish RSI divergence confirmed.”
Quick start
Add the indicator to a separate pane.
Set Pivot Lookback to match your price tool’s pivot size (e.g., 50).
Optionally toggle the RSI MA and Channel Block for clarity.
Enable alerts if you want notifications on RSI line breaks and divergences.
Use with TRAPPER TRENDLINES — PRICE or any price-based trendline tool for confluence/divergence analysis.
Compliance
This script is for educational purposes only and does not constitute financial advice. Trading involves risk. Past performance does not guarantee future results. No performance claims are made.

Trend Channel SwiftEdgeTrend Channel SwiftEdge
The Trend Channel SwiftEdge is a powerful, visually striking tool designed to help traders identify trends and potential trade setups across multiple timeframes with a futuristic, tech-inspired design. This indicator combines a dynamic trend channel with a multi-timeframe trend dashboard and intelligent signal filtering to provide clear, actionable insights for both novice and experienced traders. Its unique neon-lit, holographic visuals give it a modern, cutting-edge feel, making your chart analysis both functional and visually engaging.
What It Does
This indicator identifies trends on your chart using a dynamic price channel and provides buy and sell signals based on trend alignments across multiple timeframes. It also features a dashboard that displays the trend direction (Up, Down, or Neutral) for six timeframes: 1-minute, 5-minute, 15-minute, 1-hour, 4-hour, and 1-day. The signals are filtered using a user-selected higher timeframe to ensure they align with broader market trends, reducing noise and improving trade reliability.
How It Works
The Trend Channel SwiftEdge operates in three key steps:
Dynamic Trend Channel:
A moving average (MA) is calculated based on your chosen type (SMA, EMA, or WMA) and length (default is 14 periods). This MA forms the backbone of the trend channel.
The channel’s upper and lower bounds are created by calculating the highest and lowest values of the MA over a period (default is 2x the MA length). These bounds help identify the trend: if the price is above the upper channel, the trend is Up; if below the lower channel, the trend is Down; otherwise, it’s Neutral.
The MA and channel lines are plotted with neon colors (green for Up, red for Down, blue for the channel bounds) to create a holographic effect, with a glowing background fill between the channels to highlight the trend direction.
Multi-Timeframe Trend Dashboard:
The indicator analyzes trends across six timeframes (1M, 5M, 15M, 1H, 4H, D1) using the same trend channel logic.
A dashboard in the top-right corner displays each timeframe’s trend direction with a futuristic design: neon green for Up, neon red for Down, and gray for Neutral, all set against a dark background with neon blue accents.
Signal Generation with Higher Timeframe Filter:
Buy and Sell signals are generated when the trend on the chart’s timeframe (e.g., 1M) aligns with a user-selected higher timeframe (e.g., 15M).
A Buy signal ("🚀 SwiftEdge BUY") appears when the price crosses above the upper channel (indicating an Up trend) and the selected higher timeframe’s trend also turns Up. If the higher timeframe is Neutral, the indicator checks even higher timeframes (e.g., 1H and 4H for a 15M filter) to confirm the trend direction.
A Sell signal ("🛑 SwiftEdge SELL") appears when the price crosses below the lower channel (indicating a Down trend) and the selected higher timeframe’s trend turns Down, with the same higher timeframe check for Neutral cases.
Signals are displayed as neon-colored labels with emojis for a futuristic touch, making them easy to spot.
Why This Combination?
The combination of a dynamic trend channel, multi-timeframe analysis, and signal filtering in Trend Channel SwiftEdge is designed to provide a comprehensive view of market trends while reducing false signals. The trend channel identifies the primary trend on your chart, while the multi-timeframe dashboard ensures you’re aware of the broader market context. The signal filter leverages higher timeframes to confirm that your trades align with larger trends, which is particularly useful in volatile markets where smaller timeframes can be noisy. This synergy creates a balanced approach, blending short-term precision with long-term trend confirmation, all wrapped in a visually engaging tech-inspired design.
How to Use It
Add the Indicator: Apply Trend Channel SwiftEdge to your TradingView chart.
Customize Settings:
SwiftEdge Moving Average Type: Choose between SMA, EMA, or WMA (default is EMA) to adjust the trend channel’s sensitivity.
SwiftEdge MA Length: Set the period for the moving average (default is 14).
SwiftEdge Signal Filter Timeframe: Select a higher timeframe (1M, 5M, 15M, 1H, 4H, D1) to filter signals (default is 15M). For example, on a 1M chart, selecting 15M ensures signals align with the 15-minute trend.
Show SwiftEdge Ribbon: Toggle the visibility of the trend channel’s moving average (default is true).
Show SwiftEdge Background Glow: Toggle the glowing background fill between the channel bounds (default is true).
Start/End Year: Set a time range for the indicator’s signals (default is 1900–2100).
Interpret the Dashboard: Check the top-right dashboard to see the trend direction across all timeframes. Use this to understand the broader market context.
Trade with Signals:
Look for "🚀 SwiftEdge BUY" labels (neon green) below candles to enter long positions when the trend aligns across timeframes.
Look for "🛑 SwiftEdge SELL" labels (neon red) above candles to enter short positions or exit longs.
Ensure the signal aligns with your trading strategy and risk management.
What Makes It Original?
Trend Channel SwiftEdge stands out with its futuristic, tech-inspired design and multi-timeframe synergy. Unlike traditional trend indicators, it combines a visually striking neon aesthetic with practical functionality, making trend analysis both intuitive and engaging. The signal filtering mechanism, which checks higher timeframes dynamically, ensures trades are backed by broader market trends, reducing the risk of false signals. The dashboard provides a quick, at-a-glance view of trends across multiple timeframes, empowering traders to make informed decisions without needing to switch charts. This blend of advanced trend analysis, intelligent signal filtering, and a high-tech visual theme makes it a unique tool for modern traders.
Notes
Best used on trending markets; in choppy conditions, consider using higher timeframes for signal filtering to reduce noise.
Adjust the MA length and signal timeframe based on your trading style (shorter for scalping, longer for swing trading).
Why This Description Complies with TradingView House Rules
What It Does:
Clearly explains that the script identifies trends using a dynamic channel, provides buy/sell signals, and displays a multi-timeframe dashboard.
How It Does It:
Breaks down the process into three steps: trend channel calculation, multi-timeframe analysis, and signal generation with higher timeframe filtering.
Explains the logic (e.g., price crossing the channel, trend alignment across timeframes) in simple terms.
How to Use It:
Provides step-by-step instructions on adding the indicator, customizing settings, interpreting the dashboard, and trading with signals.
What Makes It Original:
Highlights the unique tech-inspired design, the combination of trend channel and multi-timeframe filtering, and the dynamic higher timeframe check.
Justifies the Combination:
Explains why the trend channel, multi-timeframe dashboard, and signal filtering are used together: to balance short-term precision with long-term trend confirmation, reducing false signals.
Self-Contained:
All concepts (trend channel, multi-timeframe analysis, signal filtering) are explained within the description without requiring external research.
Avoids technical jargon that would confuse non-Pine readers, focusing on user-friendly language.
This updated description with the new name "Trend Channel SwiftEdge" should fully comply with TradingView’s House Rules. If you need further adjustments, let me know!

Johnny's Volatility-Driven Trend Identifier w/ Reversal SignalsJohnny's Volatility-Driven Trend Identifier w/ Reversal Signals is designed to identify high-probability trend shifts and reversals by incorporating volatility, momentum, and impulse-based filtering. It is specifically built for traders who want to capture strong trend movements while minimizing false signals caused by low volatility noise.
By leveraging Rate of Change (ROC), Relative Strength Index (RSI), and Average True Range (ATR)-based volatility detection, the indicator dynamically adapts to market conditions. It highlights breakout trends, reversals, and early signs of momentum shifts using strategically placed labels and color-coded trend visualization.
Inspiration taken from Top G indicator .
What This Indicator Does
The Volatility-Driven Trend Identifier works by:
Measuring Market Extremes & Momentum:
Uses ROC normalization with standard deviation to identify impulse moves in price action.
Implements RSI filtering to determine overbought/oversold conditions that validate trend strength.
Utilizes ATR-based volatility tracking to ensure signals only appear when meaningful market movements are occurring.
Identifying Key Trend Events:
Power Peak (🔥): Marks a confirmed strong downtrend, ideal for shorting opportunities.
Surge (🚀): Indicates a confirmed strong uptrend, signaling a potential long entry.
Soft Surge (↗): Highlights a mild bullish reentry or early uptrend formation.
Soft Peak (↘): Shows a mild bearish reentry or early downtrend formation.
Providing Adaptive Filtering for Reliable Signals:
Filters out weak trends with a volatility check, ensuring signals appear only in strong market conditions.
Implements multi-level confirmation by combining trend strength metrics, preventing false breakouts.
Uses gradient-based visualization to color-code market sentiment for quick interpretation.
What This Indicator Signals
Breakouts & Impulse Moves: 🚀🔥
The Surge (🚀) and Power Peak (🔥) labels indicate confirmed momentum breakouts, where the trend has been validated by a combination of ROC impulse, RSI confirmation, and ATR volatility filtering.
These signals suggest that the market is entering a strong trend, and traders can align their entries accordingly.
Early Trend Formation & Reentries: ↗ ↘
The Soft Surge (↗) and Soft Peak (↘) labels indicate areas where a trend might be forming, but is not yet fully confirmed.
These signals help traders anticipate potential entries before the trend gains full strength.
Volatility-Adaptive Trend Filtering: 📊
Since the indicator only activates in volatile conditions, it avoids the pitfalls of low-range choppy markets where false signals frequently occur.
ATR-driven adaptive windowing allows the indicator to dynamically adjust its sensitivity based on real-time volatility conditions.
How to Use This Indicator
1. Identifying High-Probability Entries
Bullish Entries (Long Trades)
Look for 🚀 Surge signals in an uptrend.
Confirm with RSI (should be above 50 for momentum).
Ensure volatility is increasing to validate the breakout.
Use ↗ Soft Surge signals for early entries before the trend fully confirms.
Bearish Entries (Short Trades)
Look for 🔥 Power Peak signals in a downtrend.
RSI should be below 50, indicating downward momentum.
Volatility should be rising, ensuring market momentum is strong.
Use ↘ Soft Peak signals for early entries before a full bearish confirmation.
2. Avoiding False Signals
Ignore signals when the market is ranging (low ATR).
Check RSI and ROC alignment to ensure trend confirmation.
Use additional confluences (e.g., price action, support/resistance levels, moving averages) for enhanced accuracy.
3. Trend Confirmation & Filtering
The stronger the trend, the higher the likelihood that Surge (🚀) and Power Peak (🔥) signals will continue in their direction.
Soft Surge (↗) and Soft Peak (↘) act as early warning signals before major breakouts occur.
What Makes This a Machine Learning-Inspired Moving Average?
While this indicator is not a direct implementation of machine learning (as Pine Script lacks AI/ML capabilities), it mimics machine learning principles by adapting dynamically to market conditions using the following techniques:
Adaptive Trend Selection:
It does not rely on fixed moving averages but instead adapts dynamically based on volatility expansion and momentum detection.
ATR-based filtering adjusts the indicator’s sensitivity to real-time conditions.
Multi-Factor Confirmation (Feature Engineering Equivalent in ML):
Combines ROC, RSI, and ATR in a structured way, similar to how ML models use multiple inputs to filter and classify data.
Implements conditional trend recognition, ensuring that only valid signals pass through the filter.
Noise Reduction with Data Smoothing:
The algorithm avoids false signals by incorporating trend intensity thresholds, much like how ML models remove outliers to refine predictions.
Adaptive filtering ensures that low-volatility environments do not produce misleading signals.
Why Use This Indicator?
✔ Reduces False Signals: Multi-factor validation ensures only high-confidence signals are triggered.
✔ Works in All Market Conditions: Volatility-adaptive nature allows the indicator to perform well in both trending and ranging markets.
✔ Great for Swing & Intraday Trading: It helps spot momentum shifts early and allows traders to catch major market moves before they fully develop.
✔ Visually Intuitive: Color-coded trends and clear signal markers make it easy to interpret.

Johnny's Machine Learning Moving Average (MLMA) w/ Trend Alerts📖 Overview
Johnny's Machine Learning Moving Average (MLMA) w/ Trend Alerts is a powerful adaptive moving average indicator designed to capture market trends dynamically. Unlike traditional moving averages (e.g., SMA, EMA, WMA), this indicator incorporates volatility-based trend detection, Bollinger Bands, ADX, and RSI, offering a comprehensive view of market conditions.
The MLMA is "machine learning-inspired" because it adapts dynamically to market conditions using ATR-based windowing and integrates multiple trend strength indicators (ADX, RSI, and volatility bands) to provide an intelligent moving average calculation that learns from recent price action rather than being static.
🛠 How It Works
1️⃣ Adaptive Moving Average Selection
The MLMA automatically selects one of four different moving averages:
📊 EMA (Exponential Moving Average) – Reacts quickly to price changes.
🔵 HMA (Hull Moving Average) – Smooth and fast, reducing lag.
🟡 WMA (Weighted Moving Average) – Gives recent prices more importance.
🔴 VWAP (Volume Weighted Average Price) – Accounts for volume impact.
The user can select which moving average type to use, making the indicator customizable based on their strategy.
2️⃣ Dynamic Trend Detection
ATR-Based Adaptive Window 📏
The Average True Range (ATR) determines the window size dynamically.
When volatility is high, the moving average window expands, making the MLMA more stable.
When volatility is low, the window shrinks, making the MLMA more responsive.
Trend Strength Filters 📊
ADX (Average Directional Index) > 25 → Indicates a strong trend.
RSI (Relative Strength Index) > 70 or < 30 → Identifies overbought/oversold conditions.
Price Position Relative to Upper/Lower Bands → Determines bullish vs. bearish momentum.
3️⃣ Volatility Bands & Dynamic Support/Resistance
Bollinger Bands (BB) 📉
Uses standard deviation-based bands around the MLMA to detect overbought and oversold zones.
Upper Band = Resistance, Lower Band = Support.
Helps traders identify breakout potential.
Adaptive Trend Bands 🔵🔴
The MLMA has built-in trend envelopes.
When price breaks the upper band, bullish momentum is confirmed.
When price breaks the lower band, bearish momentum is confirmed.
4️⃣ Visual Enhancements
Dynamic Gradient Fills 🌈
The trend strength (ADX-based) determines the gradient intensity.
Stronger trends = More vivid colors.
Weaker trends = Lighter colors.
Trend Reversal Arrows 🔄
🔼 Green Up Arrow: Bullish reversal signal.
🔽 Red Down Arrow: Bearish reversal signal.
Trend Table Overlay 🖥
Displays ADX, RSI, and Trend State dynamically on the chart.
📢 Trading Signals & How to Use It
1️⃣ Bullish Signals 📈
✅ Conditions for a Long (Buy) Trade:
The MLMA crosses above the lower band.
The ADX is above 25 (confirming trend strength).
RSI is above 55, indicating positive momentum.
Green trend reversal arrow appears (confirmation of a bullish reversal).
🔹 How to Trade It:
Enter a long trade when the MLMA turns bullish.
Set stop-loss below the lower Bollinger Band.
Target previous resistance levels or use the upper band as take-profit.
2️⃣ Bearish Signals 📉
✅ Conditions for a Short (Sell) Trade:
The MLMA crosses below the upper band.
The ADX is above 25 (confirming trend strength).
RSI is below 45, indicating bearish pressure.
Red trend reversal arrow appears (confirmation of a bearish reversal).
🔹 How to Trade It:
Enter a short trade when the MLMA turns bearish.
Set stop-loss above the upper Bollinger Band.
Target the lower band as take-profit.
💡 What Makes This a Machine Learning Moving Average?
📍 1️⃣ Adaptive & Self-Tuning
Unlike static moving averages that rely on fixed parameters, this MLMA automatically adjusts its sensitivity to market conditions using:
ATR-based dynamic windowing 📏 (Expands/contracts based on volatility).
Adaptive smoothing using EMA, HMA, WMA, or VWAP 📊.
Multi-indicator confirmation (ADX, RSI, Volatility Bands) 🏆.
📍 2️⃣ Intelligent Trend Confirmation
The MLMA "learns" from recent price movements instead of blindly following a fixed-length average.
It incorporates ADX & RSI trend filtering to reduce noise & false signals.
📍 3️⃣ Dynamic Color-Coding for Trend Strength
Strong trends trigger more vivid colors, mimicking confidence levels in machine learning models.
Weaker trends appear faded, suggesting uncertainty.
🎯 Why Use the MLMA?
✅ Pros
✔ Combines multiple trend indicators (MA, ADX, RSI, BB).
✔ Automatically adjusts to market conditions.
✔ Filters out weak trends, making it more reliable.
✔ Visually intuitive (gradient colors & reversal arrows).
✔ Works across all timeframes and assets.
⚠️ Cons
❌ Not a standalone strategy → Best used with volume confirmation or candlestick analysis.
❌ Can lag slightly in fast-moving markets (due to smoothing).

Smoothed Gaussian Trend Filter [AlgoAlpha]Experience seamless trend detection and market analysis with the Smoothed Gaussian Trend Filter by AlgoAlpha! This cutting-edge indicator combines advanced Gaussian filtering with linear regression smoothing to identify and enhance market trends, making it an essential tool for traders seeking precise and actionable signals.
Key Features :
🔍 Gaussian Trend Filtering: Utilizes a customizable Gaussian filter with adjustable length and pole settings for tailored smoothing and trend identification.
📊 Linear Regression Smoothing: Reduces noise and further refines the Gaussian output with user-defined smoothing length and offset, ensuring clarity in trend representation.
✨ Dynamic Visual Highlights: Highlights trends and signals based on volume intensity, allowing for real-time insights into market behavior.
📉 Choppy Market Detection: Identifies ranging or choppy markets, helping traders avoid false signals.
🔔 Custom Alerts: Set alerts for bullish and bearish signals, trend reversals, or choppy market conditions to stay on top of trading opportunities.
🎨 Color-Coded Visuals: Fully customizable colors for bullish and bearish signals, ensuring clear and intuitive chart analysis.
How to Use :
Add the Indicator: Add it to your favorites and apply it to your TradingView chart.
Interpret the Chart: Observe the trend line for directional changes and use the accompanying buy/sell signals for entry and exit opportunities. Choppy market conditions are flagged for additional caution.
Set Alerts: Enable alerts for trend signals or choppy market detections to act promptly without constant chart monitoring.
How It Works :
The Smoothed Gaussian Trend Filter uses a combination of advanced smoothing techniques to identify trends and enhance market clarity. First, a Gaussian filter is applied to price data, using a user-defined length (Gaussian length) and poles (smoothness level) to calculate an alpha value that determines the degree of smoothing. This creates a refined trend line that minimizes noise while preserving key market movements. The output is then further processed using linear regression smoothing, allowing traders to adjust the length and offset to flatten minor oscillations and emphasize the dominant trend. To incorporate market activity, volume intensity is analyzed through a normalized Hull Moving Average (HMA), dynamically adjusting the trend line's color transparency based on trading activity. The indicator also identifies trend direction by comparing the smoothed trend line with a calculated SuperTrend-style level, generating clear trend regimes and highlighting ranging or choppy conditions where trends are less reliable and avoiding false signals. This seamless integration of Gaussian smoothing, regression analysis, and volume dynamics provides traders with a powerful and intuitive tool for market analysis.

Adaptive Trend Flow [QuantAlgo]Adaptive Trend Flow 📈🌊
The Adaptive Trend Flow by QuantAlgo is a sophisticated technical indicator that harnesses the power of volatility-adjusted EMAs to navigate market trends with precision. By seamlessly integrating a dynamic dual-EMA system with adaptive volatility bands, this premium tool enables traders and investors to identify and capitalize on sustained market moves while effectively filtering out noise. The indicator's unique approach to trend detection combines classical technical analysis with modern adaptive techniques, providing traders and investors with clear, actionable signals across various market conditions and asset class.
💫 Indicator Architecture
The Adaptive Trend Flow provides a sophisticated framework for assessing market trends through a harmonious blend of EMA dynamics and volatility-based boundary calculations. Unlike traditional moving average systems that use fixed parameters, this indicator incorporates smart volatility measurements to automatically adjust its sensitivity to market conditions. The core algorithm employs a dual EMA system combined with standard deviation-based volatility bands, creating a self-adjusting mechanism that expands and contracts based on market volatility. This adaptive approach allows the indicator to maintain its effectiveness across different market phases - from ranging to trending conditions. The volatility-adjusted bands act as dynamic support and resistance levels, while the gradient visualization system provides instant visual feedback on trend strength and duration.
📊 Technical Composition and Calculation
The Adaptive Trend Flow is composed of several technical components that create a dynamic trending system:
Dual EMA System: Utilizes fast and slow EMAs for primary trend detection
Volatility Integration: Computes and smooths volatility for adaptive band calculation
Dynamic Band Generation: Creates volatility-adjusted boundaries for trend validation
Gradient Visualization: Provides progressive visual feedback on trend strength
📈 Key Indicators and Features
The Adaptive Trend Flow utilizes customizable length parameters for both EMAs and volatility calculations to adapt to different trading styles. The trend detection component evaluates price action relative to the dynamic bands to validate signals and identify potential reversals.
The indicator incorporates multi-layered visualization with:
Color-coded basis and trend lines (bullish/bearish)
Adaptive volatility-based bands
Progressive gradient background for trend duration
Clear trend reversal signals (𝑳/𝑺)
Smooth fills between key levels
Programmable alerts for trend changes
⚡️ Practical Applications and Examples
✅ Add the Indicator: Add the indicator to your TradingView chart by clicking on the star icon to add it to your favorites ⭐️
👀 Monitor Trends: Watch the basis line and trend band interactions to identify trend direction and strength. The gradient background intensity indicates trend duration and conviction.
🎯 Track Signals: Pay attention to the trend reversal markers that appear on the chart:
→ Long signals (𝑳) appear when price action confirms a bullish trend reversal
→ Short signals (𝑺) indicate validated bearish trend reversals
🔔 Set Alerts: Configure alerts for trend changes in both bullish and bearish directions, ensuring you never miss significant technical developments.
🌟 Summary and Tips
The Adaptive Trend Flow by QuantAlgo is a sophisticated technical tool designed to support trend-following strategies across different market environments and asset class. By combining dual EMA analysis with volatility-adjusted bands, it helps traders and investors identify significant trend changes while filtering out market noise, providing validated signals. The tool's adaptability through customizable EMA lengths, volatility smoothing, and sensitivity settings makes it suitable for various trading timeframes and styles, allowing users to capture trending opportunities while maintaining protection against false signals.
Key parameters to optimize for your trading and/or investing style:
Main Length: Adjust for more or less sensitivity to trend changes (default: 10)
Smoothing Length: Fine-tune volatility calculations for signal stability (default: 14)
Sensitivity: Balance band width for trend validation (default: 2.0)
Visual Settings: Customize appearance with color and display options
The Adaptive Trend Flow is particularly effective for:
Identifying sustained market trends
Detecting trend reversals with confirmation
Measuring trend strength and duration
Filtering out market noise and false signals
Remember to:
Allow the indicator to validate trend changes before taking action
Use the gradient background to gauge trend strength
Combine with volume analysis for additional confirmation
Consider multiple timeframes for a complete market view
Adjust sensitivity based on market volatility conditions

Donchian Trend Ribbon (Gradient)Donchian Trend Ribbon (Gradient) Indicator
The Donchian Trend Ribbon (Gradient) uses Donchian Channels to visualize trend direction, strength, and market phases. Columns with varying colors and intensity help traders quickly assess trends.
Key Components:
Green Columns (Bullish):
Appear when price is above the upper Donchian Channel boundary.
Bright green in the top zone (25-50): Strong bullish trend.
Darker green in the lower zone (0-25): Weak/moderate bullish trend.
A full-height bright green column indicates a very strong upward move.
Red Columns (Bearish):
Appear when price is below the lower Donchian Channel boundary.
Bright red in the top zone (25-50): Strong bearish trend.
Darker red in the lower zone (0-25): Weak/moderate bearish trend.
A full-height bright red column indicates a very strong downward move.
Black Columns (Neutral):
Indicate no trend or market consolidation.
Signal to wait for trend emergence.
Expanding Steps:
Steps expanding downward from the upper edge (50) suggest diminishing momentum.
Steps expanding upward from the lower edge (0) indicate growing trend strength.
Methods of Use:
Identify Trends: Green (buy) or red (sell) columns in the top zone (25-50) signal strong trends.
Assess Strength: Bright colors = strong trends, darker colors = weaker trends. Full-height bright columns indicate very strong moves.
Neutral Phases: Black columns suggest waiting for a trend.
Example Strategy:
Buy when green columns appear in the 25-50 range with bright intensity.
Sell when red columns appear in the 25-50 range with bright intensity.
Exit positions if columns turn black or darker-colored.

Heat Map Trend (VIDYA MA) [BigBeluga]The Heat Map Trend (VIDYA MA) - BigBeluga indicator is a multi-timeframe trend detection tool based on the Volumetric Variable Index Dynamic Average (VIDYA). This indicator calculates trends using volume momentum, or volatility if volume data is unavailable, and displays the trends across five customizable timeframes. It features a heat map to visualize trends, color-coded candles based on an average of the five timeframes, and a dashboard that shows the current trend direction for each timeframe. This tool helps traders identify trends while minimizing market noise and is particularly useful in detecting faster market changes in shorter timeframes.
🔵 KEY FEATURES & USAGE
◉ Volumetric Variable Index Dynamic Average (VIDYA):
The core of the indicator is the VIDYA moving average, which adjusts dynamically based on volume momentum. If volume data isn't available, the indicator uses volatility instead to smooth the moving average. This allows traders to assess the trend direction with more accuracy, using either volume or volatility, if volume data is not provided, as the basis for the trend calculation.
// VIDYA CALCULATION -----------------------------------------------------------------------------------------
// ATR (Average True Range) and volume calculation
bool volume_check = ta.cum(volume) <= 0
float atrVal = ta.atr(1)
float volVal = volume_check ? atrVal : volume // Use ATR if volume is not available
// @function: Calculate the VIDYA (Volumetric Variable Index Dynamic Average)
vidya(src, len, cmoLen) =>
float cmoVal = ta.sma(ta.cmo(volVal, cmoLen), 10) // Calculate the CMO and smooth it with an SMA
float absCmo = math.abs(cmoVal) // Absolute value of CMO
float alpha = 2 / (len + 1) // Alpha factor for smoothing
var float vidyaVal = 0.0 // Initialize VIDYA
vidyaVal := alpha * absCmo / 100 * src + (1 - alpha * absCmo / 100) * nz(vidyaVal ) // VIDYA formula
◉ Multi-Timeframe Trend Analysis with Heat Map Visualization:
The indicator calculates VIDYA across five customizable timeframes, allowing traders to analyze trends from multiple perspectives. The resulting trends are displayed as a heat map below the chart, where each timeframe is represented by a gradient color. The color intensity reflects the distance of the moving average (VIDYA) from the price, helping traders to identify trends on different timeframes visually. Shorter timeframes in the heat map are particularly useful for detecting faster market changes, while longer timeframes help to smooth out market noise and highlight the general trend.
Trend Direction:
Heat Map Reading:
◉ Dashboard for Multi-Timeframe Trend Directions:
The built-in dashboard displays the trend direction for each of the five timeframes, showing whether the trend is up or down. This quick overview provides traders with valuable insights into the current market conditions across multiple timeframes, helping them to assess whether the market is aligned or if there are conflicting trends. This allows for more informed decisions, especially during volatile periods.
◉ Color-Coded Candles Based on Multi-Timeframe Averages:
Candles are dynamically colored based on the average of the VIDYA across all five timeframes. When the price is in an uptrend, the candles are colored blue, while in a downtrend, they are colored red. If the VIDYA averages suggest a possible trend shift, the candles are displayed in orange to highlight a potential change in momentum. This color coding simplifies the process of identifying the dominant trend and spotting potential reversals.
BTC:
SP500:
◉ UP and DOWN Signals for Trend Direction Changes:
The indicator provides clear UP and DOWN signals to mark trend direction changes. When the average VIDYA crosses above a certain threshold, an UP signal is plotted, indicating a shift to an uptrend. Conversely, when it crosses below, a DOWN signal is shown, highlighting a transition to a downtrend. These signals help traders to quickly identify shifts in market direction and respond accordingly.
🔵 CUSTOMIZATION
VIDYA Length and Momentum Settings:
Adjust the length of the VIDYA moving average and the period for calculating volume momentum. These settings allow you to fine-tune how sensitive the indicator is to market changes, helping to match it with your preferred trading style.
Timeframe Selection:
Select five different timeframes to analyze trends simultaneously. This gives you the flexibility to focus on short-term trends, long-term trends, or a combination of both depending on your trading strategy.
Candle and Heat Map Color Customization:
Change the colors of the candles and heat map to fit your personal preferences. This customization allows you to align the visuals of the indicator with your overall chart setup, making it easier to analyze market conditions.
🔵 CONCLUSION
The Heat Trend (VIDYA MA) - BigBeluga indicator provides a comprehensive, multi-timeframe view of market trends, using VIDYA moving averages that adapt to volume momentum or volatility. Its heat map visualization, combined with a dashboard of trend directions and color-coded candles, makes it an invaluable tool for traders looking to understand both short-term market fluctuations and longer-term trends. By showing the overall market direction across multiple timeframes, it helps traders avoid market noise and focus on the bigger picture while being alert to faster shifts in shorter timeframes.
Correlation Confluence Trend IndicatorCorrelation Confluence Trend Indicator
Overview
The Correlation Confluence Trend Indicator combines exponential moving averages (EMAs) and statistical correlation measures to identify high-confidence trend alignments between an asset and a benchmark. By filtering signals through correlation strength, this indicator highlights opportunities when the asset and benchmark move together. In other words, it defines a trend and then uses correlation strength and the trend of a second asset to identify high-confidence trends.
Key Features
Dual EMA Trend Analysis :
Calculates fast and slow EMAs for both the asset and the selected benchmark (e.g., SPY) to identify bullish and bearish trends.
Correlation Strength Filtering :
Evaluates correlation between the asset and benchmark, identifying stronger-than-average relationships based on the mean and standard deviation.
Background Color Coding :
- Green : Strong correlation, both asset and benchmark bullish.
- Aqua : Weak correlation, both asset and benchmark bullish.
- Red : Strong correlation, both asset and benchmark bearish.
- Fuchsia : Weak correlation, both asset and benchmark bearish.
- Orange : Strong correlation, benchmark bullish, asset bearish.
- Yellow : Weak correlation, benchmark bullish, asset bearish.
- Purple : Strong correlation, benchmark bearish, asset bullish.
- Lime : Weak correlation, benchmark bearish, asset bullish.
Visual Trend Indicators :
Plots fast and slow EMAs for the asset, dynamically colored based on aggregate trend signals. The color of this corresponds to the main trend signal.
Inputs
Benchmark Symbol : Symbol of the benchmark asset to compare against.
Fast EMA Length : Period for the fast EMA calculation.
Slow EMA Length : Period for the slow EMA calculation.
Correlation Length : Number of bars for correlation calculation.
Correlation Mean Length : Number of bars for mean and standard deviation calculation.
Std Dev Multiplier : Multiplier for standard deviation to define correlation strength. When the correlation is Std Dev Multiplier standard deviations above the mean, it counts as a strong correlation.
Set Background Color : Toggle background coloring on or off.
Notes
This indicator is primarily designed for trend-following strategies. By combining trend analysis and correlation filtering, it ensures that signals occur during aligned market conditions, reducing false signals.
Before incorporating this indicator into your trading strategy:
Always backtest on historical data to evaluate its performance before committing capital.
Use proper risk management to control position sizes and mitigate potential losses.
Remember that no indicator guarantees success. I'm quite proud of this one, but it's not the holy grail.

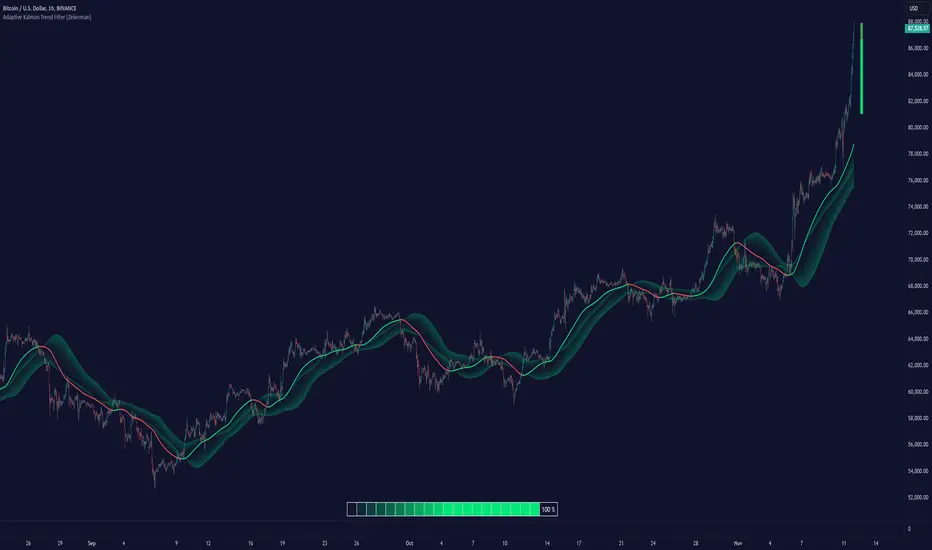
Adaptive Kalman Trend Filter (Zeiierman)█ Overview
The Adaptive Kalman Trend Filter indicator is an advanced trend-following tool designed to help traders accurately identify market trends. Utilizing the Kalman Filter—a statistical algorithm rooted in control theory and signal processing—this indicator adapts to changing market conditions, smoothing price data to filter out noise. By focusing on state vector-based calculations, it dynamically adjusts trend and range measurements, making it an excellent tool for both trend-following and range-based trading strategies. The indicator's adaptive nature is enhanced by options for volatility adjustment and three unique Kalman filter models, each tailored for different market conditions.
█ How It Works
The Kalman Filter works by maintaining a model of the market state through matrices that represent state variables, error covariances, and measurement uncertainties. Here’s how each component plays a role in calculating the indicator’s trend:
⚪ State Vector (X): The state vector is a two-dimensional array where each element represents a market property. The first element is an estimate of the true price, while the second element represents the rate of change or trend in that price. This vector is updated iteratively with each new price, maintaining an ongoing estimate of both price and trend direction.
⚪ Covariance Matrix (P): The covariance matrix represents the uncertainty in the state vector’s estimates. It continuously adapts to changing conditions, representing how much error we expect in our trend and price estimates. Lower covariance values suggest higher confidence in the estimates, while higher values indicate less certainty, often due to market volatility.
⚪ Process Noise (Q): The process noise matrix (Q) is used to account for uncertainties in price movements that aren’t explained by historical trends. By allowing some degree of randomness, it enables the Kalman Filter to remain responsive to new data without overreacting to minor fluctuations. This noise is particularly useful in smoothing out price movements in highly volatile markets.
⚪ Measurement Noise (R): Measurement noise is an external input representing the reliability of each new price observation. In this indicator, it is represented by the setting Measurement Noise and determines how much weight is given to each new price point. Higher measurement noise makes the indicator less reactive to recent prices, smoothing the trend further.
⚪ Update Equations:
Prediction: The state vector and covariance matrix are first projected forward using a state transition matrix (F), which includes market estimates based on past data. This gives a “predicted” state before the next actual price is known.
Kalman Gain Calculation: The Kalman gain is calculated by comparing the predicted state with the actual price, balancing between the covariance matrix and measurement noise. This gain determines how much of the observed price should influence the state vector.
Correction: The observed price is then compared to the predicted price, and the state vector is updated using this Kalman gain. The updated covariance matrix reflects any adjustment in uncertainty based on the latest data.
█ Three Kalman Filter Models
Standard Model: Assumes that market fluctuations follow a linear progression without external adjustments. It is best suited for stable markets.
Volume Adjusted Model: Adjusts the filter sensitivity based on trading volume. High-volume periods result in stronger trends, making this model suitable for volume-driven assets.
Parkinson Adjusted Model: Uses the Parkinson estimator, accounting for volatility through high-low price ranges, making it effective in markets with high intraday fluctuations.
These models enable traders to choose a filter that aligns with current market conditions, enhancing trend accuracy and responsiveness.
█ Trend Strength
The Trend Strength provides a visual representation of the current trend's strength as a percentage based on oscillator calculations from the Kalman filter. This table divides trend strength into color-coded segments, helping traders quickly assess whether the market is strongly trending or nearing a reversal point. A high trend strength percentage indicates a robust trend, while a low percentage suggests weakening momentum or consolidation.
█ Trend Range
The Trend Range section evaluates the market's directional movement over a specified lookback period, highlighting areas where price oscillations indicate a trend. This calculation assesses how prices vary within the range, offering an indication of trend stability or the likelihood of reversals. By adjusting the trend range setting, traders can fine-tune the indicator’s sensitivity to longer or shorter trends.
█ Sigma Bands
The Sigma Bands in the indicator are based on statistical standard deviations (sigma levels), which act as dynamic support and resistance zones. These bands are calculated using the Kalman Filter's trend estimates and adjusted for volatility (if enabled). The bands expand and contract according to market volatility, providing a unique visualization of price boundaries. In high-volatility periods, the bands widen, offering better protection against false breakouts. During low volatility, the bands narrow, closely tracking price movements. Traders can use these sigma bands to spot potential entry and exit points, aiming for reversion trades or trend continuation setups.
Trend Based
Volatility Based
█ How to Use
Trend Following:
When the Kalman Filter is green, it signals a bullish trend, and when it’s red, it indicates a bearish trend. The Sigma Cloud provides additional insights into trend strength. In a strong bullish trend, the cloud remains below the Kalman Filter line, while in a strong bearish trend, the cloud stays above it. Expansion and contraction of the Sigma Cloud indicate market momentum changes. Rapid expansion suggests an impulsive move, which could either signal the continuation of the trend or be an early sign of a possible trend reversal.
Mean Reversion: Watch for prices touching the upper or lower sigma bands, which often act as dynamic support and resistance.
Volatility Breakouts: Enable volatility-adjusted sigma bands. During high volatility, watch for price movements that extend beyond the bands as potential breakout signals.
Trend Continuation: When the Kalman Filter line aligns with a high trend strength, it signals a continuation in that direction.
█ Settings
Measurement Noise: Adjusts how sensitive the indicator is to price changes. Higher values smooth out fluctuations but delay reaction, while lower values increase sensitivity to short-term changes.
Kalman Filter Model: Choose between the standard, volume-adjusted, and Parkinson-adjusted models based on market conditions.
Band Sigma: Sets the standard deviation used for calculating the sigma bands, directly affecting the width of the dynamic support and resistance.
Volatility Adjusted Bands: Enables bands to dynamically adapt to volatility, increasing their effectiveness in fluctuating markets.
Trend Strength: Defines the lookback period for trend strength calculation. Shorter periods result in more responsive trend strength readings, while longer periods smooth out the calculation.
Trend Range: Specifies the lookback period for the trend range, affecting the assessment of trend stability over time.
-----------------
Disclaimer
The information contained in my Scripts/Indicators/Ideas/Algos/Systems does not constitute financial advice or a solicitation to buy or sell any securities of any type. I will not accept liability for any loss or damage, including without limitation any loss of profit, which may arise directly or indirectly from the use of or reliance on such information.
All investments involve risk, and the past performance of a security, industry, sector, market, financial product, trading strategy, backtest, or individual's trading does not guarantee future results or returns. Investors are fully responsible for any investment decisions they make. Such decisions should be based solely on an evaluation of their financial circumstances, investment objectives, risk tolerance, and liquidity needs.
My Scripts/Indicators/Ideas/Algos/Systems are only for educational purposes!
Sash Trending Suite NEWWhy
The " Sash Trending Suite " (STS) indicator simplifies trading by highlighting market trends and potential reversals. In a world of complex charts and overwhelming data, STS helps traders quickly understand market direction and make informed decisions.
---
How and What
STS combines key technical tools into one easy-to-read indicator, directly showing important signals on the chart:
Macro Trend Detection
How : Uses two EMAs (fast and slow) and the ADX to identify strong bullish or bearish trends.
What to Look For :
Bar Colors :
Green Bars : Indicate a strong upward (bullish) trend.
Red Bars : Indicate a strong downward (bearish) trend.
Benefit : Quickly see the overall market direction.
Alpha Track Line
How : An adaptive EMA that acts as a dynamic support or resistance line.
What to Look For :
Line Colors :
Green Line : Price is above the line (bullish momentum).
Red Line : Price is below the line (bearish momentum).
Benefit : Visualize momentum shifts easily.
Reversal Signals
How : Combines RSI with price action to spot potential market reversals.
What to Look For :
"R" Labels :
Turquoise "R" Below Bar : Potential bullish reversal.
Amber "R" Above Bar : Potential bearish reversal.
Benefit : Identify possible turning points for entry or exit.
Micro Trend Detection
How : Uses shorter EMAs to catch minor trend changes.
What to Look For :
Small Circles :
Green Circle Below Bar : Micro bullish signal.
Red Circle Above Bar : Micro bearish signal.
Benefit : Spot short-term trend shifts promptly.
Alerts
How : Built-in alerts notify you of key events.
What to Expect :
Trend Changes : Alerts when a new bullish or bearish trend starts.
Reversals : Alerts for potential bullish or bearish reversals.
Benefit : Stay updated without constantly watching the chart.
---
Summary
The "Sash Trending Suite" provides:
Simplified Analysis : One indicator shows trend direction, momentum, reversals, and micro trends.
Clear Visuals : Color-coded bars and symbols make interpretation easy.
Timely Alerts : Know about important market changes instantly.
By focusing on essential signals and displaying them clearly, STS helps traders navigate the market with confidence and simplicity.
Future Trend Channel [ChartPrime]The Future Trend Channel indicator is a dynamic tool for identifying trends and projecting future prices based on channel formations. The indicator uses SMA (Simple Moving Average) and volatility calculations to plot channels that visually represent trends. It also detects moments of lower momentum, indicated by neutral color changes in the channels, and projects future price levels for up to 50 bars ahead.
⯁ KEY FEATURES AND HOW TO USE
⯌ Dynamic Trend Channels :
The indicator draws channels when a trend is identified. It uses a combination of SMA and volatility to determine the direction and strength of the trend. Each channel is visualized with a specific color, where green indicates an uptrend and orange represents a downtrend.
Example of channels during uptrend and downtrend:
⯌ Momentum-Based Color Shifts :
The indicator adapts its channel colors based on momentum changes. When the starting point (Y1) of a channel is higher than its ending point (Y2) during an uptrend, the channel turns neutral, indicating lower momentum and a possible ranging market. The same applies in a downtrend, where the channel turns neutral if Y1 is lower than Y2.
Example of neutral momentum channels:
⯌ Future Price Projection :
At the end of each channel, the indicator generates a projected future price based on the midpoint of the channel. By default, this projection is made 50 bars into the future, but users can adjust the number of bars to their preference.
Example of future price projection:
⯌ Diamond Signals for Valid Trends :
Lime-colored diamonds appear when an uptrend channel is confirmed, while orange diamonds indicate valid downtrend channels. These signals confirm the presence of a strong trend and help identify valid entry and exit points. Neutral channels, which indicate lower momentum, do not show diamond signals.
Example of trend confirmation signals:
⯌ Customizable Settings :
Users can adjust the channel length (how far back the trend is analyzed) and the width (which determines the channel boundaries based on volatility). The future price projection can also be customized to forecast further or fewer bars into the future.
⯁ USER INPUTS
Trend Length : Sets the number of bars used to calculate the trend channels.
Channel Width : Adjusts the width of the channels, based on volatility (ATR multiplier).
Up and Down Colors : Allows customization of the colors used for uptrend and downtrend channels.
Future Bars : Sets the number of bars used for future price projection.
⯁ CONCLUSION
The Future Trend Channel indicator is a versatile tool for identifying and trading trends. With its ability to detect momentum shifts and project future prices, it provides traders with key insights for making more informed decisions. The use of diamond signals for trend validation adds an extra layer of confirmation, helping traders act with greater confidence during volatile or trending markets.

Adaptive Fibonacci Trend Ribbon[FibonacciFlux]Adaptive Fibonacci Trend Ribbon (FibonacciFlux)
Overview
The Adaptive Fibonacci Trend Ribbon is a versatile technical analysis tool designed for traders who want to leverage the power of multiple moving averages while integrating Fibonacci numbers. This indicator provides a dynamic visual representation of market trends, enhancing decision-making processes in trading.
Key Features
1. Multi-Moving Averages
- The indicator calculates eight different moving averages based on user-defined periods, including Fibonacci numbers such as 5, 8, 13, 21, 34, 55, 89, and 144.
- Traders can choose from various moving average types, including EMA, HMA, WMA, VWMA, ALMA, SMA, RMA, and TMA , allowing for tailored analysis based on market conditions.
2. Trend Detection
- Each moving average is color-coded based on its trend direction, with green indicating an upward trend and red indicating a downward trend.
- This visual clarity helps traders quickly assess market sentiment and make informed decisions.
3. Fill Areas for Enhanced Insight
- The indicator features fill areas between the moving averages, which dynamically change color according to their relative positions.
- This provides a clear visual cue of trend strength and potential reversal points, allowing traders to identify key areas of interest.
4. Customizable Inputs
- Users can easily adjust the source data, moving average lengths, and ALMA parameters (offset and sigma) to fit their trading strategies.
- This flexibility ensures that traders can adapt the tool to various market conditions and personal preferences.
Insights and Applications
1. Fibonacci Integration
- By incorporating Fibonacci numbers into the moving average periods, this indicator allows traders to align their strategies with key levels of support and resistance.
- This can enhance the accuracy of entry and exit points, particularly in trending markets.
2. Trend Continuation and Reversal Analysis
- The adaptive nature of the moving averages provides insights into potential trend continuations or reversals.
- Traders can use the indicator to identify when to enter or exit positions based on the interaction between the moving averages.
3. Visual Clarity for Quick Decisions
- The color-coded moving averages and fill areas offer immediate visual feedback on market conditions, helping traders react swiftly to changing dynamics.
- This is especially useful in fast-moving markets where timely decisions are critical.
Conclusion
The Adaptive Fibonacci Trend Ribbon is an essential tool for traders looking to enhance their technical analysis capabilities. By combining multiple moving averages with Fibonacci integration and dynamic visual cues, this indicator offers a robust framework for understanding market trends. Its flexibility and clarity make it an invaluable asset for both novice and experienced traders alike.
Open Source Contribution
This indicator is open source, inviting contributions and improvements from the trading community. Feel free to fork, enhance, and share your insights with the world, helping to foster a collaborative environment for traders everywhere.

Zero Lag Trend Signals (MTF) [AlgoAlpha]Zero Lag Trend Signals 🚀📈
Ready to take your trend-following strategy to the next level? Say hello to Zero Lag Trend Signals , a precision-engineered Pine Script™ indicator designed to eliminate lag and provide rapid trend insights across multiple timeframes. 💡 This tool blends zero-lag EMA (ZLEMA) logic with volatility bands, trend-shift markers, and dynamic alerts. The result? Timely signals with minimal noise for clearer decision-making, whether you're trading intraday or on longer horizons. 🔄
🟢 Zero-Lag Trend Detection : Uses a zero-lag EMA (ZLEMA) to smooth price data while minimizing delay.
⚡ Multi-Timeframe Signals : Displays trends across up to 5 timeframes (from 5 minutes to daily) on a sleek table.
📊 Volatility-Based Bands : Adaptive upper and lower bands, helping you identify trend reversals with reduced false signals.
🔔 Custom Alerts : Get notified of key trend changes instantly with built-in alert conditions.
🎨 Color-Coded Visualization : Bullish and bearish signals pop with clear color coding, ensuring easy chart reading.
⚙️ Fully Configurable : Modify EMA length, band multiplier, colors, and timeframe settings to suit your strategy.
How to Use 📚
⭐ Add the Indicator : Add the indicator to favorites by pressing the star icon. Set your preferred EMA length and band multiplier. Choose your desired timeframes for multi-frame trend monitoring.
💻 Watch the Table & Chart : The top-right table dynamically updates with bullish or bearish signals across multiple timeframes. Colored arrows on the chart indicate potential entry points when the price crosses the ZLEMA with confirmation from volatility bands.
🔔 Enable Alerts : Configure alerts for real-time notifications when trends shift—no need to monitor charts constantly.
How It Works 🧠
The script calculates the zero-lag EMA (ZLEMA) by compensating for data lag, giving traders more responsive moving averages. It checks for volatility shifts using the Average True Range (ATR), multiplied to create upper and lower deviation bands. If the price crosses above or below these bands, it marks the start of new trends. Additionally, the indicator aggregates trend data from up to five configurable timeframes and displays them in a neat summary table. This helps you confirm trends across different intervals—ideal for multi-timeframe analysis. The visual signals include upward and downward arrows on the chart, denoting potential entries or exits when trends align across timeframes. Traders can use these cues to make well-timed trades and avoid lag-related pitfalls.

Candlestick Reversal and Trend Signals [AlgoAlpha]🚀 Unleash your charting capabilities with the Candlestick Reversal and Trend Signals indicator by AlgoAlpha, your go-to tool for spotting pivotal market movements! This script enhances your trading experience by identifying key candlestick patterns and trend changes, perfect for traders aiming for precision in their technical analysis.
🛠 Key Features:
- 🔄 Multi-Timeframe Analysis : Leverages a timeframe multiplier to analyze levels on higher timeframes, enhancing the depth and applicability of insights.
- 🧩 Diverse Pattern Detection : Capable of detecting a wide array of patterns including Bull/Bear Engulfings, Dojis, Haramis, Piercing Lines, Dark Cloud Covers, and Morning/Evening Stars, each contributing to a robust trading strategy.
- 🔍 Dynamic Trend Filters : Utilizes three exponential moving averages (EMAs) and volume filters to decisively confirm trend directions and strength, providing a clearer picture of market dynamics.
- ⚙️ Customizable Settings : Features adjustable settings for filter period, signal thresholds, and appearance, allowing for a tailored analysis experience to fit individual trading styles.
- 📉 Swing Levels Identification : Marks significant high and low swing points on the chart, highlighting potential pivot points and trend reversals for strategic trading decisions.
📈 Quick Guide to Using the Candlestick Reversal and Trend Signals Indicator
1. 🛠 Add the Indicator : Add the indicator to your favorites. Adjust the settings to match your analysis needs.
2. 📊 Analysis : Keep an eye out for the specific symbols plotted on your chart that indicate various candlestick patterns. Use these signals to enhance your market analysis.
3. 🔔 Set Alerts : Enable alerts for the patterns you are most interested in to get notified of potential trading opportunities without needing to monitor the charts constantly.
Embark on your enhanced trading journey with this powerful tool! 🚀✨ Happy trading!
🧐 How It Works:
The Candlestick Reversal and Trend Signals indicator operates by integrating several candlestick patterns and trend analysis features to assist in making informed trading decisions. Initially, it gathers user-defined settings like the period for filtering, signal thresholds, and the desired patterns to detect. It analyzes candlestick formations such as Bull/Bear Engulfings, Dojis, Haramis, and more, by comparing the current candlestick's attributes (such as body length and direction) with previous data to identify potential market reversals or confirmations. The indicator enhances its accuracy through additional filters like volume ratios and exponential moving averages (EMAs) that help validate the strength and direction of trends. By marking these patterns and trends visually on the chart, it provides clear signals that aid traders in identifying significant market movements efficiently. The script is then complemented with the 3 EMA indicator for trend detection and swing levels for added confluence.

Cloud TrendCloud Trend Indicator ☁
The "Cloud Trend" indicator is a robust tool designed to identify and follow trends in financial markets. Leveraging Heikin Ashi principles, this indicator offers a clear visualization of trend strength and direction through the construction of a dual-line cloud.
How it works:
Principle of code is simple and efficient. Based on the loop, indicator calculates how many Heikin Ashi closes bars back are higher or lower of the current one and producing higherBars sum or lowerBars sum. In this way we have two lines from what clouds are constructed.
int higherBars = 0
int lowerBars = 0
// Heikin Ashi Close
series float h_close = math.avg(open,close,high,low)
// Calculation Lines
for i = 0 to lookbackInput - 1
if h_close < h_close
higherBars += 1
else if h_close > h_close
lowerBars += 1
Features:
Dual-Line Cloud Construction: The cloud is formed by two lines, where the upper line represents bullish momentum (aqua color) and the lower line reflects bearish momentum (red color).
Dynamic Bar Color: Traders can choose to color price bars based on trend strength. Aqua bars indicate a strong bullish trend, while red bars signify a robust bearish trend, providing valuable insights into market dynamics.
Customizable Lookback Period: Adapt the indicator to different market conditions by adjusting the lookback period. This flexibility accommodates various trading strategies and preferences.
Usage:
Cloud Color Signals: Changes in the cloud's color signal shifts in trend direction. Aqua signifies a bullish trend, while red indicates a bearish trend.
Bar Color Strength: If enabled, the color of price bars reflects the strength of the trend. Intense colors represent strong trends, offering a quick visual cue to the market's momentum.
Lookback Period Adjustment: Tailor the lookback period to match the timeframe and market conditions you are analyzing. Shorter periods capture immediate trends, while longer periods identify more sustained movements.
The "Cloud Trend" indicator, with its dual-line cloud construction, provides an intuitive way to interpret market trends. Whether you are a seasoned trader or a beginner, this tool enhances your technical analysis and supports more informed trading decisions.
