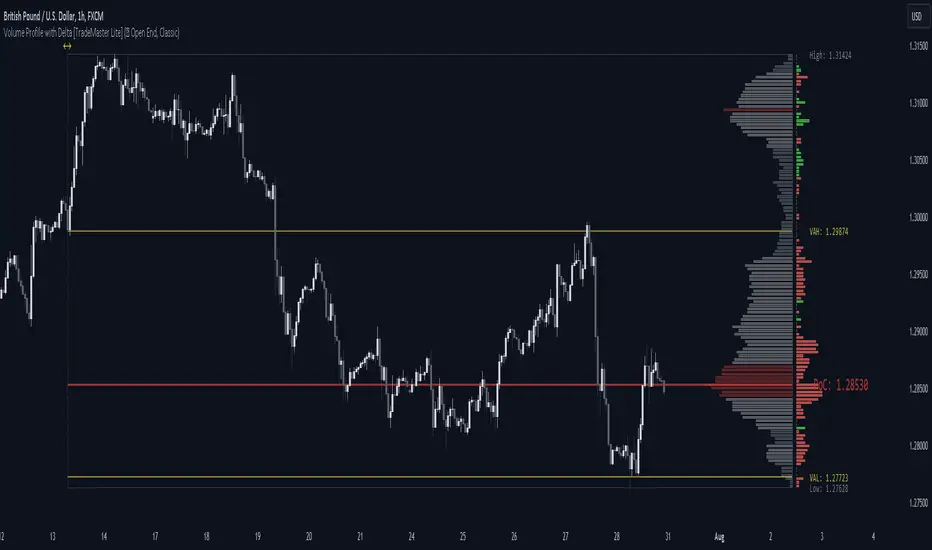
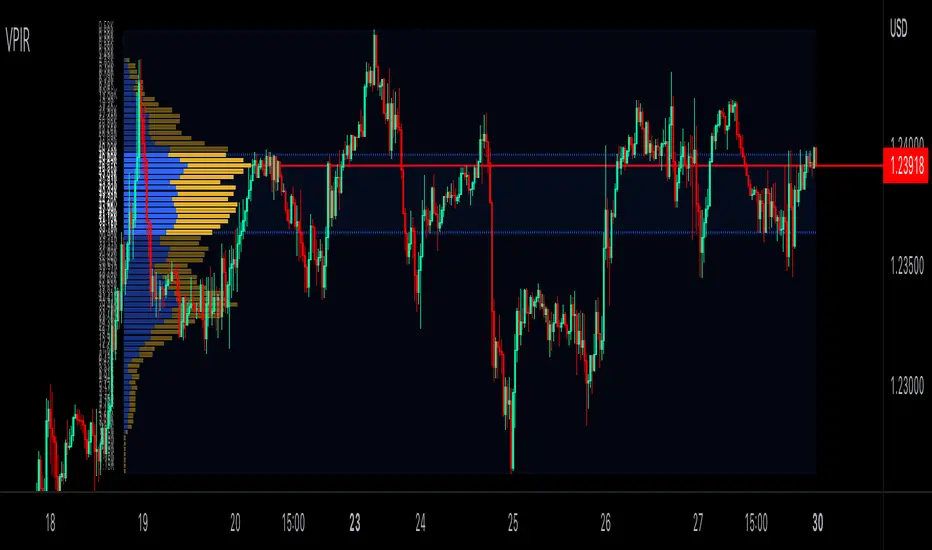
Volume Profile Interactive RangeVolume Profile Interactive Range (VPIR) is a brand new interactive VP enables you to analyze the market in depth.
Interactive mode lets you to set the duration(source) of VP intuitively.
PoC, VA(VAH&VAL) are fully supported.
在腳本中搜尋"volume profile"
Volume Profile with Node Detection [LuxAlgo]The Volume Profile with Node Detection is a charting tool that allows visualizing the distribution of traded volume across specific price levels and highlights significant volume nodes or clusters of volume nodes that traders may find relevant in utilizing in their trading strategies.
🔶 USAGE
The volume profile component of the script serves as the foundation for node detection while encompassing all the essential features expected from a volume profile. See the sub-sections below for more detailed information about the indicator components and their usage.
🔹 Peak Volume Node Detection
A volume peak node is identified when the volume profile nodes for the N preceding and N succeeding nodes are lower than that of the evaluated one.
Displaying peak volume nodes along with their surrounding N nodes (Zones or Clusters) helps visualize the range, typically representing consolidation zones in the market. This feature enables traders to identify areas where trading activity has intensified, potentially signaling periods of price consolidation or indecision among market participants.
🔹 Trough Volume Node Detection
A volume trough node is identified when the volume profile nodes for the N preceding and N succeeding nodes are higher than that of the evaluated one.
🔹 Highest and Lowest Volume Nodes
Both the highest and lowest volume areas play significant roles in trading. The highest volume areas typically represent zones of strong price acceptance, where a significant amount of trading activity has occurred. On the other hand, the lowest volume areas signify price levels with minimal trading activity, often indicating zones of price rejection or areas where market participants have shown less interest.
🔹 Volume profile
Volume profile is calculated based on the volume of trades that occur at various price levels within a specified timeframe. It divides the price range into discrete price intervals, typically known as "price buckets" or "price bars," and then calculates the total volume of trades that occur at each price level within those intervals. This information is then presented graphically as a histogram or profile, where the height of each bar represents the volume of trades that occurred at that particular price level.
🔶 SETTINGS
🔹 Volume Nodes
Volume Peaks: Toggles the visibility of either the "Peaks" or "Clusters" on the chart, depending on the specified percentage for detection.
Node Detection Percent %: Specifies the percentage for the Volume Peaks calculation.
Volume Troughs: Toggles the visibility of either the "Troughs" or "Clusters" on the chart, depending on the specified percentage for detection.
Node Detection Percent %: Specifies the percentage for the Volume Troughs calculation.
Volume Node Threshold %: A threshold value specified as a percentage is utilized to detect peak/trough volume nodes. If a value is set, the detection will disregard volume node values lower than the specified threshold.
Highest Volume Nodes: Toggles the visibility of the highest nodes for the specified count.
Lowest Volume Nodes: Toggles the visibility of the lowest nodes for the specified count.
🔹 Volume Profile - Components
Volume Profile: Toggles the visibility of the volume profile with either classical display or gradient display.
Value Area Up / Down: Color customization option for the volume nodes within the value area of the profile.
Profile Up / Down Volume: Color customization option for the volume nodes outside of the value area of the profile.
Point of Control: Toggles the visibility of the point of control, allowing selection between "developing" or "regular" modes. Sets the color and width of the point of control line accordingly.
Value Area High (VAH): Toggles the visibility of the value area high level and allows customization of the line color.
Value Area Low (VAL): Toggles the visibility of the value area low level and allows customization of the line color.
Profile Price Labels: Toggles the visibility of the Profile Price Levels and allows customization of the text size of the levels.
🔹 Volume Profile - Display Settings
Profile Lookback Length: Specifies the length of the profile lookback period.
Value Area (%): Specifies the percentage for calculating the value area.
Profile Placement: Specify where to display the profile.
Profile Number of Rows: Specify the number of rows the profile will have.
Profile Width %: Adjusts the width of the rows in the profile relative to the profile range.
Profile Horizontal Offset: Adjusts the horizontal offset of the profile when it is selected to be displayed on the right side of the chart.
Value Area Background: Toggles the visibility of the value area background and allows customization of the fill color.
Profile Background: Toggles the visibility of the profile background and allows customization of the fill color.
🔶 RELATED SCRIPTS
Supply-Demand-Profiles
Liquidity-Sentiment-Profile
Thanks to our community for recommending this script. For more conceptual scripts and related content, we welcome you to explore by visiting >>> LuxAlgo-Scripts .

Volume Profile Two-Tone - Hit Counter - Meter V1 Volume Profile Two-Tone - Hit Counter - Meter V1
Overview
The Volume Profile Two-Tone - Hit Counter - Meter V1 is a Pine Script v6 indicator for TradingView, designed to visualize buy and sell activity distribution across price levels within a user-defined window or intraday session. It plots a dual-color horizontal histogram showing buying (green) and selling (red) volume intensity, along with optional hit-count numbers and meter overlays. The profile dynamically updates as new bars form, providing an intuitive picture of where market participants are most active.
The enhanced V1 edition introduces persistent hit counts, real-time adaptive row rebuilding, and improved memory management for smoother performance in both rolling-window and session modes.
How It Works
The indicator divides the selected range into rows (price bins) and aggregates trade volume (or tick volume) per bar.
Each bin separately sums up bullish and bearish contributions based on candle direction and delta logic, then draws side-by-side histogram bars:
• Buy Volume (green): Total volume from bullish bars within the bin.
• Sell Volume (red): Total volume from bearish bars within the bin.
A rolling or session-based window determines how many recent bars are analyzed. Value Area (VA), Point of Control (POC), and total hits per bin are computed continuously. The display auto-adjusts as price moves, keeping the profile anchored to the latest visible bars.
Behind the scenes, optimized arrays manage active boxes, lines, and labels for each bin. Functions like ensure_rows() rebuild buffers only when necessary, guaranteeing efficiency without repainting past data. Persistent hit-tracking ensures each price level maintains its count even when temporarily hidden.
Key Features
• Dual-Tone Volume Histogram: Buy/sell split with distinct colors for immediate visual contrast.
• Rolling or Session Profiles: Choose between continuous rolling windows or intraday session resets.
• Persistent Hit Counts: Displays total touches per bin, remaining stored even when bins refresh.
• Adaptive Row Management: Automatic rebuilding when zooming, scrolling, or changing resolution.
• Value Area + POC Detection: Highlights the most active price levels and volume concentration zones.
• Meter Overlay Option: Adds gradient bars or directional meters for quick trend context.
• Performance Optimized: Uses lightweight arrays and cached line handles for minimal CPU load.
• Custom Color Control: Editable buy/sell colors, opacity, row count, and profile width.
• Full Persistence Mode: Profiles remain visually consistent across bar updates without redraw gaps.
What It Displays
The Volume Profile Two-Tone - Hit Counter - Meter V1 presents an adaptive horizontal histogram beside the chart’s candles, revealing how volume is distributed across price.
• Green segments show dominant buying interest; red segments reveal selling pressure.
• POC line identifies the highest-volume price.
• Hit-count numbers quantify how often price traded at each level.
• Optional meters display relative directional strength within the same range.
This visual layering helps traders quickly identify supply/demand zones, balance areas, and developing auction profiles across intraday or multi-session contexts.
Originality
The Pine Script v6 indicator uses efficient array management (array.new_*, array.set, array.get) and native math operations for rendering.
It avoids external dependencies, relying only on built-in TradingView functions like request.security, box.new, line.new, and label.new for dynamic plotting.
Common Ways People Use It
• Scalpers: Study short-term imbalances or high-activity levels to time entries/exits.
• Day Traders: Track evolving session volume and POC migration.
• Swing Analysts: Compare rolling distributions to identify value shifts over multiple days.
• Volume Profilers: Combine with VWAP or order-flow tools for deeper context.
Configuration Notes
Profile Mode: Select Rolling Window (bars) or Session (intraday).
Rows and Width: Default = 72 rows, 44 bars width.
Colors and Opacity: Adjust to match chart theme.
Performance Mode: Choose Accurate or Fast (approximate) for speed control.
Show Hits / Meter: Enable hit-count numbers and gradient meters for added context.
Legal Disclaimer
For informational and educational purposes only—not investment, financial, or trading advice. Past performance does not guarantee future results; trading involves significant risk. Provided “as is,” without warranties. Consult a qualified professional before making decisions. By using, you accept all risks and agree to this disclaimer.

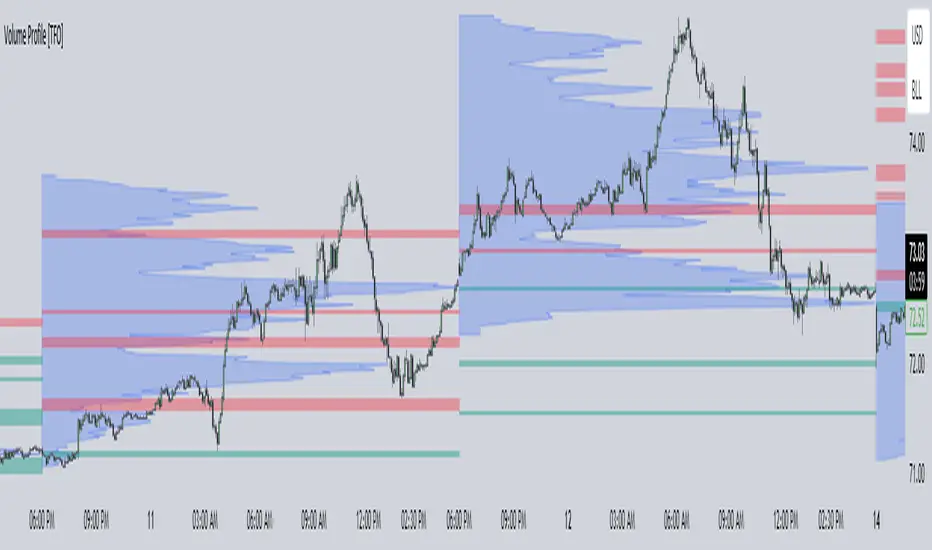
Volume Profile [TFO]This indicator generates Volume Profiles from which to display insights about recent Volume Points of Control and High Volume Nodes. Volume Profile is a way to view trading volume by the price where trades have occurred, rather than the time when they occur (as seen by traditional Volume indicators).
By selecting a Resolution Timeframe (1m in this example), we can aggregate the volume at different prices to build a Volume Profile for a specified Profile Timeframe (1D in this example). In this indicator, we make the simple assumption that a given candle's volume is distributed evenly across all points. Realistically, this is seldom the case, but it gives us a starting point to easily estimate the volume at a given price, in turn helping us to build our profiles in a trivial way.
If we do this for all Resolution Timeframe candles within a Profile Timeframe (all 1m candles in a single 1D candle, in this example), then we can successfully aggregate this data and build a full Volume Profile. And thankfully, Pine Script's new polyline feature ultimately allow us to keep more Volume Profiles on our charts. Before polylines, we would have to consider using lines or boxes to represent the individual levels within a given profile, and each script currently has a cap of 500 lines and boxes, respectively. However, one single polyline can be used to draw the complex shape of an entire profile, and we may show up to 100 polylines in a given script. This helps us keep a lot more data on our charts!
Compared to TradingView's Session Volume Profile indicator (blue/yellow), we can see that our indicator (grey) is nearly identical, which verifies that our assumption of a uniform volume distribution is enough to roughly estimate a given Volume Profile. Note in this example the Row Size was set to 200, meaning that 200 levels are used to approximate profiles from each session's high to its low.
Show VPOC will show the volume point of control of each profile, which represents the price level where the largest amount of volume was traded for a given profile. This is shown with the red lines in the following chart.
Extend Last N VPOCs will look for the most recent, user-defined number of VPOCs (not including the current session's VPOC that's still developing) and extend them to the right of the chart as points of reference. The Show Labels Above option will annotate each VPOC with its respective date above a specified timeframe. This way, if one was using Volume Profiles on intraday timeframes, there wouldn't need to be several date strings all showing the same day.
Show Previous HVNs will show high volume nodes from the previous session. The HVN Strength setting is similar to a "pivot strength" that I use in a lot of my scripts - essentially, HVNs are validated by treating them as local highs. With a HVN Strength of 10 for example, if a given level contains more volume than the 10 levels above and below it, then it is validated as a HVN.
For a cleaner look and feel, HVNs can instead be shown as levels (lines) instead of areas (boxes). With levels enabled, solid lines denote the previous session's VPOC, and dotted lines represent all other HVNs. With areas enabled instead, the tops and bottoms will extend above/below the HVN level until a point with greater volume is discovered (marking the "end" of the node).
This indicator can be computationally intensive and may crash from taking too long to execute. In these cases, it's best to disable unused features, decrease the number of Rows, and/or simply reload the chart until it populates.
Volume Profile [LuxAlgo]Displays the estimate of a volume profile, with the option to show a rolling POC (point of control). Users can change the lookback, row size, and various visual aspects of the volume profile.
Settings
Basic:
Lookback: Number of most recent bars to use for the calculation of the volume profile
Row Size: Determines the number of rows used for the calculation of the volume profile
Show Rolling POC: Determines whether to display the rolling POC of the volume profile
Style:
Width (% of the box): Determines the length of the bars relative to the Lookback value
Bar Width: Width of each bar
Flip Histogram: Flips the histogram, when enabled, the histogram base will be located at the most recent candle
Gradient: Allows to color the volume profile bars with a gradient, with a color intensity determined by the length of each bar
Rows Solid Color: Color of each bar when 'Gradient' is disabled
POC Solid Color: Color of the POC when 'Gradient' is disabled
Usage
It is very common to display volume over time in order to visualize the trading activity made over a specific candle, however this is not the only way to display volume and it can be interesting to put it in relation with the price, which is what volume profiles do.
Volume profiles are displayed as price relative histograms showing the accumulated volume within certain price areas, the number of areas are determined by the row size of the volume profile. Knowing which price's area accumulated the most volume allow highlighting areas of interest to market participants.
Most accumulated volume will be encountered in zones of equilibrium between buyers and sellers; that is zones of local price stationarity. These zones are highlighted by high volume nodes in the volume profile. Imbalance between buyers and sellers are highlighted by thinner zones of the volume profile.
The price level with the most accumulated volume is highlighted by the "point of control" (POC), displayed by the dotted line in the indicator.
The POC is often considered an important level, commonly used as support/resistance by traders. One can verify the accuracy of this use case by using the rolling POC (assuming one would use the POC over time as SR).
Indicator Limitations
Volume profiles are calculated using tick data, which is not the case of this estimate, as such you won't have an accurate representation of an actual volume profile.
The rolling POC can introduce time outs in the script computation, use lower lookback and row size value to display it.

Volume Profile Area [BigBeluga]🔵 OVERVIEW
The Volume Profile Area is an advanced profiling tool that calculates and visualizes the value area within a chosen period’s volume distribution. It first builds a main profile of the entire range, then constructs a secondary profile inside the defined value area, allowing traders to examine market balance and key trading zones in greater detail.
🔵 CONCEPTS
Volume Profile – Distributes traded volume across price levels to highlight areas of market activity.
Value Area (VA) – The price range containing a chosen percentage of total volume (commonly 50–70%).
Point of Control (PoC) – The price level with the highest traded volume, often acting as a magnet for price.
Nested Profiles – A profile inside the VA adds a second layer of precision, showing where liquidity clusters within the “fair value” zone.
🔵 FEATURES
Main Profile – Full distribution of volume over the selected lookback period.
Secondary Profile – Built only inside the VA of the main profile, highlighting intrabalance structure.
Customizable PoC Selection – Choose between showing the PoC of the
Main Profile ,
the Area Profile ,
their Average ,
or None .
Dynamic Value Area Levels – Automatically plots VAL (Value Area Low) and VAH (Value Area High) with labels.
Overlay Toggles – Show/hide range extremes, VA lines, or PoCs for a cleaner chart view.
Visual Profiles – Main profile shaded in darker blue; the VA profile inside is lighter for clear separation.
Automatic Scaling – Profiles adapt to period highs/lows and auto-adjust bins for consistent resolution.
Volume Labels – PoCs can display traded volume, giving numeric confirmation of liquidity concentration.
🔵 HOW TO USE
Set the Period to define how many bars to include in the main profile.
Adjust the Value Area % to control how much volume defines the VA (e.g., 50% by default).
Pick your PoC option: Main , Area , or Average , depending on focus.
Use VAH/VAL lines as support/resistance levels where most trading occurred.
Compare reactions at Main vs VA PoC levels to spot potential breakouts or mean reversions.
🔵 CONCLUSION
The Volume Profile Area extends traditional profiling by nesting a secondary VA profile inside the main distribution. This dual-layer approach reveals not just where the market was active overall, but where liquidity concentrated within the “fair value” zone—powerful for refining entries, exits, and risk placement across intraday and swing horizons.

Volume Profile Regression Channel [LuxAlgo]The Volume Profile Regression Channel calculates a volume profile from an anchored linear regression channel. Users can choose the starting and ending points for the indicator calculation interval.
Like a regular volume profile, a "line" of control (LOC), value area, and a developing LOC are displayed.
🔶 SETTINGS
Sections: The number of sections the linear regression channel is divided into for the calculation of the volume profile.
Width %: Determines the length of the profile within the channel relative to the channel length.
Value Area %: Highlights the sections starting from the POC whose accumulated volume is equal to the user-defined percentage of the total profile sections volume.
🔶 USAGES
Regular volume profiles are often constructed from a horizontal price area, this can allow highlighting price areas where most trading activity takes place.
However, when price is strongly trending a classical volume profile can sometimes be more uniform. This is where using an angled volume profile can be useful.
The line of control allows highlighting the section of the channel with the most accumulated volume, this line can be used as a potential future support/resistance. This is where an angled volume profile might be the most useful.
The developing LOC highlights the LOC location at a specific time within the profile (from left to right) and can sometimes provide an estimate of the underlying trend in the price.
🔶 DETAILS
To be computed the script requires a left and right chart time coordinates. When adding the script to their charts users can determine the left and right time coordinates by clicking on the chart.
The linear regression channel width is determined so that the channel precisely encompasses the whole price.
🔶 LIMITATIONS
Using a very large calculation interval can return timeouts. Users can reduce the calculation interval to fix that issue from occurring.
The amount of drawing objects that can be used is limited, as such using a high calculation interval can display an incomplete profile.
🔶 ACKNOWLEDGEMENTS
If you are interested in these types of scripts, @HeWhoMustNotBeNamed published a similar script where users can use a custom line angle. See his 'Angled Volume Profile' script from March 2023.

Volume Profile PremiumHello, my friends, this is a new fine-grained volume profile indicator. As is known to all, the volume profile indicator is a charting tool that shows how much volume has occurred at each price throughout the trading session. The volume profile indicates the prices favored by the market or those ignored by the market, which can give traders clues as to where prices are likely to go shortly.
(1) Indicator description
This indicator is based on the function "request.security_lower_tf". See the related usage note for details if you need it.
Support for obtaining volume from a lower timeframe than the current chart and calculating a more fine-grained volume distribution
Due to the increased complexity of the calculation, you need to set a reasonable timeframe to avoid calculation timeout.
(2) Key parameters
- Support/Resistance Clustering
Max of Lookback Forward: The maximum number of historical K-lines
Min Resolution (Minute): lower timeframe, unit: minute
Display Volume Profile: ways to display volume profile
Rows of Volume Profile: rows of volume profile
Placement of Volume Profile: location of volume profile
Width of Volume Profile: width of volume profile
Horizontal Offset: horizontal offset of volume profile
Happy trading, and enjoy your life!
————————————————————————————————————————
各位朋友大家好,这是一个具有更高细粒度的成交量分布指标。众所周知,成交量分布是一种图表分析工具(或指标),它显示了在整个交易时段内每个价格上发生了多少成交量。 成交量分布指出了受到市场青睐的价格以及被市场忽略的价格,这可以为交易者提供有关近期价格可能走向何方的线索。
(1) 指标说明
该指标基于 request.security_lower_tf 函数,详情可以查看相关使用说明
支持从比当前图表分辨率更低的时间周期获取成交量,并计算更加细粒度的成交量分布
由于增加了计算复杂度,您需要设置合理的时间周期以避免计算超时
(2) 关键参数
- Volume Profile Parameters
Max of Lookback Forward: 用于统计成交量分布的最大回顾的K线数量
Min Resolution (Minute): 细粒度的时间周期
Display Volume Profile: 展示成交量分布的方式
Rows of Volume Profile: 成交量分布的行数
Placement of Volume Profile: 成交量分布的位置
Width of Volume Profile: 成交量分布的宽度
Horizontal Offset: 成交量分布的水平偏移
祝大家交易愉快

Volume Profile Grid [Alpha Extract]A sophisticated volume distribution analysis system that transforms market activity into institutional-grade visual profiles, revealing hidden support/resistance zones and market participant behavior. Utilizing advanced price level segmentation, bullish/bearish volume separation, and dynamic range analysis, the Volume Profile Grid delivers comprehensive market structure insights with Point of Control (POC) identification, Value Area boundaries, and volume delta analysis. The system features intelligent visualization modes, real-time sentiment analysis, and flexible range selection to provide traders with clear, actionable volume-based market context.
🔶 Dynamic Range Analysis Engine
Implements dual-mode range selection with visible chart analysis and fixed period lookback, automatically adjusting to current market view or analyzing specified historical periods. The system intelligently calculates optimal bar counts while maintaining performance through configurable maximum limits, ensuring responsive profile generation across all timeframes with institutional-grade precision.
// Dynamic period calculation with intelligent caching
get_analysis_period() =>
if i_use_visible_range
chart_start_time = chart.left_visible_bar_time
current_time = last_bar_time
time_span = current_time - chart_start_time
tf_seconds = timeframe.in_seconds()
estimated_bars = time_span / (tf_seconds * 1000)
range_bars = math.floor(estimated_bars)
final_bars = math.min(range_bars, i_max_visible_bars)
math.max(final_bars, 50) // Minimum threshold
else
math.max(i_periods, 50)
🔶 Advanced Bull/Bear Volume Separation
Employs sophisticated candle classification algorithms to separate bullish and bearish volume at each price level, with weighted distribution based on bar intersection ratios. The system analyzes open/close relationships to determine volume direction, applying proportional allocation for doji patterns and ensuring accurate representation of buying versus selling pressure across the entire price spectrum.
🔶 Multi-Mode Volume Visualization
Features three distinct display modes for bull/bear volume representation: Split mode creates mirrored profiles from a central axis, Side by Side mode displays sequential bull/bear segments, and Stacked mode separates volumes vertically. Each mode offers unique insights into market participant behavior with customizable width, thickness, and color parameters for optimal visual clarity.
// Bull/Bear volume calculation with weighted distribution
for bar_offset = 0 to actual_periods - 1
bar_high = high
bar_low = low
bar_volume = volume
// Calculate intersection weight
weight = math.min(bar_high, next_level) - math.max(bar_low, current_level)
weight := weight / (bar_high - bar_low)
weighted_volume = bar_volume * weight
// Classify volume direction
if bar_close > bar_open
level_bull_volume += weighted_volume
else if bar_close < bar_open
level_bear_volume += weighted_volume
else // Doji handling
level_bull_volume += weighted_volume * 0.5
level_bear_volume += weighted_volume * 0.5
🔶 Point of Control & Value Area Detection
Implements institutional-standard POC identification by locating the price level with maximum volume accumulation, providing critical support/resistance zones. The Value Area calculation uses sophisticated sorting algorithms to identify the price range containing 70% of trading volume, revealing the market's accepted value zone where institutional participants concentrate their activity.
🔶 Volume Delta Analysis System
Incorporates real-time volume delta calculation with configurable dominance thresholds to identify significant bull/bear imbalances. The system visually highlights price levels where buying or selling pressure exceeds threshold percentages, providing immediate insight into directional volume flow and potential reversal zones through color-coded delta indicators.
// Value Area calculation using 70% volume accumulation
total_volume_sum = array.sum(total_volumes)
target_volume = total_volume_sum * 0.70
// Sort volumes to find highest activity zones
for i = 0 to array.size(sorted_volumes) - 2
for j = i + 1 to array.size(sorted_volumes) - 1
if array.get(sorted_volumes, j) > array.get(sorted_volumes, i)
// Swap and track indices for value area boundaries
// Accumulate until 70% threshold reached
for i = 0 to array.size(sorted_indices) - 1
accumulated_volume += vol
array.push(va_levels, array.get(volume_levels, idx))
if accumulated_volume >= target_volume
break
❓How It Works
🔶 Weighted Volume Distribution
Implements proportional volume allocation based on the percentage of each bar that intersects with price levels. When a bar spans multiple levels, volume is distributed proportionally based on the intersection ratio, ensuring precise representation of trading activity across the entire price spectrum without double-counting or volume loss.
🔶 Real-Time Profile Generation
Profiles regenerate on each bar close when in visible range mode, automatically adapting to chart zoom and scroll actions. The system maintains optimal performance through intelligent caching mechanisms and selective line updates, ensuring smooth operation even with maximum resolution settings and extended analysis periods.
🔶 Market Sentiment Analysis
Features comprehensive volume analysis table displaying total volume metrics, bullish/bearish percentages, and overall market sentiment classification. The system calculates volume dominance ratios in real-time, providing immediate insight into whether buyers or sellers control the current price structure with percentage-based sentiment thresholds.
🔶 Visual Profile Mapping
Provides multi-layered visual feedback through colored volume bars, POC line highlighting, Value Area boundaries, and optional delta indicators. The system supports profile mirroring for alternative perspectives, line extension for future reference, and customizable label positioning with detailed price information at critical levels.
Why Choose Volume Profile Grid
The Volume Profile Grid represents the evolution of volume analysis tools, combining traditional volume profile concepts with modern visualization techniques and intelligent analysis algorithms. By integrating dynamic range selection, sophisticated bull/bear separation, and multi-mode visualization with POC/Value Area detection, it provides traders with institutional-quality market structure analysis that adapts to any trading style. The comprehensive delta analysis and sentiment monitoring system eliminates guesswork while the flexible visualization options ensure optimal clarity across all market conditions, making it an essential tool for traders seeking to understand true market dynamics through volume-based price discovery.

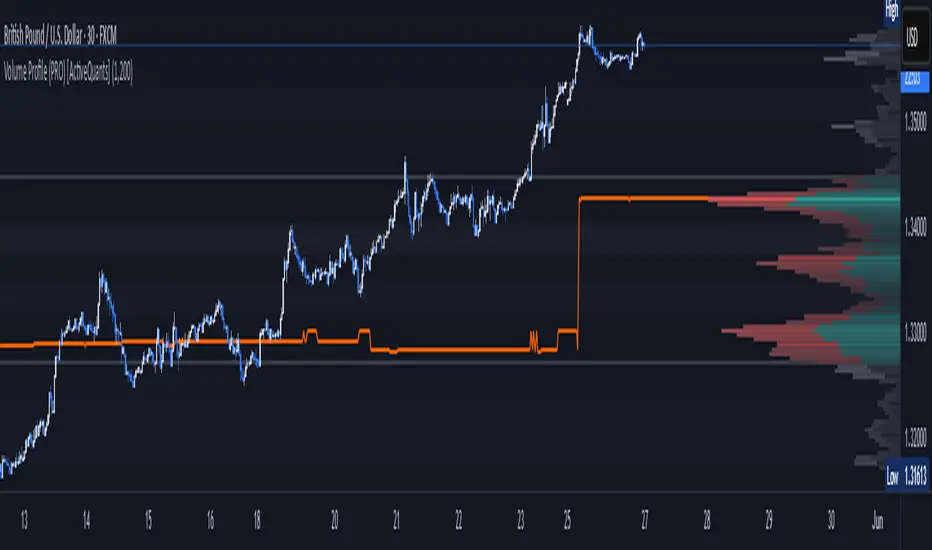
Volume Profile (PRO) [ActiveQuants]The Volume Profile (PRO) indicator is an advanced analytical tool designed to provide traders with a deep understanding of market dynamics by displaying trading activity across different price levels over a specified period. By meticulously plotting volume distribution , this indicator helps identify significant price zones, such as areas of high acceptance ( High Volume Nodes - HVNs ), rejection ( Low Volume Nodes - LVNs ), Volume Peaks Clusters , Volume Troughs Clusters , the Point of Control (POC) , and the Value Area (VA) . This insight is crucial for spotting potential support/resistance levels, assessing market sentiment, and making more informed trading decisions.
This indicator operates on the principle that price levels with higher traded volume hold greater significance, often acting as pivotal points for future price movements. Conversely, areas with low volume typically indicate less agreement on price, leading to quicker price transitions. The Volume Profile (PRO) offers extensive customization to tailor the analysis to your specific needs and trading style.
█ KEY FEATURES
Comprehensive Volume Analysis: Visualize volume distribution horizontally, revealing key price levels based on actual traded volume.
Dynamic Profile Calculation: Uses a rolling lookback period to keep the profile relevant to recent price action.
Point of Control (POC): Automatically identifies and plots the price level with the highest traded volume within the profile period. Available as a "Regular" (fixed for the current profile) or "Developing" line that tracks its evolution bar-by-bar.
Value Area (VA): Highlights the price range where a specified percentage (typically 70%) of the total volume was traded. Also available as "Regular" or "Developing" VAH (Value Area High) and VAL (Value Area Low) lines.
High and Low Volume Nodes (HVNs & LVNs): Option to automatically detect and highlight a specified number of the highest volume concentration zones (HVNs) and lowest volume zones (LVNs) within the profile. These are crucial for identifying support/resistance and areas of potential quick price movement.
Volume Peaks and Troughs Detection: Identify statistically significant high-volume (Peaks) and low-volume (Troughs) rows relative to their neighbors, either as single rows or clusters. These can pinpoint precise levels of interest.
Multiple Volume Display Types: Choose to display volume as:
- Up/Down: Shows buying and selling volume side-by-side for each row.
- Total: Shows the aggregate volume for each row.
- Delta: Shows the difference between buying and selling volume for each row, highlighting imbalances.
Extensive Customization: Fine-tune lookback period, number of rows, profile width, horizontal placement, Value Area percentage, colors for all elements, and specific parameters for node/peak/trough detection.
Visual Enhancements:
- Optional gradient colors for volume bars.
- Display volume figures directly on rows.
- Background shading for the Value Area and the entire Profile range.
- Price labels for POC, VAH, VAL, Profile High, and Profile Low.
Integrated Alert System: Pre-built alert conditions for critical volume profile events. (See section on "█ SETTING UP ALERTS " for more details).
█ USER INPUTS
The settings panel is organized into distinct sections:
- Calculation Settings:
Lookback: Number of most recent bars for profile calculation.
Number of Rows: Resolution of the volume profile.
Profile Width: Relative horizontal length of the volume bars.
Horizontal Offset: Horizontal positioning of the profile.
Value Area (%): Percentage of volume to include in the Value Area.
Volume: Display type ("Up/Down", "Total", "Delta").
Profile Placement: "Right" or "Left" side of the chart.
- Appearance:
Volume Profile On/Off: Toggle visibility of the entire profile.
Rows Border Width & Color: Customize the outline of volume rows.
Gradient Colors: Enable/disable gradient coloring for volume bars.
Row Volume: Display numerical volume on each row.
VAH (Value Area High): Display type ("None", "Regular", "Developing"), Color, Price Label, Line Width.
VAL (Value Area Low): Display type ("None", "Regular", "Developing"), Color, Price Label, Line Width.
Profile High Price Label & Color: Toggle and customize.
Profile Low Price Label & Color: Toggle and customize.
Value Area Up/Down Color: Colors for up/down volume within VA.
Profile Up/Down Color: Colors for up/down volume outside VA.
Total Volume Color: For "Total" volume display type.
Delta Volume Positive/Negative Color: For "Delta" volume display type.
POC (Point of Control): Display type ("None", "Regular", "Developing"), Color, Line Width, Price Label.
Value Area Background & Color: Enable and customize VA background shading.
Profile Background & Color: Enable and customize profile range background shading.
Volume Nodes:
Highest Volume Nodes & Color: Number of HVNs to highlight and their color.
Lowest Volume Nodes & Color: Number of LVNs to highlight and their color.
Volume Peaks: Detection type ("None", "Single Row", "Cluster"), Color.
Compared Neighbors (Peaks): Number of neighboring rows to compare against for peak detection.
Minimum Peak Ratio (Peaks): Volume ratio required for a row to be considered a peak.
Volume Troughs: Detection type ("None", "Single Row", "Cluster"), Color.
Compared Neighbors (Troughs): Number of neighboring rows to compare against for trough detection.
Minimum Trough Ratio (Troughs): Volume ratio required for a row to be considered a trough.
█ SETTING UP ALERTS
The Volume Profile (PRO) indicator comes with a comprehensive set of pre-configured alert conditions to notify you of key market events related to volume structure. To set up an alert:
Click the " Alert " button (clock icon) on TradingView's right-hand toolbar or top panel.
In the " Condition " dropdown, select " Volume Profile (PRO) ".
A second dropdown will appear, allowing you to choose from the following specific alert conditions built into the script:
- POC Price Change: Triggers when the Point of Control price level changes.
- POC Crossover: Triggers when the closing price crosses over the POC line and is now above it.
- POC Crossunder: Triggers when the closing price crosses under the POC line and is now below it.
- Close Inside Value Area: Triggers when the closing price enters the Value Area.
- Close Outside Value Area: Triggers when the closing price exits the Value Area.
- Close Inside High Volume Node: Triggers when the closing price enters a detected High Volume Node.
- Close Inside Low Volume Node: Triggers when the closing price enters a detected Low Volume Node.
- Close Inside Volume Peak: Triggers when the closing price enters a detected Volume Peak row.
- Close Inside Volume Peak Cluster: Triggers when the closing price enters the area of a Volume Peak cluster.
- Close Inside Volume Trough: Triggers when the closing price enters a detected Volume Trough row.
- Close Inside Volume Trough Cluster: Triggers when the closing price enters the area of a Volume Trough cluster.
Choose your preferred " Trigger " option:
- " Only Once ": The alert triggers the first time the condition is met.
- " Once Per Bar Close ": ( Recommended for most profile signals ) The alert triggers only after the current bar closes if the condition was true on that closed bar. This ensures signals are based on confirmed price action.
Customize the alert name, message, and notification preferences.
Click " Create ".
█ STRATEGY EXAMPLES
The following examples are for illustrative purposes only to demonstrate how the Volume Profile (PRO) can be used. They are not financial advice. Always conduct thorough backtesting and research.
1. POC as Dynamic Support/Resistance
Goal: Identify potential bounces or rejections from the Point of Control.
Setup: Enable "POC Line" (Regular or Developing) and observe price interaction.
Entry (Long):
- Price approaches the POC from above and shows signs of holding (e.g., bullish candlestick patterns, deceleration).
- Enter on confirmation of support at the POC.
Entry (Short):
- Price approaches the POC from below and shows signs of rejection (e.g., bearish candlestick patterns).
- Enter on confirmation of resistance at the POC.
Management: Stop-loss beyond the recent swing pivot or the POC itself after a confirmed break. Target the next significant volume node (HVN/LVN) or Value Area boundary.
2. Trading Low Volume Nodes (LVNs) as "Vacuum Zones"
Goal: Capitalize on rapid price movement through LVNs and their potential to become support/resistance once traversed.
Setup: Enable "Lowest Volume Nodes" to identify LVNs.
Entry (Long):
- Price breaks decisively above an LVN.
- Look for a retest of the top of the LVN as support. Enter long on confirmation.
Entry (Short):
- Price breaks decisively below an LVN.
- Look for a retest of the bottom of the LVN as resistance. Enter short on confirmation.
Concept: Price is expected to move quickly through LVNs (volume vacuum). Once price has passed through an LVN, that area of prior low acceptance can act as a new support/resistance zone.
Management: Stop-loss beyond the retested LVN. Target the next HVN or significant price level.
█ CONCLUSION
The Volume Profile (PRO) indicator offers a sophisticated and highly customizable approach to volume analysis. By providing clear visualizations of POC, Value Area, HVNs, LVNs, and Volume Peaks/Troughs, along with integrated alerts and developing levels, this tool empowers traders to identify critical price zones, understand market structure, and develop more nuanced trading strategies. Whether you're looking for precise entry points, areas of support and resistance, or confirmation of market sentiment, this Volume Profile indicator is an invaluable addition to your technical analysis toolkit.
█ IMPORTANT NOTES
⚠ Lookback vs. Calculated Bars Relationship: The value set in the " Lookback " input ( Calculation Settings ) must be less than half of the number of bars the indicator is set to calculate on your chart (referred to as " Calculated bars " in the script, typically controlled by TradingView's historical data loading or a calc_bars_count setting within the script's indicator() declaration – in this script, it is 1200 bars by default). For example, if "Calculated bars" is 1200, your Lookback should be less than 600. The default Lookback of 500 respects this. Setting a Lookback too high relative to available calculated bars can lead to errors or incorrect profile rendering.
⚠ Parameter Optimization: The default settings are starting points. Always adjust indicator parameters (Lookback, Number of Rows, VA%, etc.) based on the specific asset, its volatility, and the timeframe you are trading. Thorough backtesting is crucial.
⚠ Context is Key: Volume Profile is powerful, but its signals are best interpreted within the broader market context (trend, news, other technical indicators).
⚠ Lookback vs. Profile Stability: A shorter lookback makes the profile very responsive to recent action but less stable. A longer lookback provides more stable levels but may lag in fast-moving markets.
⚠ Number of Rows: Higher row counts offer more granularity but can impact performance and may show too much noise. Lower row counts offer a broader view but may obscure finer details.
⚠ Alert Confirmation: Using " Once Per Bar Close " for alerts is generally recommended to ensure signals are based on confirmed price action.
█ RISK DISCLAIMER
Trading involves a substantial risk of loss and is not suitable for all investors. The Volume Profile (PRO) indicator is provided for educational and informational purposes only . It does NOT constitute financial advice or a recommendation to buy or sell any asset. Indicator signals identify potential patterns based on historical data but do not guarantee future price movements or profitability. Always conduct your own thorough research, utilize multiple sources of information, and implement robust risk management practices before making any trading decisions. Past performance is not indicative of future results.
📊 Happy trading! 🚀
Volume Profile 3D (Zeiierman)█ Overview
Volume Profile 3D (Zeiierman) is a next-generation volume profile that renders market participation as a 3D-style profile directly on your chart. Instead of flat histograms, you get a depth-aware profile with parallax, gradient transparency, and bull/bear separation, so you can see where liquidity stacked up and how it shifted during the move.
Highlights:
3D visual effect with perspective and depth shading for clarity.
Bull/Bear separation to see whether up bars or down bars created the volume.
Flexible colors and gradients that highlight where the most significant trading activity took place.
This is a state-of-the-art volume profile — visually powerful, highly flexible, and unlike anything else available.
█ How It Works
⚪ Profile Construction
The price range (from highest to lowest) is divided into a number of levels (buckets). Each bar’s volume is added to the correct level, based on its average price. This builds a map of where trading volume was concentrated.
You can choose to:
Aggregate all volume at each level, or
Split bullish vs. bearish volume , slightly offset for clarity.
This creates a clear view of which price zones matter most to the market.
⚪ 3D Effect Creation
The unique part of this indicator is how the 3D projection is built. Each volume block’s width is scaled to its relative size, then tilted with a slope factor to create a depth effect.
maxVol = bins.bu.max() + bins.be.max()
width = math.max(1, math.floor(bucketVol / maxVol * ((bar_index - start) * mult)))
slope = -(step * dev) / ((bar_index - start) * (mult/2))
factor = math.pow(math.min(1.0, math.abs(slope) / step), .5)
width → determines how far the volume extends, based on relative strength.
slope → creates the angled projection for the 3D look.
factor → adjusts perspective to make deeper areas shrink naturally.
The result is a 3D-style volume profile where large areas pop forward and smaller areas fade back, giving you immediate visual context.
█ How to Use
⚪ Support & Resistance Zones (HVNs and Value Area)
Regions where a lot of volume traded tend to act like walls:
If price approaches a high-volume area from above, it may act as support.
From below, it may act as resistance.
Traders often enter or exit near these zones because they represent strong agreement among market participants.
⚪ POC Rejections & Mean Reversions
The Point of Control (POC) is the single price level with the highest volume in the profile.
When price returns to the POC and rejects it, that’s often a signal for reversal trades.
In ranging markets, price may bounce between edges of the Value Area and revert to POC.
⚪ Breakouts via Low-Volume Zones (LVNs)
Low volume areas (gaps in the profile) offer path of least resistance:
Price often moves quickly through these thin zones when momentum builds.
Use them to spot breakouts or continuation trades.
⚪ Directional Insight
Use the bull/bear separation to see whether buyers or sellers dominated at key levels.
█ Settings
Use Active Chart – Profile updates with visible candles.
Custom Period – Fixed number of bars.
Up/Down – Adjust tilt for the 3D angle.
Left/Right – Scale width of the profile.
Aggregated – Merge bull/bear volume.
Bull/Bear Shift – Separate bullish and bearish volume.
Buckets – Number of price levels.
Choose from templates or set custom colors.
POC Gradient option makes high volume bolder, low volume lighter.
-----------------
Disclaimer
The content provided in my scripts, indicators, ideas, algorithms, and systems is for educational and informational purposes only. It does not constitute financial advice, investment recommendations, or a solicitation to buy or sell any financial instruments. I will not accept liability for any loss or damage, including without limitation any loss of profit, which may arise directly or indirectly from the use of or reliance on such information.
All investments involve risk, and the past performance of a security, industry, sector, market, financial product, trading strategy, backtest, or individual's trading does not guarantee future results or returns. Investors are fully responsible for any investment decisions they make. Such decisions should be based solely on an evaluation of their financial circumstances, investment objectives, risk tolerance, and liquidity needs.

Volume Profile + Pivot Levels [ChartPrime]⯁ OVERVIEW
Volume Profile + Pivot Levels combines a rolling volume profile with price pivots to surface the most meaningful levels in your selected lookback window. It builds a left-side profile from traded volume, highlights the session’s Point of Control (PoC) , and then filters pivot highs/lows so only those aligned with significant profile volume are promoted to chart levels. Each promoted level extends forward until price retests it—so your chart stays focused on levels that actually matter.
⯁ KEY FEATURES
Rolling Volume Profile (Period & Resolution)
Calculates a profile over the last Period bars (default 200). The profile is discretized into Volume Profile Resolution bins (default 50) between the highest high and lowest low inside the window. Each bin accumulates traded volume and is drawn as a smooth left-side polyline for compact, lightweight rendering.
HL = array.new()
// collect highs/lows over 'start' bars to define profile range
for i = 0 to start - 1
HL.push(high ), HL.push(low )
H = HL.max(), L = HL.min()
bin_size = (H - L) / bins
// accumulate per-bin volume
for i = 0 to bins - 1
for j = 0 to start - 1
if close >= (L + bin_sizei) - bin_size and close < (L + bin_size*(i+1)) + bin_size
Bins += volume
Delta-Aware Coloring
The script tracks up-minus-down volume across all period to compute a net Delta . The profile, PoC line, and PoC label adopt a teal tone when net positive, and maroon when net negative—an immediate read on buyer/seller dominance inside the window.
Point of Control (PoC) + Volume Label
Automatically marks the highest-volume bin as the PoC . A horizontal PoC line extends to the last bar, and a label shows the absolute volume at the PoC. Toggle visibility via PoC input.
Pivot Detection with Volume Filter
Identifies raw pivots using Length (default 10) on both sides of the bar. Each candidate pivot is then validated against the profile: only pivots that land within their bin and meet or exceed the Filter % threshold (percentage of PoC volume) are promoted to chart levels. This removes weak, low-participation pivots.
// pivot promotion when volume% >= pivotFilter
if abs(mid - p.value) <= bin_size and volPercent >= pivotFilter
// draw labeled pivot level
line.new(p.index - pivotLength, p.value, p.index + pivotLength, p.value, width = 2)
Forward-Extending, Self-Stopping Levels
Promoted pivot levels extend forward as dotted rays. As soon as price intersects a level (high/low straddles it), that level stops extending—so your chart doesn’t clutter with stale zones.
Concise Level Labels (Volume + %)
Each promoted pivot prints a compact label at the pivot bar with its bin’s absolute volume and percentage of PoC volume (ordering flips for highs vs. lows for quick read).
Lightweight Visuals
The volume profile is rendered as a smooth polyline rather than dozens of boxes, keeping charts responsive even at higher resolutions.
⯁ SETTINGS
Volume Profile → Period : Lookback window used to compute the profile (max 500).
Volume Profile → Resolution : Number of bins; higher = finer structure.
Volume Profile → PoC : Toggle PoC line and volume label.
Pivots → Display : Show/hide volume-validated pivot levels.
Pivots → Length : Pivot detection left/right bars.
Pivots → Filter % 0–100 : Minimum bin strength (as % of PoC) required to promote a pivot level.
⯁ USAGE
Read PoC direction/color for a quick net-flow bias within your window.
Prioritize promoted pivot levels —they’re backed by meaningful participation.
Watch for first retests of promoted levels; the line will stop extending once tested.
Adjust Period / Resolution to match your timeframe (scalps → higher resolution, shorter period; swings → lower resolution, longer period).
Tighten or loosen Filter % to control how selective the level promotion is.
⯁ WHY IT’S UNIQUE
Instead of plotting every pivot or every profile bar, this tool cross-checks pivots against the profile’s internal volume weighting . You only see levels where price structure and liquidity overlap—clean, data-driven levels that self-retire after interaction, so you can focus on what the market actually defends.

Volume Profile with a few polylinesThe base of "Volume Profile with a few polylines" is another script of mine, Volume Profile (Maps) .
The structure of maps is used to gather the data. However, the drawings is done with polylines.
This enables coders to draw an entire volume profile with just a few polylines, while the range is broader.
This results in the benefit to draw more "lines" than with line.new() / box.new() alone.
🔶 CONCEPTS
🔹 Polylines
polyline.new creates a new polyline instance and displays it on the chart, sequentially connecting all of the points in the `points` array with line segments.
The segments in the drawing can be straight or curved depending on the `curved` parameter.
In this script, points are connected, starting from the bottom. The created line moves up until there is a price level where a volume value needs to be displayed,
at which the line goes to the left to the concerning volume value, coming back at the same price level until the line returns to its initial x-axis,
after which the line will continue to rise until all values are displayed.
A polyline can contain maximum 10000 points (10K).
Since the line has to go back and forth, each price/volume line takes 3 points.
In the case that 20K bars all have a different price, we would need 60K points, or just 6 polylines. A maximum of 100 polylines can be displayed.
The 3 highest volume values are displayed with line.new(), each with their own colour.
🔹 Maps
A map object is a collection that consists of key - value pairs
Each key is unique and can only appear once. When adding a new value with a key that the map already contains, that value replaces the old value associated with the key .
You can change the value of a particular key though, for example adding volume (value) at the same price (key), the latter technique is used in this script.
Volume is added to the map, associated with a particular price (default close, can be set at high, low, open,...)
When the map already contains the same price (key), the value (volume) is added to the existing volume at the associated price.
A map can contain maximum 50K values, which is more than enough to hold 20K bars (Basic 5K - Premium plan 20K), so the whole history can be put into a map.
🔹 Rounding function
This publication contains 2 round functions, which can be used to widen the Volume Profile
Round
• "Round" set at zero -> nothing changes to the source number
• "Round" set below zero -> x digit(s) after the decimal point, starting from the right side, and rounded.
• "Round" set above zero -> x digit(s) before the decimal point, starting from the right side, and rounded.
Example: 123456.789
0->123456.789
1->123456.79
2->123456.8
3->123457
-1->123460
-2->123500
Step
Another option is custom steps.
After setting "Round" to "Step", choose the desired steps in price,
Examples
• 2 -> 1234.00, 1236.00, 1238.00, 1240.00
• 5 -> 1230.00, 1235.00, 1240.00, 1245.00
• 100 -> 1200.00, 1300.00, 1400.00, 1500.00
• 0.05 -> 1234.00, 1234.05, 1234.10, 1234.15
•••
🔶 FEATURES
🔹 Volume * currency
Let's take as example BTCUSD, relative to USD, 10 volume at a price of 100 BTCUSD will be very different than 10 volume at a price of 30000 (1K vs. 300K)
If you want volume to be associated with USD, enable Volume * currency . Volume will then be multiplied by the price:
• 10 volume, 1 BTC = 100 -> 1000
• 10 volume, 1 BTC = 30K -> 300K
Polylines has the attributes curved & closed.
When "curved" is enabled the drawing will connect all points from the `points` array using curved line segments.
When "closed" is enabled the drawing will also connect the first point to the last point from the `points` array, resulting in a closed polyline.
They are default disabled, but can be enabled:
🔶 DETAILS
🔹 Put
When the map doesn't contain a price, it will be added, using map.put(id, key, value)
In our code:
map.put(originalMap, price, volume)
or
originalMap.put(price, volume)
A key (price) is now associated with a value (volume) -> key : value
Since all keys are unique, we don't have to know its position to extract the value, we just need to know the key -> map.get(id, key)
We use map.get() when a certain key already exists in the map, and we want to add volume with that value.
if originalMap.contains(price)
originalMap.put(price, originalMap.get(price) + volume)
-> At the last bar, all prices (source) are now associated with volume.
🔶 SETTINGS
Source : Set source of choice; default close , can be set as high , low , open , ...
Volume & currency : Enable to multiply volume with price (see Features )
Amount of bars : Set amount of bars which you want to include in the Volume Profile
🔹 Round -> ' Round/Step '
Round -> see Concepts
Step -> see Concepts
🔹 Display Volume Profile
Offset: shifts the Volume Profile (max. 500 bars to the right of last bar, see Features )
Max width Volume Profile: largest volume will be x bars wide, the rest is displayed as a ratio against largest volume (see Features )
Colours
Curved: make lines curved
Closed: connect last with first point
🔶 LIMITATIONS
• Lines won't go further than first bar (coded).
• The Volume Profile can be placed maximum 500 bar to the right of last price.

Volume Profile (Maps) [LuxAlgo]The Pine Script® developers have unleashed "maps"!
Volume Profile (Maps) displays volume, associated with price, above and below the latest price, by using maps
The largest and second-largest volume is highlighted.
🔶 USAGE
The proposed script can highlight more frequent closing prices/prices with the highest volume, potentially highlighting more liquid areas. The prices with the highest associated volume (in red and orange in the indicator) can eventually be used as support/resistance levels.
Voids within the volume profile can highlight large price displacements (volatile variations).
🔶 CONCEPTS
🔹 Maps
A map object is a collection that consists of key - value pairs
Each key is unique and can only appear once. When adding a new value with a key that the map already contains, that value replaces the old value associated with the key .
You can change the value of a particular key though, for example adding volume (value) at the same price (key), the latter technique is used in this script.
Volume is added to the map, associated with a particular price (default close, can be set at high, low, open,...)
When the map already contains the same price (key), the value (volume) is added to the existing volume at the associated price.
A map can contain maximum 50K values, which is more than enough to hold 20K bars (Basic 5K - Premium plan 20K), so the whole history can be put into a map.
🔹 Visible line/box limit
We can only display maximum 500 line.new() though.
The code locates the current (last) close, and displays volume values around this price, using lines, for example 250 lines above and 250 lines below current price.
If one side contains fewer values, the other side can show more lines, taking the maximum out of the 500 visible line limitation.
Example (max. 500 lines visible)
• 100 values below close
• 2000 values above close
-> 100 values will be displayed below close
-> 400 remaining -> 400 values will be displayed above close
Pushing the limits even further, when ' Amount of bars ' is set higher than 500, boxes - box.new() - will be used as well.
These have a limit of 500 as well, bringing the total limit to 1000.
Note that there are visual differences when boxes overlap against lines.
If this is confusing, please keep ' Amount of bars ' at max. 500 (then only lines will be used).
🔹 Rounding function
This publication contains 2 round functions, which can be used to widen the Volume Profile
Round
• "Round" set at zero -> nothing changes to the source number
• "Round" set below zero -> x digit(s) after the decimal point, starting from the right side, and rounded.
• "Round" set above zero -> x digit(s) before the decimal point, starting from the right side, and rounded.
Example: 123456.789
0->123456.789
1->123456.79
2->123456.8
3->123457
-1->123460
-2->123500
Step
Another option is custom steps.
After setting "Round" to "Step", choose the desired steps in price,
Examples
• 2 -> 1234.00, 1236.00, 1238.00, 1240.00
• 5 -> 1230.00, 1235.00, 1240.00, 1245.00
• 100 -> 1200.00, 1300.00, 1400.00, 1500.00
• 0.05 -> 1234.00, 1234.05, 1234.10, 1234.15
•••
🔶 FEATURES
🔹 Adjust position & width
🔹 Table
The table shows the details:
• Size originalMap : amount of elements in original map
• # higher: amount of elements, higher than last "close" (source)
• index "close" : index of last "close" (source), or # element, lower than source
• Size newMap : amount of elements in new map (used for display lines)
• # higher : amount of elements in newMap, higher than last "close" (source)
• # lower : amount of elements in newMap, lower than last "close" (source)
🔹 Volume * currency
Let's take as example BTCUSD, relative to USD, 10 volume at a price of 100 BTCUSD will be very different than 10 volume at a price of 30000 (1K vs. 300K)
If you want volume to be associated with USD, enable Volume * currency . Volume will then be multiplied by the price:
• 10 volume, 1 BTC = 100 -> 1000
• 10 volume, 1 BTC = 30K -> 300K
Disabled
Enabled
🔶 DETAILS
🔹 Put
When the map doesn't contain a price, it will be added, using map.put(id, key, value)
In our code:
map.put(originalMap, price, volume)
or
originalMap.put(price, volume)
A key (price) is now associated with a value (volume) -> key : value
Since all keys are unique, we don't have to know its position to extract the value, we just need to know the key -> map.get(id, key)
We use map.get() when a certain key already exists in the map, and we want to add volume with that value.
if originalMap.contains(price)
originalMap.put(price, originalMap.get(price) + volume)
-> At the last bar, all prices (source) are now associated with volume.
🔹 Copy & sort
Next, every key of the map is copied and sorted (array of keys), after which the index (idx) is retrieved of last (current) price.
copyK = originalMap.keys().copy()
copyK.sort()
idx = copyK.binary_search_leftmost(src)
Then left and right side of idx is investigated to show a maximum amount of lines at both sides of last price.
🔹 New map & display
The keys (from sorted array of copied keys) that will be displayed are put in a new map, with the associated volume values from the original map.
newMap = map.new()
🔹 Re-cap
• put in original amp (price key, volume value)
• copy & sort
• find index of last price
• fetch relevant keys left/right from that index
• put keys in new map and fetch volume associated with these keys (from original map)
Simple example (only show 5 lines)
bar 0, price = 2, volume = 23
bar 1, price = 4, volume = 3
bar 2, price = 8, volume = 21
bar 3, price = 6, volume = 7
bar 4, price = 9, volume = 13
bar 5, price = 5, volume = 85
bar 6, price = 3, volume = 13
bar 7, price = 1, volume = 4
bar 8, price = 7, volume = 9
Original map:
Copied keys array:
Sorted:
-> 5 keys around last price (7) are fetched (5, 6, 7, 8, 9)
-> keys are placed into new map + volume values from original map
Lastly, these values are displayed.
🔶 SETTINGS
Source : Set source of choice; default close , can be set as high , low , open , ...
Volume & currency : Enable to multiply volume with price (see Features )
Amount of bars : Set amount of bars which you want to include in the Volume Profile
Max lines : maximum 1000 (if you want to use only lines, and no boxes -> max. 500, see Concepts )
🔹 Round -> ' Round/Step '
Round -> see Concepts
Step -> see Concepts
🔹 Display Volume Profile
Offset: shifts the Volume Profile (max. 500 bars to the right of last bar, see Features )
Max width Volume Profile: largest volume will be x bars wide, the rest is displayed as a ratio against largest volume (see Features )
Show table : Show details (see Features )
🔶 LIMITATIONS
• Lines won't go further than first bar (coded).
• The Volume Profile can be placed maximum 500 bar to the right of last price.
• Maximum 500 lines/boxes can be displayed

Volume Profile - Custom Range, Interactive by DGTVolume Profile - Custom Range aims to display trading activity at specific price levels over user defined Custom Range of trading. Start and End Time is Interactive , they can be adjusted simply by clicking on the chart and drag the lines to specify the desired custom range. Same as is with the drawing tools available in TV
Please note, while switching between timeframes or switching to different instruments with different exchange timezones you may need to adjust the locations in case the plotting is not displied
Volume Profile - Custom Range is plotted as two horizontal histograms on the finacial isntrumnet's chart that highlights the trader's common interest at specific price levels as well as aims to reveal dominant party of who is in control, bulls or bears
You are also invated to galnce at Volume-Profile-and-Volume-Indicator , Anchored-Volume-Profile , and Price Action-Support-Resistance for different perspective of Volume Profiles
Special thanks to everyone who commented and presented their valuable suggestions
Disclaimer: Trading success is all about following your trading strategy and the indicators should fit within your trading strategy, and not to be traded upon solely
The script is for informational and educational purposes only. Use of the script does not constitutes professional and/or financial advice. You alone the sole responsibility of evaluating the script output and risks associated with the use of the script. In exchange for using the script, you agree not to hold dgtrd TradingView user liable for any possible claim for damages arising from any decision you make based on use of the script

Volume Profile (Simple)Simple Volume Profile (Simple)
Master the Market's Structure with a Clear View of Volume
by mercaderoaurum
The Simple Volume Profile (Simple) indicator removes the guesswork by showing you exactly where the most significant trading activity has occurred. By visualizing the Point of Control (POC) and Value Area (VA) for today and yesterday, you can instantly identify the price levels that matter most, giving you a critical edge in your intraday trading.
This tool is specifically optimized for day trading SPY on a 1-minute chart, but it's fully customizable for any symbol or timeframe.
Key Features
Multi-Day Analysis: Automatically plots the volume profiles for the current and previous trading sessions, allowing you to see how today's market is reacting to yesterday's key levels.
Automatic Key Level Plotting: Instantly see the most important levels from each session:
Point of Control (POC): The single price level with the highest traded volume, acting as a powerful magnet for price.
Value Area High (VAH): The upper boundary of the area where 50% of the volume was traded. It often acts as resistance.
Value Area Low (VAL): The lower boundary of the 50% value area, often acting as support.
Extended Levels: The POC, VAH, and VAL from previous sessions are automatically extended into the current day, providing a clear map of potential support and resistance zones.
Customizable Sessions: While optimized for the US stock market, you can define any session time and time zone, making it a versatile tool for forex, crypto, and futures traders.
Core Trading Strategies
The Simple Volume Profile helps you understand market context. Instead of trading blind, you can now make decisions based on where the market has shown the most interest.
1. Identifying Support and Resistance
This is the most direct way to use the indicator. The extended lines from the previous day are your roadmap for the current session.
Previous Day's POC (pPOC): This is the most significant level. Watch for price to react strongly here. It can act as powerful support if approached from above or strong resistance if approached from below.
Previous Day's VAH (pVAH): Expect this level to act as initial resistance. A clean break above pVAH can signal a strong bullish trend.
Previous Day's VAL (pVAL): Expect this level to act as initial support. A firm break below pVAL can indicate a strong bearish trend.
Example Strategy: If SPY opens and rallies up to the previous day's VAH and stalls, this is a high-probability area to look for a short entry, with a stop loss just above the level.
2. The "Open-Drive" Rejection
How the market opens in relation to the previous day's value area is a powerful tell.
Open Above Yesterday's Value Area: If the market opens above the pVAH, it signals strength. The first pullback to test the pVAH is often a key long entry point. The level is expected to flip from resistance to support.
Open Below Yesterday's Value Area: If the market opens below the pVAL, it signals weakness. The first rally to test the pVAL is a potential short entry, as the level is likely to act as new resistance.
3. Fading the Extremes
When price pushes far outside the previous day's value area, it can become overextended.
Reversal at Highs: If price rallies significantly above the pVAH and then starts to lose momentum (e.g., forming bearish divergence on RSI or a topping pattern), it could be an opportunity to short the market, targeting a move back toward the pVAH or pPOC.
Reversal at Lows: Conversely, if price drops far below the pVAL and shows signs of bottoming, it can be a good opportunity to look for a long entry, targeting a reversion back to the value area.
Recommended Settings (SPY Intraday)
These settings are the default and are optimized for scalping or day trading SPY on a 1-minute chart.
Value Area (%): 50%. This creates a tighter, more sensitive value area, perfect for identifying the most critical intraday zones.
Number of Rows: 1000. This high resolution is essential for a low-volatility instrument like SPY, ensuring that the profile is detailed and the levels are precise.
Session Time: 0400-1800 in America/New_York. This captures the full pre-market and core session, which is crucial for understanding the day's complete volume story.
Ready to trade with an edge? Add the Simple Volume Profile (Multi-Day) to your chart now and see the market in a new light!

Volume Profile & Smart Money Explorer🔍 Volume Profile & Smart Money Explorer: Decode Institutional Footprints
Master the art of institutional trading with this sophisticated volume analysis tool. Track smart money movements, identify peak liquidity windows, and align your trades with major market participants.
🌟 Key Features:
📊 Triple-Layer Volume Analysis
• Total Volume Patterns
• Directional Volume Split (Up/Down)
• Institutional Flow Detection
• Real-time Smart Money Tracking
• Historical Pattern Recognition
⚡ Smart Money Detection
• Institutional Trade Identification
• Large Block Order Tracking
• Smart Money Concentration Periods
• Whale Activity Alerts
• Volume Threshold Analysis
📈 Advanced Profiling
• Hourly Volume Distribution
• Directional Bias Analysis
• Liquidity Heat Maps
• Volume Pattern Recognition
• Custom Threshold Settings
🎯 Strategic Applications:
Institutional Trading:
• Track Big Player Movements
• Identify Accumulation/Distribution
• Follow Smart Money Flow
• Detect Institutional Trading Windows
• Monitor Block Orders
Risk Management:
• Identify High Liquidity Windows
• Avoid Thin Market Periods
• Optimize Position Sizing
• Track Market Participation
• Monitor Volume Quality
Market Analysis:
• Volume Pattern Recognition
• Smart Money Flow Analysis
• Liquidity Window Identification
• Institutional Activity Cycles
• Market Depth Analysis
💡 Perfect For:
• Professional Traders
• Volume Profile Traders
• Institutional Traders
• Risk Managers
• Algorithmic Traders
• Smart Money Followers
• Day Traders
• Swing Traders
📊 Key Metrics:
• Normalized Volume Profiles
• Institutional Thresholds
• Directional Volume Split
• Smart Money Concentration
• Historical Patterns
• Real-time Analysis
⚡ Trading Edge:
• Trade with Institution Flow
• Identify Optimal Entry Points
• Recognize Distribution Patterns
• Follow Smart Money Positioning
• Avoid Thin Markets
• Capitalize on Peak Liquidity
🎓 Educational Value:
• Understand Market Structure
• Learn Volume Analysis
• Master Institutional Patterns
• Develop Market Intuition
• Track Smart Money Flow
🛠️ Customization:
• Adjustable Time Windows
• Flexible Volume Thresholds
• Multiple Timeframe Analysis
• Custom Alert Settings
• Visual Preference Options
Whether you're tracking institutional flows in crypto markets or following smart money in traditional markets, the Volume Profile & Smart Money Explorer provides the deep insights needed to trade alongside the biggest players.
Transform your trading from retail guesswork to institutional precision. Know exactly when and where smart money moves, and position yourself ahead of major market shifts.
#VolumeProfile #SmartMoney #InstitutionalTrading #MarketAnalysis #TradingView #VolumeAnalysis #CryptoTrading #ForexTrading #TechnicalAnalysis #Trading #PriceAction #MarketStructure #OrderFlow #Liquidity #RiskManagement #TradingStrategy #DayTrading #SwingTrading #AlgoTrading #QuantitativeTrading

Volume Profile [ActiveQuants]The Volume Profile indicator visualizes the distribution of trading volume across price levels over a user-defined historical period. It identifies key liquidity zones, including the Point of Control (POC) (price level with the highest volume) and the Value Area (price range containing a specified percentage of total volume). This tool is ideal for traders analyzing support/resistance levels, market sentiment , and potential price reversals .
█ CORE METHODOLOGY
Vertical Price Rows: Divides the price range of the selected lookback period into equal-height rows.
Volume Aggregation: Accumulates bullish/bearish or total volume within each price row.
POC: The row with the highest total volume.
Value Area: Expands from the POC until cumulative volume meets the user-defined threshold (e.g., 70%).
Dynamic Visualization: Rows are plotted as horizontal boxes with widths proportional to their volume.
█ KEY FEATURES
- Customizable Lookback & Resolution
Adjust the historical period ( Lookback ) and granularity ( Number of Rows ) for precise analysis.
- Configurable Profile Width & Horizontal Offset
Control the relative horizontal length of the profile rows, and set the distance from the current bar to the POC row’s anchor.
Important: Do not set the horizontal offset too high. Indicators cannot be plotted more than 500 bars into the future.
- Value Area & POC Highlighting
Set the percentage of total volume required to form the Value Area , ensuring that key volume levels are clearly identified.
Value Area rows are colored distinctly, while the POC is marked with a bold line.
- Flexible Display Options
Show bullish/bearish volume splits or total volume.
Place the profile on the right or left of the chart.
- Gradient Coloring
Rows fade in color intensity based on their relative volume strength .
- Real-Time Adjustments
Modify horizontal offset, profile width, and appearance without reloading.
█ USAGE EXAMPLES
Example 1: Basic Volume Profile with Value Area
Settings:
Lookback: 500 bars
Number of Rows: 100
Value Area: 70%
Display Type: Up/Down
Placement: Right
Image Context:
The profile appears on the right side of the chart. The POC (orange line) marks the highest volume row. Value Area rows (green/red) extend above/below the POC, containing 70% of total volume.
Example 2: Total Volume with Gradient Colors
Settings:
Lookback: 800 bars
Number of Rows: 100
Profile Width: 60
Horizontal Offset: 20
Display Type: Total
Gradient Colors: Enabled
Image Context:
Rows display total volume in a single color with gradient transparency. Darker rows indicate higher volume concentration.
Example 3: Left-Aligned Profile with Narrow Value Area
Settings:
Lookback: 600 bars
Number of Rows: 100
Profile Width: 45
Horizontal Offset: 500
Value Area: 50%
Profile Placement: Left
Image Context:
The profile shifts to the left, with a tighter Value Area (50%).
█ USER INPUTS
Calculation Settings
Lookback: Historical bars analyzed (default: 500).
Number of Rows: Vertical resolution of the profile (default: 100).
Profile Width: Horizontal length of rows (default: 50).
Horizontal Offset: Distance from the current bar to the POC (default: 50).
Value Area (%): Cumulative volume threshold for the Value Area (default: 70%).
Volume Display: Toggle between Up/Down (bullish/bearish) or Total volume.
Profile Placement: Align profile to the Right or Left of the chart.
Appearance
Rows Border: Customize border width/color.
Gradient Colors: Enable fading color effects.
Value Area Colors: Set distinct colors for bullish and bearish Value Area rows.
POC Line: Adjust color, width, and visibility.
█ CONCLUSION
The Volume Profile indicator provides a dynamic, customizable view of market liquidity. By highlighting the POC and Value Area, traders can identify high-probability reversal zones, gauge market sentiment, and align entries/exits with key volume levels.
█ IMPORTANT NOTES
⚠ Lookback Period: Shorter lookbacks prioritize recent activity but may omit critical levels.
⚠ Horizontal Offset Limitation: Avoid excessively high offsets (e.g., close to ±300). TradingView restricts plotting indicators more than 500 bars into the future, which may truncate or hide the profile.
⚠ Risk Management: While the indicator highlights areas of concentrated volume, always use it in combination with other technical analysis tools and proper risk management techniques.
█ RISK DISCLAIMER
Trading involves substantial risk. The Volume Profile highlights historical liquidity but does not predict future price movements. Always use stop-loss orders and confirm signals with additional analysis. Past performance is not indicative of future results.
📊 Happy trading! 🚀

Volume profile [Signals] - By Leviathan [Mindyourbuisness]Market Sessions and Volume Profile with Sweep Signals - Based on Leviathan's Volume Profile
This indicator is an enhanced version of Leviathan's Volume Profile indicator, adding session-based value area analysis and sweep detection signals. It combines volume profile analysis with market structure concepts to identify potential reversal opportunities.
Features
- Session-based volume profiles (Daily, Weekly, Monthly, Quarterly, Yearly)
- Forex sessions support (Tokyo, London, New York)
- Value Area analysis with POC, VAH, and VAL levels
- Extended level visualization for the last completed session
- Sweep detection signals for key value area levels
Sweep Signals Explanation
The indicator detects two types of sweeps at VAH, VAL, and POC levels:
Bearish Sweeps (Red Triangle Down)
Conditions:
- Price makes a high above the level (VAH/VAL/POC)
- Closes below the level
- Closes below the previous candle's low
- Previous candle must be bullish
Trading Implication: Suggests a failed breakout and potential reversal to the downside. These sweeps often indicate stop-loss hunting above key levels followed by institutional selling.
Bullish Sweeps (Green Triangle Up)
Conditions:
- Price makes a low below the level (VAH/VAL/POC)
- Closes above the level
- Closes above the previous candle's high
- Previous candle must be bearish
Trading Implication: Suggests a failed breakdown and potential reversal to the upside. These sweeps often indicate stop-loss hunting below key levels followed by institutional buying.
Trading Guidelines
1. Use sweep signals in conjunction with the overall trend
2. Look for additional confirmation like:
- Volume surge during the sweep
- Price action patterns
- Support/resistance levels
3. Consider the session's volatility and time of day
4. More reliable signals often occur at VAH and VAL levels
5. POC sweeps might indicate stronger reversals due to their significance as fair value levels
Notes
- The indicator works best on higher timeframes (1H and above)
- Sweep signals are more reliable during active market hours
- Consider using multiple timeframe analysis for better confirmation
- Past performance is not indicative of future results
Credits: Original Volume Profile indicator by Leviathan
Volume Profile Matrix [LuxAlgo]The Volume Profile Matrix indicator extends from regular volume profiles by also considering calculation intervals within the calculation window rather than only dividing the calculation window in rows.
Note that this indicator is subject to repainting & back-painting, however, treating the indicator as a tool for identifying frequent points of interest can still be very useful.
🔶 SETTINGS
Lookback: Number of most recent bars used to calculate the indicator.
Columns: Number of columns (intervals) used to calculate the volume profile matrix.
Rows: Number of rows (intervals) used to calculate the volume profile matrix.
🔶 USAGE
The Volume Profile Matrix indicator can be used to obtain more information regarding liquidity on specific time intervals. Instead of simply dividing the calculation window into equidistant rows, the calculation is done through a grid.
Grid cells with trading activity occurring inside them are colored. More activity is highlighted through a gradient and by default, cells with a color that are closer to red indicate that more trading activity took place within that cell. The cell with the highest amount of trading activity is always highlighted in yellow.
Each interval (column) includes a point of control which highlights an estimate of the price level with the highest traded volume on that interval. The level with the highest traded volume of the overall grid is extended to the most recent bar.

volume profile ranking indicator📌 Introduction
This script implements a volume profile ranking indicato for TradingView. It is designed to visualize the distribution of traded volume over price levels within a defined historical window. Unlike TradingView’s built-in Volume Profile, this script gives full customization of the profile drawing logic, binning, color gradient, and the ability to anchor the profile to a specific date.
⚙️ How It Works (Logic)
1. Inputs
➤POC Lookback Days (lookback): Defines how many bars (days) to look back from a selected point to calculate the volume distribution.
➤Bin Count (bin_count): Determines how many price bins (horizontal levels) the price range will be divided into.
➤Use Custom Lookback Date (useCustomDate): Enables/disables manually selecting a backtest start date.
➤Custom Lookback Date (customDate): When enabled, the profile will calculate volume based on this date instead of the most recent bar.
2. Target Bar Determination
➤If a custom date is selected, the script searches for the bar closest to that date within 1000 bars.
➤If not, it defaults to the latest bar (bar_index).
➤The profile is drawn only when the current bar is close to the target bar (within ±2 bars), to avoid unnecessary recalculations and performance issues.
3. Volume Binning
➤The price range over the lookback window is divided into bin_count segments.
➤For each bar within the lookback window, its volume is added to the appropriate bin based on price.
➤If the price falls outside the expected range, it is clamped to the first or last bin.
4. Ranking and Sorting
➤A bubble sort ranks each bin by total volume.
➤The most active bin (POC, or Point of Control) is highlighted with a thicker bar.
5. Rendering
➤Horizontal bars (line.new) represent volume intensity in each price bin.
➤Each bar is color-coded by volume heat: more volume = more intense color.
➤Labels (label.new) show:
➤Total volume
➤Rank
➤Percentage of total volume
➤Price range of the bin
🧑💻 How to Use
1. Add the Script to Your Chart
➤Copy the code into TradingView’s Pine Script editor and add it to your chart.
2. Set Lookback Period
➤Default is 252 bars (about one year for daily charts), but can be changed via the input.
3. (Optional) Use Custom Date
●Toggle "Use Custom Lookback Date" to true.
➤Pick a date in the "Custom Lookback Date" input to anchor the profile.
4. Analyze the Volume Distribution
➤The longest (thickest) red/orange bar represents the Point of Control (POC) — the price with the most volume traded.
➤Other bars show volume distribution across price.
➤Labels display useful metrics to evaluate areas of high/low interest.
✅ Features
🔶 Customizable anchor point (custom date).
🔶Adjustable bin count and lookback length.
🔶 Clear visualization with heatmap coloring.
🔶 Lightweight and performance-optimized (especially with the shouldDrawProfile filter)

Volume Profile PlusThis indicator provides a high-resolution and high-precision implementation of Volume Profile with flexible range settings. Its key features include:
1. Support for a high resolution of up to 2,500 rows.
2. Capability to examine lower timeframe bars (default 5,000 intra-bars) for enhanced precision.
3. Three range modes — "Visible Range", "Anchored Range", and "All Range".
4. Highlighting of Point of Control and Value Area.
5. Extensive customization options allowing users to configure dimensions, on-chart placements, and color schemes.
🔵 Settings
The settings screen, along with the explanations for each setting, is provided below:
🔵 High Resolution using Polyline
Inspired by @fikira, this indicator utilizes the newly introduced `polyline` type in PineScript to plot the volume profile. It employs a single polyline instance to represent the entire histogram. With each polyline instance supporting up to 10,000 points and each histogram row requiring 4 points, this indicator can accommodate 2500 rows, resulting in a significantly higher resolution compared to conventional volume profile indicators that use `line`s or `box`es to draw the histogram.
🔵 High Precision Data-binning using Lower Timeframe Data
Conventional volume profile indicators often face one or both of the following limitations:
1. They only consider volume within the chart's current timeframe.
2. They assign each bar's total volume to a single price bucket based on the bar's average price, rather than distributing volume across multiple price buckets.
As a result, when the number of bars in the chart is low, those indicators may provide imprecise results, making it difficult to accurately identify significant volume nodes and the point of control.
To address these limitations and enhance accuracy, this indicator examines data from lower timeframes and distributes the volume to fine-grained price buckets. It intelligently selects an appropriate lower timeframe to ensure precise output while complying with a maximum specified number of bars to maintain good performance.
🔵 Three Range Modes
This indicator offers users the flexibility to choose from three range modes:
1. Visible Range (Default Mode): In this mode, the volume profile calculation begins at the time of the left-most bar displayed in the current viewport. As the user scrolls through the viewport, the volume profile updates automatically.
2. Anchored Range: This mode allows the user to set the start time either by using the datetime input boxes or by dragging the anchor line on the chart.
3. All Range: In this mode, the volume profile calculation is based on all the historical bars available in the chart.

Volume Profile with Delta [TradeMaster Lite]The indicator estimates and displays the total traded volume and it's delta** at each price level during the user-defined period. It can be used to identify key support and resistance levels, determine logical take profit and stop loss levels, identify balanced and unbalanced markets and determine trend strength. The indicator offers different approaches to visualize the volume profile and can be chosen based on your preferred trading strategy and analysis method. The position and size of the Volume Profile is fully customizable, it can even be flipped if needed!
Three different display types (cosmetic effect only):
Classic
Compact
Modern
The Lite version offers three different range types:
Visible Range: displays the volume profile for the visible range of bars or candles on the chart. It adjusts dynamically as you change the chart view making it ideal for the modern trader who values both precision and simplicity.
Open End: displays the volume profile from a specific start date without a defined end, including real delta data. It provides an overview of the volume activity across all price levels of the examined period.
Fixed End: lets you define a specific start and end point for the volume profile. It can be useful if you want to analyze the volume activity within a specific time period or price range.
👉 Usage
The Volume Profile is a histogram that shows the estimated trading volume at certain price levels, how much was sold and how much was bought of the asset. The longer the histogram, the greater the trading volume at that price level. The Delta estimates which side was dominant at that price level and by how much.
To make the most out of the indicator, you can look for
pullbacks to high volume nodes or value areas,
initial equilibrium pullbacks,
buy or sell opportunities for price reversals,
institutional order flow.
The largest histogram node is called the Point of Control (POC). It is the estimated real market price of a coin. There's a common belief that when the price is above this point, the market sentiment is bullish, and when it's below, the sentiment turns bearish. It can act as a strong support if the price is above it and as strong resistance if the price is below it.
Price action usually finds the most support and resistance and the edge of the high volume areas. The indicator can mark these as VAH and VAL (Value Area High and Low).
In addition to the indication of support and resistance zones, the volume profile can also be used to infer the speed of price movements. At levels where there is little trading volume, faster and more volatile price movements are expected. In such scenarios the price may fall or rise faster to the next high volume zone.
👉 General advice
Confirming Signals with other indicators:
As with all technical indicators, it is important to confirm potential signals with other analytical tools, such as support and resistance levels, as well as indicators like RSI, MACD, and volume. This helps increase the probability of a successful trade.
Use proper risk management:
When using this or any other indicator, it is crucial to have proper risk management in place. Consider implementing stop-loss levels and thoughtful position sizing.
Combining with other technical indicators:
The indicator can be effectively used alongside other technical indicators to create a comprehensive trading strategy and provide additional confirmation.
Keep in Mind:
Thorough research and backtesting are essential before making any trading decisions. Furthermore, it's crucial to have a solid understanding of the indicator and its behavior. Additionally, incorporating fundamental analysis and considering market sentiment can be vital factors to take into account in your trading approach.
Limitations:
The Lite version shows simple delta with current timeframe volume data.
The indicators within the TradeMaster Lite package aim for simplicity and efficiency, while retaining their original purpose and value. Some settings, functions or visuals may be simpler than expected.
**The Delta estimates which side was dominant at that price level and by how much. It is the difference between bull and bear volume of the candle.
⭐ Conclusion
We hold the view that the true path to success is the synergy between the trader and the tool, contrary to the common belief that the tool itself is the sole determinant of profitability. The actual scenario is more nuanced than such an oversimplification. Our aim is to offer useful features that meet the needs of the 21st century and that we actually use.
🛑 Risk Notice:
Everything provided by trademasterindicator – from scripts, tools, and articles to educational materials – is intended solely for educational and informational purposes. Past performance does not assure future returns.