Volume CandlesHello traders!
Well, I was trying to implement EquiVolume Charts that were developed by Richard W. Arms, but unfortunately I got a poor result.
Instead, I used my groundwork on EquiVolumes to create Volume Candles indicator to help you make better, smarter trades.
What are the cool features?
Excellently filters the instrument's movements
Gives a better view of the accumulation/distribution phases
Completely removes price gaps
Works on ANY instrument that has available volume data.
Personally, I am a big fan of the volume-based indicators and to clarify my position I cite the following words of Buff Pelz Dormeier from his book "Investing with Volume Analysis: Identify, Follow, and Profit from Trends" :
A trade produces only two pieces of information: the price and price's neglected sibling, volume. Perhaps the least appreciated piece of the puzzle, volume represents fertile ground for technical analysis. Proficiency in volume analysis is a rare skill. Properly understood, though, volume analysis can provide its practitioner with the power to peer deeply into market mechanics.
Benjamin Graham, the father of value investing and a mentor of Warren Buffett, often called the market a 'voting machine'. If so, then volume is the ballot box. Volume is a literal illustration of the power behind the forces of supply and demand.
Volume is understood as the validation of price, the source of liquidity, the substantiation of information, the fulfillment of convictions, the revelation of divergent opinions, the fuel of the market, the proponent of truth, and the energy behind the velocity of money. If you believe any of this information might be important in making an investment decision, volume analysis is important to you.
I attached some screenshots to show you how it works with other instruments.
How to get access
Buy for only 129$ to get lifetime access to this indicator
Like and follow for more cool indicators!
Happy Trading!
在腳本中搜尋"volume"

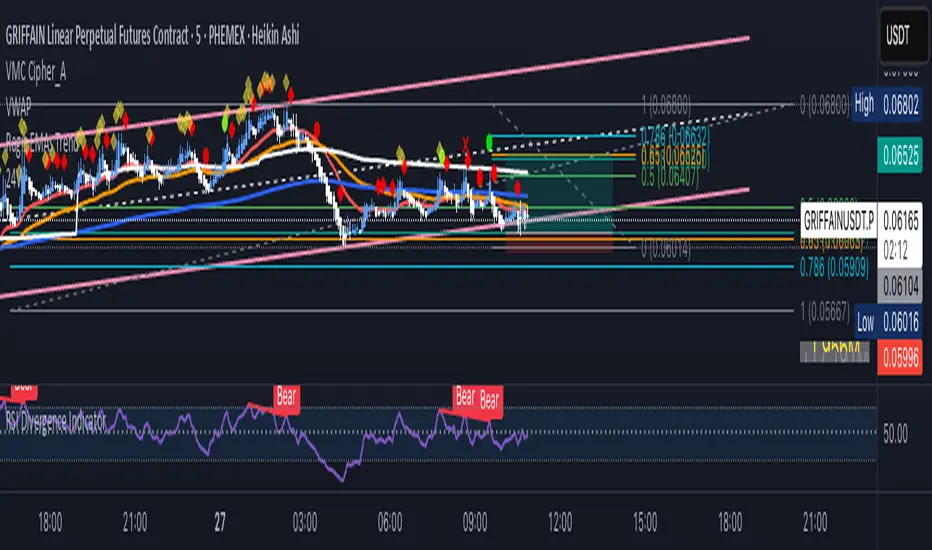
CVD Divergence & Volume ProfileThis Pine Script indicator, named "CVD Divergence & Volume Profile," is designed to identify potential trading opportunities by combining Cumulative Volume Delta (CVD) divergence with Volume Profile levels and an optional Simple Moving Average (SMA) trend filter. It plots signals directly on the price chart.
Here's a breakdown of what each component does and how to potentially trade with it:
1. Cumulative Volume Delta (CVD) Divergence
What it does: CVD measures the cumulative difference between buying and selling volume. A rising CVD indicates more buying pressure, while a falling CVD indicates more selling pressure. Divergence occurs when the price action contradicts the CVD's direction, suggesting a potential shift in momentum or trend reversal.
Bearish Divergence: The price makes a higher high, but the CVD makes a lower high (or fails to make a new high). This suggests that despite the price increasing, the underlying buying pressure is weakening.
Bullish Divergence: The price makes a lower low, but the CVD makes a higher low (or fails to make a new low). This suggests that despite the price decreasing, the underlying selling pressure is weakening.
Visualization:
Red triangle pointing down on the chart indicates a Bearish Divergence signal.
Green triangle pointing up on the chart indicates a Bullish Divergence signal.
2. Volume Profile Levels (VAH, VAL, POC)
What it does: The indicator calculates simplified Volume Profile levels over a user-defined vp_range (number of candles). These levels represent areas where significant trading activity has occurred:
VAH (Value Area High): The upper boundary of the "Value Area," where 70% of the volume traded.
VAL (Value Area Low): The lower boundary of the "Value Area," where 70% of the volume traded.
POC (Point of Control): The price level within the vp_range where the most volume was traded.
Significance: These levels often act as significant support and resistance zones.
Visualization:
Orange lines for VAH and VAL.
Yellow line for POC.
Zone Proximity (zone_thresh): The indicator only generates divergence signals if the current close price is within a specified percentage zone_thresh of either VAH, VAL, or POC. This filters signals to areas of high liquidity and potential turning points.
3. Trend Filter (SMA)
What it does: This is an optional filter (use_trend_filter) that uses a Simple Moving Average (sma_period, default 200).
Significance: It helps ensure that divergence signals are traded in alignment with the broader market trend, potentially increasing their reliability.
For long signals (bullish divergence), the price (close) must be above the SMA (indicating an uptrend).
For short signals (bearish divergence), the price (close) must be below the SMA (indicating a downtrend).
Visualization: A blue line on the chart representing the SMA.
How to Trade with It (Potential Strategies)
The indicator aims to provide high-probability entry points by combining multiple confirming factors. Here's how you might interpret and trade the signals:
Identify Divergence: Look for the triangle signals on your chart (red for bearish, green for bullish).
Confirm Proximity to Volume Profile Levels: The signal itself confirms that the price is near a significant Volume Profile level (VAH, VAL, or POC). These are areas where price often reacts.
Bullish Signal (Green Triangle): This suggests buying momentum is returning after a price decline, especially when the price is near VAL or POC, which might act as support.
Bearish Signal (Red Triangle): This suggests selling momentum is increasing after a price rally, especially when the price is near VAH or POC, which might act as resistance.
Check Trend Alignment (SMA Filter):
For a long trade: You would ideally want to see a green triangle (bullish divergence) while the price is above the blue SMA line. This indicates a bullish divergence confirming a potential bounce within an existing uptrend.
For a short trade: You would ideally want to see a red triangle (bearish divergence) while the price is below the blue SMA line. This indicates a bearish divergence confirming a potential rejection within an existing downtrend.
Entry and Exit Considerations:
Entry: Consider entering a trade on the candle where the signal appears, or on the subsequent candle for confirmation.
Stop Loss: For a long trade, a logical stop-loss could be placed below the lowest point of the divergence, or below the VAL/POC if the signal occurred near it. For a short trade, above the highest point of the divergence or VAH/POC.
Take Profit: Targets could be set at the opposite Volume Profile level, previous swing highs/lows, or using a fixed risk-reward ratio.
Example Trading Scenario:
Long Trade: You see a green triangle (bullish divergence) printed on the chart. You notice the price is currently at the VAL (orange line). You check the blue SMA line and confirm that the price is above it (uptrend). This confluence of factors (bullish divergence, support at VAL, and uptrend) provides a strong potential long entry signal. You might enter, place your stop loss just below VAL, and target VAH or the next resistance level.
Short Trade: You see a red triangle (bearish divergence). The price is at the VAH (orange line). The price is also below the blue SMA line (downtrend). This suggests a potential short entry. You might enter, place your stop loss just above VAH, and target VAL or the next support level.

Volume candle intraday 90% valid - with alertThe candle with the highest volume of the day and that creates a new daily high or low.
- Only usable on M15 timeframes;
- You can set a range of bars (from the beginning of the day) to ignore;
- "90% valid" means a candle with volume greater than 90% of the last candle with the highest volume of the day (in the script you can change the percentage of valid volumes to define the candle volume, replacing all the "90" with the desired percentage);
- Long volumes are compared to longs and short volumes are compared to shorts;
- Script created with ChatGpt;
The psychology behind this pattern is the following: on the daily high/low, a lot of volumes will enter in a short time, either by absorption: buyers or sellers enter en masse following the trend when it is too late; or by exhaustion: buyers or sellers who entered en masse and late have no more strength to continue pushing the price, they cause a volume peak to buy/sell as much as they could, then their enemies take over forming a high/low).
Happy trading everyone! :)
###################################################################################
La candela con il volume più alto della giornata e che crea un nuovo massimo o minimo giornaliero.
- Utilizzabile solo su timeframe M15;
- Si può impostare un range di barre(da inizio giornata) da ignorare;
- "90% valida" sta per candela con volume superiore del 90% dell'ultima candela con volume più alto della giornata(nello script si può cambiare percentuale di volumi validi per definire candela volume, sostituendo tutti i "90" con la percentuale desiderata);
- I volumi long vengono confrontati con i long e i volumi short con gli short;
- Script creato con ChatGpt;
La psicologia dietro questo pattern è la seguente: sul massimo/minimo giornaliero entreranno tanti volumi in breve tempo, sia per assorbimento: buyers o sellers entrano in massa seguendo il trend quando è troppo tardi; sia per esaurimento: buyers o sellers entrati in massa e in ritardo non hanno più forza per continuare a spingere il prezzo, causano un picco volumetrico per comprare/vendere più che potevano, quindi i loro nemici prendono il sopravvento formando un massimo/minimo).
Buon trading a tutti! :)

Nef33-Volume Footprint ApproximationDescription of the "Volume Footprint Approximation" Indicator
Purpose
The "Volume Footprint Approximation" indicator is a tool designed to assist traders in analyzing market volume dynamics and anticipating potential trend changes in price. It is inspired by the concept of a volume footprint chart, which visualizes the distribution of trading volume across different price levels. However, since TradingView does not provide detailed intrabar data for all users, this indicator approximates the behavior of a footprint chart by using available volume and price data (open, close, volume) to classify volume as buy or sell, calculate volume delta, detect imbalances, and generate trend change signals.
The indicator is particularly useful for identifying areas of high buying or selling activity, imbalances between supply and demand, delta divergences, and potential reversal points in the market. It provides specific signals for bullish and bearish trend changes, making it suitable for traders looking to trade reversals or confirm trends.
How It Works
The indicator uses volume and price data from each candlestick to perform the following calculations:
Volume Classification:
Classifies the volume of each candlestick as "buy" or "sell" based on price movement:
If the closing price is higher than the opening price (close > open), the volume is classified as "buy."
If the closing price is lower than the opening price (close < open), the volume is classified as "sell."
If the closing price equals the opening price (close == open), it compares with the previous close to determine the direction:
If the current close is higher than the previous close, it is classified as "buy."
If the current close is lower than the previous close, it is classified as "sell."
If the current close equals the previous close, the classification from the previous bar is used.
Delta Calculation:
Calculates the volume delta as the difference between buy volume and sell volume (buyVolume - sellVolume).
A positive delta indicates more buy volume; a negative delta indicates more sell volume.
Imbalance Detection:
Identifies imbalances between buy and sell volume:
A buy imbalance occurs when buy volume exceeds sell volume by a defined percentage (default is 300%).
A sell imbalance occurs when sell volume exceeds buy volume by the same percentage.
Delta Divergence Detection:
Positive Delta Divergence: Occurs when the price is falling (for at least 2 bars) but the delta is increasing or becomes positive, indicating that buyers are entering despite the price decline.
Negative Delta Divergence: Occurs when the price is rising (for at least 2 bars) but the delta is decreasing or becomes negative, indicating that sellers are entering despite the price increase.
Trend Change Signals:
Bullish Signal (trendChangeBullish): Generated when the following conditions are met:
There is a positive delta divergence.
The delta has moved from a negative value (e.g., -500) to a positive value (e.g., +200) over the last 3 bars.
There is a buy imbalance.
The price is near a historical support level (approximated as the lowest low of the last 50 bars).
Bearish Signal (trendChangeBearish): Generated when the following conditions are met:
There is a negative delta divergence.
The delta has moved from a positive value (e.g., +500) to a negative value (e.g., -200) over the last 3 bars.
There is a sell imbalance.
The price is near a historical resistance level (approximated as the highest high of the last 50 bars).
Visual Elements
The indicator is displayed in a separate panel below the price chart (overlay=false) and includes the following elements:
Volume Histograms:
Buy Volume: Represented by a green histogram. Shows the volume classified as "buy."
Sell Volume: Represented by a red histogram. Shows the volume classified as "sell."
Note: The histograms overlap, and the last plotted histogram (red) takes visual precedence, meaning the sell volume may cover the buy volume if it is larger.
Delta Line:
Delta Volume: Represented by a blue line. Shows the difference between buy and sell volume.
A line above zero indicates more buy volume; a line below zero indicates more sell volume.
A dashed gray horizontal line marks the zero level for easier interpretation.
Imbalance Backgrounds:
Buy Imbalance: Light green background when buy volume exceeds sell volume by the defined percentage.
Sell Imbalance: Light red background when sell volume exceeds buy volume by the defined percentage.
Divergence Backgrounds:
Positive Delta Divergence: Lime green background when a positive delta divergence is detected.
Negative Delta Divergence: Fuchsia background when a negative delta divergence is detected.
Trend Change Signals:
Bullish Signal: Green label with the text "Bullish Trend Change" when the conditions for a bullish trend change are met.
Bearish Signal: Red label with the text "Bearish Trend Change" when the conditions for a bearish trend change are met.
Information Labels:
Below each bar, a label displays:
Total Vol: The total volume of the bar.
Delta: The delta volume value.
Alerts
The indicator generates the following alerts:
Positive Delta Divergence: "Positive Delta Divergence Detected! Price is falling, but delta is increasing."
Negative Delta Divergence: "Negative Delta Divergence Detected! Price is rising, but delta is decreasing."
Bullish Trend Change Signal: "Bullish Trend Change Signal! Positive Delta Divergence, Delta Rise, Buy Imbalance, and Near Support."
Bearish Trend Change Signal: "Bearish Trend Change Signal! Negative Delta Divergence, Delta Drop, Sell Imbalance, and Near Resistance."
These alerts can be configured in TradingView to receive real-time notifications.
Adjustable Parameters
The indicator allows customization of the following parameters:
Imbalance Threshold (%): The percentage required to detect an imbalance between buy and sell volume (default is 300%).
Lookback Period for Divergence: Number of bars to look back for detecting price and delta trends (default is 2 bars).
Support/Resistance Lookback Period: Number of bars to look back for identifying historical support and resistance levels (default is 50 bars).
Delta High Threshold (Bearish): Minimum delta value 2 bars ago for the bearish signal (default is +500).
Delta Low Threshold (Bearish): Maximum delta value in the current bar for the bearish signal (default is -200).
Delta Low Threshold (Bullish): Maximum delta value 2 bars ago for the bullish signal (default is -500).
Delta High Threshold (Bullish): Minimum delta value in the current bar for the bullish signal (default is +200).
Practical Use
The indicator is useful for the following purposes:
Identifying Trend Changes:
The trend change signals (trendChangeBullish and trendChangeBearish) indicate potential price reversals. For example, a bullish signal near a support level may be an opportunity to enter a long position.
Detecting Divergences:
Delta divergences (positive and negative) can anticipate trend changes by showing a disagreement between price movement and underlying buying/selling pressure.
Finding Key Levels:
Imbalances (green and red backgrounds) often coincide with support and resistance levels, helping to identify areas where the market might react.
Confirming Trends:
A consistently positive delta in an uptrend or a negative delta in a downtrend can confirm the strength of the trend.
Identifying Failed Auctions:
Although not detected automatically, you can manually identify failed auctions by observing a price move to new highs/lows with decreasing volume in the direction of the move.
Limitations
Intrabar Data: It does not use detailed intrabar data, making it less precise than a native footprint chart.
Approximations: Volume classification and support/resistance detection are approximations, which may lead to false signals.
Volume Dependency: It requires reliable volume data, so it may be less effective on assets with inaccurate volume data (e.g., some forex pairs).
False Signals: Divergences and imbalances do not always indicate a trend change, especially in strongly trending markets.
Recommendations
Combine with Other Indicators: Use tools like RSI, MACD, support/resistance levels, or candlestick patterns to confirm signals.
Trade on Higher Timeframes: Signals are more reliable on higher timeframes like 1-hour or 4-hour charts.
Perform Backtesting: Evaluate the indicator's accuracy on historical data to adjust parameters and improve effectiveness.
Adjust Parameters: Modify thresholds (e.g., imbalanceThreshold or supportResistanceLookback) based on the asset and timeframe you are trading.
Conclusion
The "Volume Footprint Approximation" indicator is a powerful tool for analyzing volume dynamics and anticipating price trend changes. By classifying volume, calculating delta, detecting imbalances and divergences, and generating trend change signals, it provides traders with valuable insights into market buying and selling pressure. While it has limitations due to the lack of intrabar data, it can be highly effective when used in combination with other technical analysis tools and on assets with reliable volume data.

Ragi's 24h volumeThis script is a TradingView Pine Script indicator that displays the 24-hour trading volume for a given asset. It provides both the native volume of the asset and, if the asset is not already listed on Binance, also displays the 24-hour volume from Binance (if applicable). Here's a breakdown of the key components:
Volume Calculation:
It sums the volume data over different time frames: 1-minute, 5-minute (for daily charts), or 60-minute intervals.
The volume is calculated based on the asset's volume type (either "quote" volume or a calculated value of close * volume).
For crypto assets, if the volume data is unavailable, it raises an error.
Binance Volume:
If the asset is not from Binance, the script fetches 24-hour volume data from Binance for that symbol, ensuring it is using the correct currency rate.
Display:
The indicator displays a table with the 24-hour volume in the chosen position on the chart (top, middle, or bottom).
The table displays the current exchange's volume, and if applicable, the Binance volume.
The volume is color-coded based on predefined thresholds:
Attention: Displays a warning color for volumes exceeding the attention level.
Warning: Shows an alert color for volumes above the warning threshold.
Normal: Displays in standard color when the volume is lower than the warning level.
The text and background color are customizable, and users can adjust the text size and position of the table.
User Inputs:
The script allows customization of table text size, position, background color, and volume thresholds for attention and warning.
In summary, this indicator is designed to track and display 24-hour volume on a chart, with additional volume information from Binance if necessary, and provides visual cues based on volume levels to help traders quickly assess trading activity.
(Optimized) Volume Based Colored Bars Volume Based Colored Bars (VCB)
This indicator analyzes the relationship between price action and volume to provide visual cues for traders. It colors the price bars based on whether the bar's volume is high, medium, or low relative to the moving average of volume. Additionally, it distinguishes between bullish (price closed higher than it opened) and bearish (price closed lower than it opened) bars, offering a quick and intuitive way to assess market sentiment and activity.
Key Features:
Volume Classification:
High Volume: Volume is greater than 1.5 times the moving average.
Medium Volume: Volume is between 0.5 and 1.5 times the moving average.
Low Volume: Volume is less than 0.5 times the moving average.
Price Action Analysis:
Bullish Bars: Bars where the closing price is higher than the opening price.
Bearish Bars: Bars where the closing price is lower than the opening price.
Bar Colors:
Bearish High Volume: Dark red.
Bearish Medium Volume: Red.
Bearish Low Volume: Orange.
Bullish High Volume: Dark green.
Bullish Medium Volume: Lime green.
Bullish Low Volume: Aquamarine.
This indicator helps traders quickly identify when price movements are supported by significant volume, offering potential insights into market strength or weakness. Ideal for both novice and experienced traders looking for an edge in their analysis.

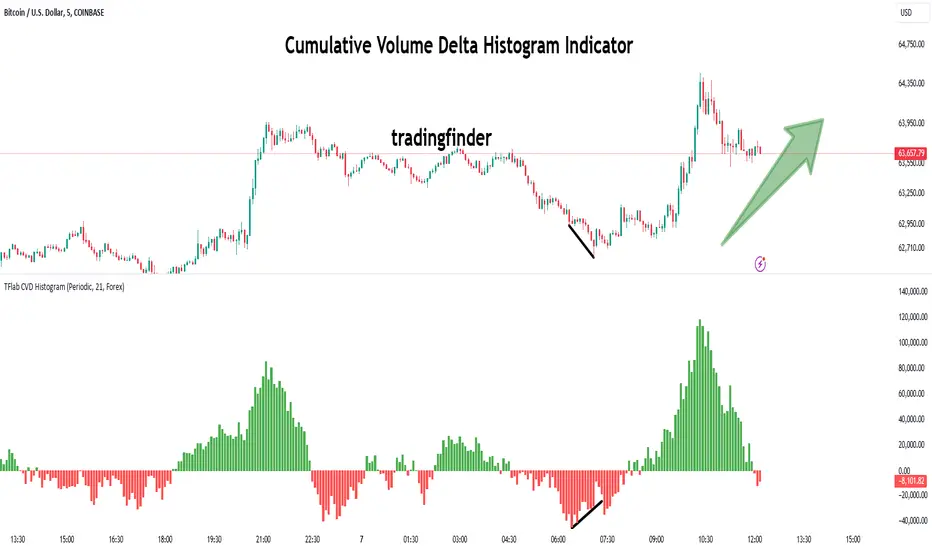
Cumulative Delta [TradingFinder] Volume + Periodic + EMA🔵 Introduction
To fully grasp the concept of Cumulative Volume Delta (CVD), it's essential first to understand Volume Delta. In trading and technical analysis, the term "Delta" typically refers to the difference between two values or the rate of change between two data points.
Volume Delta represents the difference between buying and selling pressure, calculated for each candlestick on a chart. This difference can vary across different timeframes.
A positive delta indicates that buying volume exceeds selling volume, while a negative delta shows that selling volume is greater. When buying and selling volumes are equal, the volume delta equals zero.
🟣 What is Cumulative Volume Delta (CVD)?
Cumulative Volume Delta (CVD) is a powerful tool in technical analysis that aggregates delta values for each candlestick, creating a comprehensive indicator that helps traders assess market trends.
Unlike the standard Volume Delta, which compares delta on a candle-by-candle basis, CVD provides insight into the overall buying and selling pressure during key market swings. A downward-trending CVD suggests that selling pressure is dominating, which is typically a bearish signal.
Conversely, an upward-trending CVD indicates bullish sentiment. This analysis becomes even more significant when comparing CVD with price action and market structure, helping traders to predict asset price directions.
By evaluating market highs and lows, one can determine the market trend. A consistent rise in these points indicates an uptrend, while a consistent fall suggests a downtrend.
🔵 How to Use
Understanding how to detect trend changes using Cumulative Volume Delta is crucial for traders. Typically, CVD aligns with market structure, moving in the same direction as price trends.
However, divergences between CVD and price trends or signs of exhaustion in volume can be powerful indicators of potential market reversals. Recognizing these patterns can help traders make informed decisions and improve their trading strategies.
🟣 Identifying Trend Exhaustion with Cumulative Volume Delta (CVD)
The Cumulative Volume Delta (CVD) indicator is especially effective in identifying weakening trends in the market. For instance, if gold's price hits a new low, but CVD does not follow suit, this may indicate a lack of seller interest despite the new low, signaling potential seller exhaustion.
Most traders interpret this as a possible reversal from a bearish to a bullish trend. Similarly, if gold reaches a new high but CVD fails to do the same, it can suggest that buyers lack the strength to push the market higher, indicating a possible trend reversal.
🟣 Utilizing Cumulative Volume Delta (CVD) Divergence in Price Trend Analysis
Another effective use of CVD is identifying divergences in price trends. For example, if CVD breaks a previous high or low while the price remains stable, this divergence often indicates that buying or selling pressure is being absorbed.
For instance, if CVD rises sharply without a corresponding increase in gold prices, it may suggest that sellers are absorbing the buying pressure, potentially leading to a strong sell-off. Conversely, if gold prices remain stable while CVD declines, it could indicate that buyers are absorbing selling pressure, likely leading to a price increase once selling subsides.
🔵 Setting
Cumulative Mode : It has three modes "Total", "Periodic" and "EMA". In "Total" mode, it collects the volume from the beginning to the end. In "Periodic" mode, it accumulates the volume periodically and in "EMA" mode, it calculates the moving average of the volume.
Period : You can set the period of " Periodic " and " EMA " modes.
Market Ultra Data : If you turn on this feature, 26 large brokers will be included in the calculation of the trading volume.
The advantage of this capability is to have more reliable volume data. You should be careful to specify the market you are in, FOREX brokers and Crypto brokers are different.
🔵 Conclusion
Cumulative Volume Delta (CVD) is a powerful analytical tool in financial markets that helps analysts and traders assess buying and selling pressure by aggregating and combining the volume delta for each candlestick.
CVD can indicate the strength or weakness of a market trend. When CVD moves upward, it signals that buying pressure is dominant and is considered a bullish signal; conversely, a downward movement in CVD indicates that selling pressure is stronger and is viewed as a bearish signal.
This indicator is particularly effective in identifying divergences and exhaustion in market trends. For example, if CVD does not align with price movements, it may suggest a potential trend reversal.
Traders use this information to make more informed trading decisions, especially when identifying entry and exit points in the market.
Overall, CVD is a tool that enables analysts to better understand market fluctuations and more accurately predict future market trends.

Advanced Real-Time Volume Delta// -----------------------------------------------------------------------------
// Advanced Real-Time Volume Delta Indicator
// Developed by ThomasTradingAlgo
// -----------------------------------------------------------------------------
// DESCRIPTION:
// This script calculates and displays various volume-related metrics in real-time
// to help traders analyze buying and selling pressure in the market. It includes
// features such as volume delta, cumulative delta, volume delta pace, and price-volume
// delta relationship. This script also highlights High Volume Nodes (HVNs) and Low
// Volume Nodes (LVNs) and allows users to customize various display options.
// USAGE:
// 1. Add this script to your TradingView chart by copying and pasting the code into
// a new Pine Script indicator.
// 2. Customize the input parameters to suit your analysis needs:
// - Timeframe: Select the timeframe for analysis.
// - Mode: Choose between "Up/Down/Neutral" or "Up/Down" to consider neutral volume.
// - Show Split: Display the split of buy, sell, and neutral volumes separately.
// - Show Start Line: Display a line indicating where real-time data starts.
// - Show MA: Display a moving average of volume.
// - MA Period: Set the period for the volume moving average.
// - Show Net Delta Vol Above Bar: Display the net delta volume above the bar.
// - Show Cumulative Delta: Display the cumulative delta volume.
// - Scale Down Factor: Scale down the net delta value for better readability.
// - Highlight Threshold: Highlight bars based on a threshold of average volume.
// - Show Buying/Selling Pressure in Candlestick: Show buying and selling pressure
// directly in the candlestick.
// - HVN Threshold: Set the threshold for High Volume Nodes based on average volume.
// - LVN Threshold: Set the threshold for Low Volume Nodes based on average volume.
// 3. Interpret the volume metrics displayed in the table and on the chart to make
// informed trading decisions.
// HELPFUL TIPS:
// - Use the "Volume Delta" metric to gauge the difference between buying and selling
// pressure in real-time.
// - The "Cumulative Delta" helps track the overall buying or selling pressure over time.
// - "Delta Pace" indicates the speed at which volume delta changes, which can signal
// strong buying or selling pressure.
// - Analyze the "Price-Delta Relationship" to understand potential reversals or trend
// continuations. For instance, if the price is rising but delta is falling, it could
// suggest weakening buying pressure and a potential reversal.
// - Pay attention to HVNs and LVNs, as they can indicate significant support or resistance
// levels based on volume concentration.

Price Range Volume Profile++ [Pt]█ Introduction
The Price Range Volume Profile++ (PRVP++) is an advanced, feature-rich indicator specifically designed for volume profile users for in-depth volume analysis. Unlike most other volume profile tools that are limited to a 5000-bar lookback, PRVP++ can utilize all available candles on the chart, offering an unparalleled scope of historical data analysis.
█ Main Features
Full Chart Historical Lookback : PRVP++ sets a new standard with its ability to analyze the entire history of candles available on a chart, far exceeding the typical 5000-bar limit of other tools. This feature allows traders to conduct a comprehensive and detailed study of volume data over extensive time periods.
Volume Profile Analysis : The tool provides an in-depth volume profile analysis, showcasing the distribution of trading activity across different price levels. This is crucial for identifying key areas of interest in the market.
Bull/Bear Strength Profile : A standout feature that displays the relative strength of buyers (bulls) and sellers (bears) at different price levels. This visual representation helps traders gauge market sentiment and power dynamics.
Automatic HVN and LVN Identification : PRVP++ automatically highlights High Volume Nodes (HVNs) and Low Volume Nodes (LVNs), making it easier for traders to identify significant zones of trading activity and potential breakout areas.
Customization and Visual Enhancements : Offers customization for the profile's width, horizontal offset, and a sophisticated gradient color scheme for HVNs and LVNs, enhancing the tool's visual appeal and analytical utility.
█ Input Parameters
Price Range : Sets the percentage distance for the volume profile relative to the current closing price, determining the extent of volume data analysis.
Profile Step Size (Tick Size) : Users can choose automatic sizing or set a specific tick step size, offering flexibility in the granularity of the volume profile.
Volume Profile Options : Includes settings for gradient power and color selections for high and low volume areas, along with a fun mode for random color variations.
Profile Placement and Appearance : Adjustments for profile width, horizontal offset, and the option for background fill to enhance visibility.
Background Fill : Allows users to fill the background of the volume profile range, enhancing the visual impact and readability.
Time Weighted Profile : An option that weights the volume profile to give more emphasis to recent trading activities, highlighting the impact of recent market movements.
Smooth Filter : A feature that smoothens the volume profile to reduce noise and fluctuations, offering a clearer view of dominant volume levels.
High and Low Volume Node Settings : Customizable detection settings for HVNs and LVNs, line styles, label text sizes, and the option to extend lines for clearer market analysis.
Extra Settings : Includes displaying the current price on the profile, a customizable settings table with adjustable location and font size, and table opacity.
Random Color Generation : A feature for dynamically changing the colors used in the volume profile.
█ Possible Use Cases
Long-Term Market Analysis : Due to its ability to analyze all available candles on the chart, PRVP++ is exceptionally suited for long-term market analysis. Traders can study the historical volume profile over extended periods, identifying significant volume trends and shifts that could impact long-term investment strategies.
Identifying Key Support and Resistance Levels : The automatic HVN and LVN identification feature of PRVP++ makes it easier for traders to spot potential support and resistance levels. HVNs often correspond to strong support or resistance zones where significant trading activity has occurred, while LVNs may indicate levels where the price could break through more easily.
Gauging Market Sentiment with Bull/Bear Strength Profile : The Bull/Bear Strength Profile helps traders understand the prevailing market sentiment at different price levels. By analyzing the dominance of buying or selling pressure, traders can align their trades with the market's direction or prepare for potential reversals.
Intraday Trading and Scalping : For intraday traders and scalpers, the time-weighted feature and the ability to adjust profile step size offer valuable insights. By emphasizing recent trading activity and adjusting the granularity of the profile, traders can make more informed decisions based on short-term price movements and volume changes.
Breakout Trading : By utilizing the LVN identification, traders can pinpoint areas with low trading activity that might serve as potential breakout points. This information can be instrumental in formulating strategies to capitalize on sudden price movements.
Volume Gap Analysis : PRVP++ can be used to identify volume gaps, which are areas with significantly low volume. These gaps can act as important indicators for price movements, as prices may move quickly through these levels due to the lack of historical trading activity.
Risk Management and Position Sizing : Understanding the volume profile can aid in better risk management and position sizing. By recognizing areas of high and low volume, traders can set stop-loss orders more effectively and adjust their position sizes according to the perceived strength of support or resistance levels.
Swing Trading : For swing traders, the comprehensive historical lookback and HVN/LVN analysis provide critical information about where to enter and exit trades. Swing traders can utilize these features to identify trend reversals and momentum shifts.
█ Best Practices and Tips
Start with a Clear Understanding : Before utilizing PRVP++, ensure you have a solid grasp of volume profile concepts. Understanding High Volume Nodes (HVNs), Low Volume Nodes (LVNs), and their implications on market behavior is crucial.
Combine with Other Analysis Tools : While PRVP++ is powerful, it's most effective when used in conjunction with other technical analysis tools and indicators. Combining volume profile data with price action analysis, trend lines, and technical indicators can provide a more comprehensive market view.
Customize According to Your Trading Style : Tailor the tool's settings to fit your trading strategy. Day traders might prefer a more detailed profile, while long-term investors may benefit from broader data analysis.
Pay Attention to HVNs and LVNs : HVNs can indicate potential support or resistance areas, while LVNs might suggest breakout points. Monitor these areas closely for trading opportunities.
Utilize the Full Historical Lookback Feature : For a broader perspective, use the full historical lookback feature to understand long-term volume patterns and their impact on current price movements.
Keep an Eye on Bull/Bear Strength : Use the Bull/Bear Strength Profile to gauge market sentiment at different price levels. This can help in predicting potential price movements.
Regularly Update Your Strategy : As market conditions change, regularly review and adjust your use of PRVP++ to ensure it aligns with current market dynamics.
Stay Informed About Market News : Be aware of how economic news and global events might affect the volume and price, as these factors can significantly impact the effectiveness of volume-based strategies.
█ Disclaimers and Risk Advice
No Guarantee of Profits : Trading involves risk, and the use of the PRVP++ tool does not guarantee profits. Always be aware of the potential for loss.
Educational Purposes Only : The information provided by PRVP++ is for educational purposes only and should not be considered financial advice.
Not a Standalone Tool : PRVP++ should not be used as a standalone decision-making tool. Combine it with comprehensive market analysis and personal judgment.
Past Performance Not Indicative of Future Results [/b: Historical data and trends analyzed by PRVP++ do not guarantee future market behavior.
Use Risk Management : Always employ sound risk management strategies, including setting stop-loss orders and managing position sizes to protect your capital.
Personal Responsibility : Trading decisions remain the responsibility of the individual trader. Use PRVP++ as one of several tools in your decision-making process.

Volume Based RSI with ADXThe RSI indicator is a powerful tool that utilizes both volume and time to determine market trends. When there is a low volume of trades in a short period of time, but the trading activity is high, it is considered bullish or bearish. In the case of a bullish trend, the RSI indicator will display a green color, while a bearish trend will be represented by a red color. If there is no trading activity, the indicator will display a gray color. Additionally, if the ADX level meets the threshold level, the indicator will display a blue color. However, if the ADX level does not meet the threshold level, the indicator will revert back to displaying a gray color.

Volume Profile (Maps) [LuxAlgo]The Pine Script® developers have unleashed "maps"!
Volume Profile (Maps) displays volume, associated with price, above and below the latest price, by using maps
The largest and second-largest volume is highlighted.
🔶 USAGE
The proposed script can highlight more frequent closing prices/prices with the highest volume, potentially highlighting more liquid areas. The prices with the highest associated volume (in red and orange in the indicator) can eventually be used as support/resistance levels.
Voids within the volume profile can highlight large price displacements (volatile variations).
🔶 CONCEPTS
🔹 Maps
A map object is a collection that consists of key - value pairs
Each key is unique and can only appear once. When adding a new value with a key that the map already contains, that value replaces the old value associated with the key .
You can change the value of a particular key though, for example adding volume (value) at the same price (key), the latter technique is used in this script.
Volume is added to the map, associated with a particular price (default close, can be set at high, low, open,...)
When the map already contains the same price (key), the value (volume) is added to the existing volume at the associated price.
A map can contain maximum 50K values, which is more than enough to hold 20K bars (Basic 5K - Premium plan 20K), so the whole history can be put into a map.
🔹 Visible line/box limit
We can only display maximum 500 line.new() though.
The code locates the current (last) close, and displays volume values around this price, using lines, for example 250 lines above and 250 lines below current price.
If one side contains fewer values, the other side can show more lines, taking the maximum out of the 500 visible line limitation.
Example (max. 500 lines visible)
• 100 values below close
• 2000 values above close
-> 100 values will be displayed below close
-> 400 remaining -> 400 values will be displayed above close
Pushing the limits even further, when ' Amount of bars ' is set higher than 500, boxes - box.new() - will be used as well.
These have a limit of 500 as well, bringing the total limit to 1000.
Note that there are visual differences when boxes overlap against lines.
If this is confusing, please keep ' Amount of bars ' at max. 500 (then only lines will be used).
🔹 Rounding function
This publication contains 2 round functions, which can be used to widen the Volume Profile
Round
• "Round" set at zero -> nothing changes to the source number
• "Round" set below zero -> x digit(s) after the decimal point, starting from the right side, and rounded.
• "Round" set above zero -> x digit(s) before the decimal point, starting from the right side, and rounded.
Example: 123456.789
0->123456.789
1->123456.79
2->123456.8
3->123457
-1->123460
-2->123500
Step
Another option is custom steps.
After setting "Round" to "Step", choose the desired steps in price,
Examples
• 2 -> 1234.00, 1236.00, 1238.00, 1240.00
• 5 -> 1230.00, 1235.00, 1240.00, 1245.00
• 100 -> 1200.00, 1300.00, 1400.00, 1500.00
• 0.05 -> 1234.00, 1234.05, 1234.10, 1234.15
•••
🔶 FEATURES
🔹 Adjust position & width
🔹 Table
The table shows the details:
• Size originalMap : amount of elements in original map
• # higher: amount of elements, higher than last "close" (source)
• index "close" : index of last "close" (source), or # element, lower than source
• Size newMap : amount of elements in new map (used for display lines)
• # higher : amount of elements in newMap, higher than last "close" (source)
• # lower : amount of elements in newMap, lower than last "close" (source)
🔹 Volume * currency
Let's take as example BTCUSD, relative to USD, 10 volume at a price of 100 BTCUSD will be very different than 10 volume at a price of 30000 (1K vs. 300K)
If you want volume to be associated with USD, enable Volume * currency . Volume will then be multiplied by the price:
• 10 volume, 1 BTC = 100 -> 1000
• 10 volume, 1 BTC = 30K -> 300K
Disabled
Enabled
🔶 DETAILS
🔹 Put
When the map doesn't contain a price, it will be added, using map.put(id, key, value)
In our code:
map.put(originalMap, price, volume)
or
originalMap.put(price, volume)
A key (price) is now associated with a value (volume) -> key : value
Since all keys are unique, we don't have to know its position to extract the value, we just need to know the key -> map.get(id, key)
We use map.get() when a certain key already exists in the map, and we want to add volume with that value.
if originalMap.contains(price)
originalMap.put(price, originalMap.get(price) + volume)
-> At the last bar, all prices (source) are now associated with volume.
🔹 Copy & sort
Next, every key of the map is copied and sorted (array of keys), after which the index (idx) is retrieved of last (current) price.
copyK = originalMap.keys().copy()
copyK.sort()
idx = copyK.binary_search_leftmost(src)
Then left and right side of idx is investigated to show a maximum amount of lines at both sides of last price.
🔹 New map & display
The keys (from sorted array of copied keys) that will be displayed are put in a new map, with the associated volume values from the original map.
newMap = map.new()
🔹 Re-cap
• put in original amp (price key, volume value)
• copy & sort
• find index of last price
• fetch relevant keys left/right from that index
• put keys in new map and fetch volume associated with these keys (from original map)
Simple example (only show 5 lines)
bar 0, price = 2, volume = 23
bar 1, price = 4, volume = 3
bar 2, price = 8, volume = 21
bar 3, price = 6, volume = 7
bar 4, price = 9, volume = 13
bar 5, price = 5, volume = 85
bar 6, price = 3, volume = 13
bar 7, price = 1, volume = 4
bar 8, price = 7, volume = 9
Original map:
Copied keys array:
Sorted:
-> 5 keys around last price (7) are fetched (5, 6, 7, 8, 9)
-> keys are placed into new map + volume values from original map
Lastly, these values are displayed.
🔶 SETTINGS
Source : Set source of choice; default close , can be set as high , low , open , ...
Volume & currency : Enable to multiply volume with price (see Features )
Amount of bars : Set amount of bars which you want to include in the Volume Profile
Max lines : maximum 1000 (if you want to use only lines, and no boxes -> max. 500, see Concepts )
🔹 Round -> ' Round/Step '
Round -> see Concepts
Step -> see Concepts
🔹 Display Volume Profile
Offset: shifts the Volume Profile (max. 500 bars to the right of last bar, see Features )
Max width Volume Profile: largest volume will be x bars wide, the rest is displayed as a ratio against largest volume (see Features )
Show table : Show details (see Features )
🔶 LIMITATIONS
• Lines won't go further than first bar (coded).
• The Volume Profile can be placed maximum 500 bar to the right of last price.
• Maximum 500 lines/boxes can be displayed

Aggregated Volume Spot & Futures ⚉ OVERVIEW ⚉
The indicator presents a comprehensive approach to Aggregated Volume Data . Works on almost all CRYPTO Tickers!
The script also includes several input parameters that allow the user to control which exchanges and currencies are included in the aggregated data.
This script allows the user to choose from several data display modes, including volume, spot & perp, delta, cumulative delta, and others.
The user can also choose how volume is displayed (in assets, U.S. dollars or euros) and how it is calculated (sum, average, median, or dispersion).
WARNING Indicator is for CRYPTO ONLY.
______________________
⚉ SETTINGS ⚉
‾‾‾‾‾‾‾‾‾‾‾‾‾‾‾‾‾‾‾‾‾‾
Mode — Choose Mode.
• Volume — This displays the Volume
• Volume (Colored) — Shows aggregated volume but applying different volume colors for different exchanges.
• Delta — This displays the difference between the number of sellers and buyers.
• Cumulative Delta — This displays the cumulative delta between sellers and buyers.
• Spot & Perp — Shows Spot and Futures volume at the same time.
• Delta (Spot - Perp) — Shows the difference between Spot and Futures Volume.
• Liquidations — Displays Potential Liquidations. (Calculated between the difference in volume between Futures and Spots)
• OBV — On Balance Volume.
• MFI — Money Flow Indicator.
• Data Type — Choose Single or Aggregated data.
• Single — Show only current Volume.
• Aggregated — Show Aggregated Volume.
Volume By — You can also select how the volume is displayed.
• COIN — Volume in Actives.
• USD — Volume in United Stated Dollar.
• EUR — Volume in European Union.
• RUB — Volume in Russian Ruble.
Calculate By — Choose how Aggregated Volume it is calculated.
• SUM — This displays the total volume from all sources.
• AVG — This displays the average price of the volume from all sources.
• MEDIAN — This displays the median volume from all sources.
• VARIANCE — This displays the variance of the volume from all sources.
* 🡅 Be Careful, Reacts to Every Mode.
Additional features
• Show MA — Show Movieng Average of Volume.
• MA Period — Period of MA.
• Lookback — Lookback period for 'Cumulative Delta' and for 'MFI'.
• Liquidation Filter — Filters out small or negative difference values.
• Show Table — Table shows the current volume of the last candle. Also in the Mode "Colored" shows the color of exchanges if they have volume.
________________
⚉ NOTES ⚉
‾‾‾‾‾‾‾‾‾‾‾‾‾‾‾‾
I don't pretend to be the best choice for calculating CVD , Delta and Liquidations, the calculations are chosen to be optimal from what I have seen and know.
If you have any ideas what to add to my work to add more sources or make calculations cooler, suggest in DM .

Real Relative Volume - Bar Indicator - Time Adjusted - DE & ENEnglish version below
Die richtige Aktie zu finden, ist nich immer einfach. Eine wichtige Variable bei der Aktienauswahl stellt das relative Volumen dar, welches von vielen erfolgreichen Tradern und Trading Firmen benutzt wird. Stell es Dir so vor: Statt sich das absolute Volumen anzuschauen, schauen wir uns die tatsächliche Stärke an. Wie viel Volumen wird also heute im Vergleich zu einem regulären Tag gehandelt. Dies gibt Aufschluss darüber, ob die Aktie "In-Play" ist.
Merke: Ist das RVOL (Relative Volumen) erhöht, sind mehr Marktteilnehmer an dieser Aktie interessiert als üblich. Dies ist besonders dann wichtig, wenn die Marktrichtung und die Richtung der Aktie nicht übereinstimmen.
Wenn der Markt steigt, steigen auch die meisten Aktien. Dies kann folglich auch ohne erhöhtes RVOL passieren. Was ist aber, wenn der Markt gegen uns geht? Dann werden wir schnell bei RVOL-schwachen Aktien ausgeschüttelt. Daher wollen wir unseren Fokus immer auf Aktien setzen, die ein erhöhtes relatives Volumen haben! Dies sind die Aktien, die gerade wirklich stark gehandelt werden und wahrscheinlich einen Katalysten dafür haben.
Der Real Relative Volume - Bar Indicator zeigt Dir das aktuelle relative Volumen an. Unser Algo benutzt dabei das tatsächliche kumulative Volumen des aktuellen Tages zum jeweiligen (aktuellen) Zeitpunkt und vergleicht dieses mit dem historischen Durchschnittsvolumen zum gleichen Zeitpunkt. Damit bekommen wir ein korrektes Abbild der aktuellen Stärke. Mit Hilfe des Indikators können wir durch die farbliche Veränderung der Volumenbalken ebenfalls sehen, ob diese Stärke zunimmt, gleich bleibt, oder gegebenenfalls schnell and Power verliert. Im Gegensatz zu anderen Skripten nutzen wir eine fortschrittliche Methode, die aktuelle Position am Tag erkennt und damit nicht die Session in gleiche Teile teilt. Vorteil: Der Indikator funktioniert auch in Krypto, Forex, DE-Aktien, Indizes etc.
Funktionen:
Bitte ohne verlängerte Handelszeiten nutzen!
Sessions Back: Verändert die Baseline, die Du mit dem heutigen Volumen vergleichst. Beispiel: 10 - Zur aktuellen Uhrzeit siehst Du das reale relative Volumen von heute in Relation zu den letzten 10 Sessions (zur gleichen Zeit). (*max 5000 Kerzen)
RVOL Threshold: Wert für die RVOL Alarme sowie zur Färbung bei Nutzung des Modus Threshold.
Plot styles: Du hast die Möglichkeit aus 4 verschiedenen Styles zu wählen.
Heatmap (greift auf die Werte und Farben von HM1-HM5 zurück)
Traffic (greift auf die Werte und Farben von T1-T4 zurück) -
Threshold (greift auf den Werte RVOL Threshold zurück)
Kurs (zeigt die normalen Volumenbalken)
HM1-5: Stelle unterschiedliche RVOL Werte für den Plot Style Heatmap ein.
T1-4: Stelle unterschiedliche RVOL Werte für den Plot Style Traffic ein.
Dieser Indikator wird häufig mit unserer zweiten Version Real Relative Volume - Line Indicator - Time Adjusted - DE & EN verwendet. Stelle sicher, dass Du in beiden Indikatoren die gleichen RVOL Werte nutzt!
-------------
English version
Finding the right stock to trade is not always easy. An important variable in stock selection is the relative volume, which is used by many successful traders and trading firms. Think of it like this: Instead of looking at absolute volume, we look at actual strength. So how much volume is traded today compared to a regular day? This gives an indication of whether the stock is "in play".
Note: If the RVOL (relative volume) is increased, more market participants are interested in this share than usual. This is especially important if the market direction and the direction of the stock do not match.
If the market rises, most shares will also rise. This can, therefore, happen without an increased RVOL. But what happens if the market goes against us? Then we are quickly shaken out of RVOL-weak stocks. Therefore, we always want to focus on stocks that have an increased relative volume! These are the stocks that are trading really strongly right now and probably have a catalyst for that.
The Real Relative Volume - Bar Indicator shows you the current relative volume. Our Algo uses the actual cumulative volume of the current day at the respective (current) time and compares it with the historical average volume at the same time. This gives us a correct picture of the current strength. With the help of the indicator, we can also see by the color change of the volume bars whether this strength increases, remains the same, or loses power quickly. Unlike other scripts, we use an advanced method that recognizes the current position on the day and does not split the session into equal parts. Advantage: The indicator also works in crypto, forex, foreign stock markets, indices, etc.
Features:
Please use without extended trading hours!
Sessions Back: Changes the baseline that you compare to today's volume. Example: 10 - At the current time you see the real relative volume of today in relation to the last 10 sessions (at the same time). (*max 5000 candles)
RVOL Threshold: Value for the RVOL alarms as well as for coloring when using the Threshold mode.
Plot styles: You have the possibility to choose from 4 different styles.
Heatmap (uses the values and colors of HM1-HM5)
Traffic (uses the values and colors of T1-T4) -
Threshold (accesses the values RVOL Threshold)
Price (shows the normal volume bars)
HM1-5: Set different RVOL values for the Plot Style Heatmap
T1-4: Set different RVOL values for the Plot Style Traffic.
This indicator is often used with our second version Real Relative Volume - Line Indicator - Time Adjusted - DE & EN. Make sure that you use the same RVOL values in both indicators!

Bitfinex Spot vs Margin Volume - Multi-assetThe Bitfinex Spot vs Margin Volume - Multi-asset indicator was designed to help understanding how volume is composed between Spot and Margin transactions, considering all possible scenarios.
It provides valuable additional insight on how 'smarter money' is behaving in anticipation of possible upcoming moves, and can contribute to current analysis toolkits.
To request access, please send me a direct message.
Main features:
Spot vs. Margin insight for all margin-enabled Bitfinex pairs (dynamically detected from Chart).
Can be used on non-Bitfinex Charts which share same Ticker (eg. BTCUSD on Bitfinex or Bitstamp). Also dynamically detected.
Can be used in a separate pane (default) or added to main chart, as a standard volume indicator.
Shapes' meanings:
Colored bars represent scenario where maximum possible volume is attributed to Spot transactions (and its corresponding effect on Margin, if any).
Histograms (thin bars) represent scenario where maximum possible volume is attributed to Margin transactions (and its corresponding effect on Spot, if any).
When volume information leaves room for ambiguity, there will be a mismatch between maximums and minimums. Truth will be somewhere in the middle.
By default, Spot and Margin volumes are stacked up, as in traditional volume bar style.This can be disabled in Options - in which case Margin volumes are presented below zero line (this can facilitate some readings; see notes).
Standard volume for current chart's pair is presented in light gray, in the background. It helps seeing realtime volume and any surplus volume in relation to Bitfinex's.
Colors:
By default, Spot volume bars are colored in blue, but you can choose to use price closes to define them instead - as in traditional volume indicators.
You can also choose to invert Spot and Margin colors, so that Spot volumes are presented in higher contrast.
Margin volumes are, by default, colored based on whether Longs or Shorts were more relevant.
Direction attribution:
Default ratio threshold to define above-mentioned relevance is 1.1 (10%). (eg.: if Longs were greater than Shorts, Longs' volume must be at least 10% grater than Shorts' for direction of movement to be attributed to Longs). Direction then is defined based on winning side, plus whether openings or closings were dominant.
Threshold be configured from 1.01 to N. If ratio is below threshold, direction is considered neutral (yellow/orange colors).
Based on this assessment, label signals are presented at top area of chart, indicating whether opening(+) or closing(-) Longs or Shorts were the major responsibles for the move.
By default, to avoid much cluttering, labels are presented only for greater-than-average (ema 17) margin volumes. This can also be customized in Options.
Claim transactions:
Claim transactions are margin positions closed with traders' own existing assets being handed in to lenders. Thus, they do not impact order books -- and volume -- when executed.
Still, they are an additional, potentially valuable source of information, and the indicator is able to detect and report them.
Green triangle-like area shapes represent Longs closed with Claim transaction(s). Likewise, similar red shapes represent Shorts closed with Claim transactions.
This topic is explained in greater detail in this Bitfinex article .
Notes:
When using stacked up visualization, values in data window do not correspond to actual margin volumes. To see actual values, change to non-stacked up mode, and ignore negative sign.
The lower the time frame, the more precise it gets.
To request access, please send me a direct message.
For questions and feedbacks, please share them in comments section below.
Thank you, and best of success on your trades.

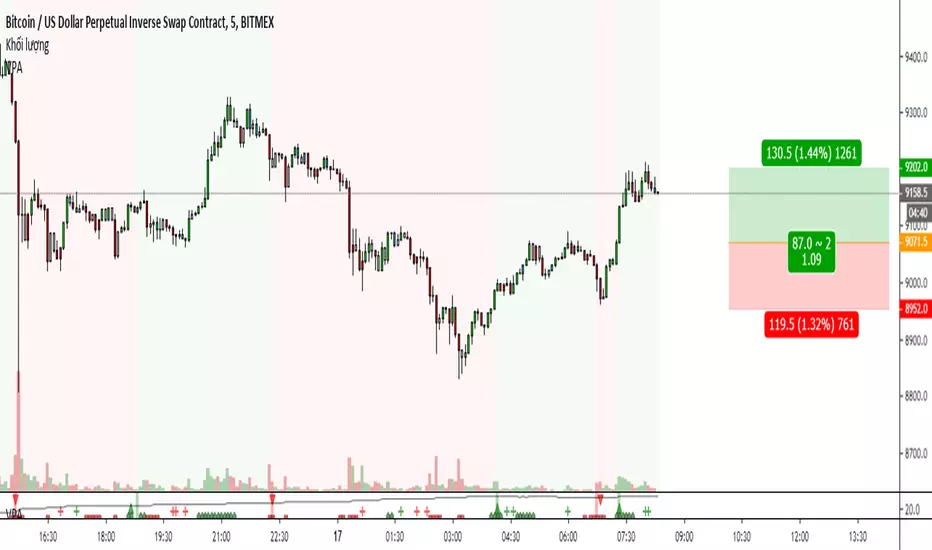
Volume Price Analysis Best indicator for volume price analysis:
-Trend detection
-Breakout detection
-Fakeout detection
Use pure candlestick chart and volume.
No need to use any other indicator.
You can feel about the battle between bulls and bears.
Read my book for more information!
Colored Volume Bars standard deviation from meanThe colour bars:
Green: Price up - Volume > 2 x STD of last 21 bars
Blue: Price up - Volume > 1 x STD of last 21 bars
Maroon: Price down - Volume > 2 x STD of last 21 bars
Purple: Price down - Volume > 1 x STD of last 21 bars
Grey: not high volume bar
Green line: 2 bar sma
Red line: 8 period sma of the greenline
Bollinger band: 55 period sma of the 21 period sma with bands 1.618 deviation from the mean

Volume Delta Candles 5TF + MTF Candles [SYNC & TRADE]Volume Delta Candles 5TF + MTF Candles Script Description (English)
Purpose
The Volume Delta Candles 5TF + MTF Candles script is an analytical tool for traders leveraging volume delta and multi-timeframe (MTF) analysis. It visualizes volume delta (the difference between buying and selling volumes) across five timeframes, aiding in the identification of manipulations, strong market impulses, and trend signals.
Additionally, it overlays higher timeframe candles on the current chart, providing context for decision-making.
The indicator is ideal for traders focusing on volume, manipulation analysis, or trend-following strategies. Its uniqueness lies in its detailed five-timeframe delta analysis, automated timeframe selection, and customizable settings.
Volume Delta Analysis
Volume delta is the core metric of the script, representing the difference between buying and selling volumes over a given period. It is divided into five levels, each corresponding to one of the five timeframes, enabling traders to observe how market activity varies across temporal scales. The primary delta is automatically adjusted based on the selected chart timeframe, ensuring relevance.
Timeframe Selection
Primary Timeframes: Automatically determined based on the chart, including monthly, weekly, daily, 4-hour, and hourly periods. These cover long- and medium-term trends, providing a robust context.
Lower Timeframes: Optimized to capture significant short-term movements. These are shorter than primary timeframes and focus on market micro-activity, such as manipulations or impulses.
Five Timeframe Interconnection
The five timeframes provide a comprehensive analysis by balancing granularity and context. Each timeframe evaluates volume delta, creating a layered perspective:
Short Timeframes: Capture immediate changes in activity (e.g., buying or selling spikes).
Long Timeframes: Assess the sustainability of movements, filtering out short-term noise. Delta for each timeframe is displayed as a separate candle, with color and size reflecting its magnitude and direction. This allows traders to compare short-term actions against broader trends.
Delta’s Impact on Candles
Volume delta directly influences candle visualization, reflecting market dynamics. Splitting delta into five parts (one per timeframe) makes the analysis intuitive. Key scenarios include:
Small Delta on Lower Timeframe, Large on Higher:
Description: A low timeframe shows minimal delta (e.g., slight buying/selling difference), while a higher timeframe shows significant delta (e.g., strong buying dominance).
Interpretation: Suggests large players accumulating positions on the higher timeframe, masked by low activity on the lower. Traders may enter in the direction of the higher trend.
Visualization: The lower timeframe candle is narrow and faint, while the higher timeframe candle is wide and vibrant (blue for positive delta, red for negative).
Large Delta on Lower Timeframe, Small on Higher:
Description: A low timeframe exhibits strong delta (e.g., a selling surge), but the higher timeframe shows weak activity.
Interpretation: Indicates a short-term impulse or manipulation unsupported by the broader trend. Traders should be cautious, as the move may be false.
Visualization: The lower timeframe candle is bright and wide, while the higher timeframe candle is faint and narrow.
Reverse Delta:
Description: A lower timeframe shows positive delta (buying dominance), while a higher timeframe shows negative delta (selling dominance), or vice versa.
Interpretation: Suggests potential manipulation or reversal. For example, short-term buying may be absorbed by selling on a higher timeframe, signaling bearish weakness.
Visualization: Candles on different timeframes have opposing colors (e.g., blue on lower, red on higher).
Deltas in Both Directions:
Description: Delta alternates between positive and negative across timeframes without clear dominance.
Interpretation: Reflects market indecision or consolidation. Traders should wait for clearer signals or use additional indicators.
Visualization: Candles across timeframes show mixed colors and sizes, creating a “scattered” pattern.
Empty Candles (Void):
Description: Delta on one or more timeframes is near zero despite price movement.
Interpretation: Indicates false movement or lack of market interest, often tied to manipulations like false breakouts.
Visualization: Marked with a diamond (void manipulation), with the candle appearing minimal and faint.
Utility
Detailed Delta Analysis: Five delta levels reveal market activity from micro- to macro-levels.
Manipulation Detection: Highlights candles with price-delta divergence, aiding in spotting false moves.
Strong Candles: Marks impulsive moves with high delta and volume.
MTF Analysis: Displays higher timeframe candles, simplifying trend and key level analysis.
Versatility: Sensitivity settings make it suitable for stocks, forex, crypto, and all timeframes.
How to Use
Adding to Chart:
Open TradingView and select an asset.
Find “Volume Delta Candles 5TF + MTF Candles ” in the “Indicators” menu.
Confirm access (invite-only script).
Interpreting Signals:
Delta Candles: Colored by delta direction (blue for positive, red for negative). Color intensity and candle size reflect delta strength across five timeframes.
Manipulations:
Triangles: Strong price-delta divergence.
Crosses: Weak divergence.
Diamonds: Void candles with minimal delta.
Strong Candles: Circles below/above candles indicate high-delta impulses.
MTF Candle: A transparent higher timeframe candle shows trend and range.
Trading Application:
Use manipulations to spot reversals or false breakouts.
Confirm impulses with strong candles and higher timeframe delta.
Analyze MTF candles for trend context.
Compare delta across all five timeframes to filter signals.
Combine with support/resistance or other indicators.
Settings
Parameters are grouped for ease of customization.
1. Labels
Show Manipulations: Display strong manipulation labels (triangles).
Show Void Manipulations: Show void manipulations (diamonds).
Show Delta Sandwich: Reserved for future updates.
Show Strong Candles: Display strong candles (circles).
2. Filters (Strong Candle Filter)
Filter Sensitivity: Filter sensitivity:
Normal: For stable markets.
Medium: For moderate volatility.
Sensitive: For high-frequency trading.
3. Delta Colors
Delta 1↑ (Main): Color for positive delta on the main timeframe.
Delta 1↓ (Main): Color for negative delta on the main timeframe.
Other timeframes use derived colors with varying opacity.
4. Timeframes
Timeframe Sensitivity: Sensitivity for lower timeframes:
Normal: Standard division.
Medium: More detailed analysis.
Sensitive: Maximum detail.
5. MTF Candle
Show MTF Candle: Display higher timeframe candle.
Bullish/Bearish Color: Colors for bullish/bearish candles.
Show High/Low: Show highs/lows.
High/Low Color: Color for high/low lines.
MTF Timeframe: Select higher timeframe (default: daily).
Описание скрипта Volume Delta Candles 5TF + MTF Candles (Русский)
Назначение
Скрипт Volume Delta Candles 5TF + MTF Candles — это аналитический инструмент для трейдеров, использующих дельту объема и анализ нескольких таймфреймов (MTF). Он визуализирует дельту объема (разницу между объемами покупок и продаж) на пяти таймфреймах, помогая выявлять манипуляции, сильные рыночные импульсы и трендовые сигналы. Дополнительно скрипт отображает свечи старшего таймфрейма на текущем графике, предоставляя контекст для принятия решений.
Индикатор подходит для трейдеров, работающих с объемами, анализом манипуляций или трендовыми стратегиями. Его уникальность заключается в детализированном анализе дельты объема на пяти таймфреймах, адаптивной автоматизации таймфреймов и гибких настройках.
Анализ дельты объема
Дельта объема — это ключевая метрика скрипта, отражающая разницу между объемами покупок и продаж за определенный период. Она разделена на пять уровней, соответствующих пяти таймфреймам, что позволяет трейдерам видеть, как рыночная активность варьируется на разных временных масштабах. Основная дельта подбирается автоматически в зависимости от выбранного таймфрейма графика, обеспечивая релевантность анализа.
Выбор таймфреймов
Основные таймфреймы: Автоматически определяются на основе текущего графика и включают месяц, неделю, день, 4 часа и час. Эти таймфреймы выбраны для охвата долгосрочных и среднесрочных трендов, обеспечивая контекст для анализа.
Нижние таймфреймы: Подбираются методом оптимизации для выявления наиболее значимых краткосрочных движений. Они короче основных таймфреймов и фокусируются на микроактивности рынка, такой как манипуляции или импульсы.
Взаимосвязь пяти таймфреймов
Пять таймфреймов обеспечивают комплексный анализ, сочетая детализацию и контекст. Каждый таймфрейм анализирует дельту объема, создавая многослойную картину:
Короткие таймфреймы: Улавливают моментальные изменения активности (например, всплеск покупок или продаж).
Длинные таймфреймы: Оценивают устойчивость движений, фильтруя шум краткосрочных колебаний. Дельта на каждом таймфрейме отображается отдельной свечой, с цветом и размером, зависящими от ее величины и направления. Это позволяет трейдерам сравнивать, как краткосрочные действия соотносятся с более широкими трендами.
Влияние дельты на свечи
Дельта объема напрямую влияет на визуализацию свечей, отражая рыночную динамику. Разделение дельты на пять частей (по одному для каждого таймфрейма) делает анализ интуитивно понятным. Рассмотрим ключевые сценарии:
Маленькая дельта на низком таймфрейме, большая на высоком:
Описание: На младшем таймфрейме дельта мала (например, незначительная разница между покупками и продажами), но на старшем таймфрейме дельта велика (например, сильный перевес покупок).
Интерпретация: Это может указывать на накопление позиций крупными игроками на старшем таймфрейме, маскируемое низкой активностью на младшем. Трейдеры могут использовать это как сигнал для входа в направлении старшего тренда.
Визуализация: Свеча младшего таймфрейма будет узкой и бледной, а свеча старшего — широкой и яркой (синяя для положительной дельты, красная для отрицательной).
Большая дельта на низком таймфрейме, маленькая на высоком:
Описание: На младшем таймфрейме наблюдается сильная дельта (например, всплеск продаж), но на старшем — слабая активность.
Интерпретация: Это может быть краткосрочным импульсом или манипуляцией, не поддерживаемой общим трендом. Трейдеры должны быть осторожны, так как движение может быть ложным.
Визуализация: Свеча младшего таймфрейма яркая и широкая, а старшего — бледная и узкая.
Обратная дельта:
Описание: Дельта на младшем таймфрейме положительная (покупки преобладают), а на старшем — отрицательная (продажи доминируют), или наоборот.
Интерпретация: Указывает на потенциальную манипуляцию или разворот. Например, краткосрочные покупки могут быть поглощены продажами на старшем таймфрейме, сигнализируя о слабости быков.
Визуализация: Свечи разных таймфреймов окрашены в противоположные цвета (например, синяя на младшем, красная на старшем).
Дельты в оба направления:
Описание: На разных таймфреймах дельта чередуется между положительной и отрицательной без явного доминирования.
Интерпретация: Отражает неопределенность или консолидацию на рынке. Трейдерам стоит дождаться более четких сигналов или использовать другие индикаторы.
Визуализация: Свечи разных таймфреймов имеют смешанные цвета и размеры, создавая «разбросанную» картину.
Пустые свечи (Void):
Описание: Дельта на одном или нескольких таймфреймах близка к нулю, несмотря на движение цены.
Интерпретация: Указывает на ложное движение или отсутствие интереса участников рынка. Это часто связано с манипуляциями, такими как ложные пробои.
Визуализация: Отмечается ромбовидной меткой (void-манипуляция), а свеча имеет минимальный размер и бледный цвет.
Полезность
Детализированный анализ дельты: Пять уровней дельты показывают, как рыночная активность варьируется от микро- до макроуровня.
Обнаружение манипуляций: Маркирует свечи с расхождением цены и дельты, помогая выявить ложные движения.
Сильные свечи: Выделяет импульсные движения с высокой дельтой и объемом.
MTF-анализ: Отображает свечи старшего таймфрейма, упрощая анализ трендов и ключевых уровней.
Универсальность: Настройки чувствительности делают скрипт подходящим для акций, форекса, криптовалют и любых таймфреймов.
Как использовать
Добавление на график:
Откройте TradingView и выберите актив.
Найдите индикатор «Volume Delta Candles 5TF + MTF Candles » в меню «Индикаторы».
Подтвердите доступ (скрипт invite-only).
Интерпретация сигналов:
Дельта-свечи: Окрашены по направлению дельты (синий — положительная, красный — отрицательная). Интенсивность цвета и размер свечи зависят от силы дельты на каждом из пяти таймфреймов.
Манипуляции:
Треугольники: Сильное расхождение цены и дельты.
Кресты: Слабое расхождение.
Ромбы: Пустые свечи (void), указывающие на минимальную дельту.
Сильные свечи: Круги под/над свечами обозначают импульсы с высокой дельтой.
MTF-свеча: Прозрачная свеча старшего таймфрейма показывает тренд и диапазон.
Применение в торговле:
Используйте манипуляции для поиска разворотов или ложных пробоев.
Подтверждайте импульсы сильными свечами и дельтой на старших таймфреймах.
Анализируйте MTF-свечи для определения трендового контекста.
Сравнивайте дельту на всех пяти таймфреймах для фильтрации сигналов.
Комбинируйте с уровнями поддержки/сопротивления или другими индикаторами.
Настройки
Параметры сгруппированы для удобства настройки.
1. Метки (Labels)
Show Manipulations: Показывать сильные манипуляции (треугольники).
Show Void Manipulations: Показывать void-манипуляции (ромбы).
Show Delta Sandwich: Зарезервировано для будущих обновлений.
Show Strong Candles: Показывать сильные свечи (круги).
2. Фильтры (Strong Candle Filter)
Filter Sensitivity: Чувствительность фильтра:
Normal: Для стабильных рынков.
Medium: Для умеренной волатильности.
Sensitive: Для высокочастотной торговли.
3. Цвета дельты (Delta Colors)
Delta 1↑ (Main): Цвет положительной дельты основного таймфрейма.
Delta 1↓ (Main): Цвет отрицательной дельты основного таймфрейма.
Остальные таймфреймы используют производные цвета с разной прозрачностью.
4. Таймфреймы (Timeframes)
Timeframe Sensitivity: Чувствительность нижних таймфреймов:
Normal: Стандартное деление.
Medium: Более детализированный анализ.
Sensitive: Максимальная детализация.
5. MTF-свеча (MTF Candle)
Show MTF Candle: Показывать свечу старшего таймфрейма.
Bullish/Bearish Color: Цвета бычьей/медвежьей свечи.
Show High/Low: Показывать максимумы/минимумы.
High/Low Color: Цвет линий максимума/минимума.
MTF Timeframe: Выбор старшего таймфрейма (по умолчанию — дневной).

Volume Range Profile with Fair Value (Zeiierman)█ Overview
The Volume Range Profile with Fair Value (Zeiierman) is a precision-built volume-mapping tool designed to help traders visualize where institutional-level activity is occurring within the price range — and how that volume behavior shifts over time.
Unlike traditional volume profiles that rely on fixed session boundaries or static anchors, this tool dynamically calculates and displays volume zones across both the upper and lower ends of a price range, revealing point-of-control (POC) levels, directional volume flow, and a fair value drift line that updates live with each candle.
You’re not just looking at volume anymore. You’re dissecting who’s in control — and at what price.
⚪ In simple terms:
Upper Zone = The upper portion of the price range, showing concentrated volume activity — typically where selling or distribution may occur
Lower Zone = The lower portion of the price range, highlighting areas of high volume — often associated with buying or accumulation
POC Bin = The bin (price level) with the highest traded volume in the zone — considered the most accepted price by the market
Fair Value Trend = A dynamic trend line tracking the average POC price over time — visualizing the evolving fair value
Zone Labels = Display real-time breakdown of buy/sell volume within each zone and inside the POC — revealing who’s in control
█ How It Works
⚪ Volume Zones
Upper Zone: Anchored at the highest high in the lookback period
Lower Zone: Anchored at the lowest low in the lookback period
Width is user-defined via % of range
Each zone is divided into a series of volume bins
⚪ Volume Bins (Histograms)
Each zone is split into N bins that show how much volume occurred at each level:
Taller = More volume
The POC bin (Point of Control) is highlighted
Labels show % of volume in the POC relative to the whole zone
⚪ Buy vs Sell Breakdown
Each volume bin is split by:
Buy Volume = Close ≥ Open
Sell Volume = Close < Open
The script accumulates these and displays total Buy/Sell volume per zone.
⚪ Fair Value Drift Line
A POC trend is plotted over time:
Represents where volume was most active across each range
Color changes dynamically — green for rising, red for falling
Serves as a real-time fair value anchor across changing market structure
█ How to Use
⚪ Identify Key Control Zones
Use Upper/Lower Zone structures to understand where supply and demand is building.
Zones automatically adapt to recent highs/lows and re-center volume accordingly.
⚪ Follow Institutional Activity
Watch for POC clustering near price tops or bottoms.
Large volumes near extremes may indicate accumulation or distribution.
⚪ Spot Fair Value Drift
The fair value trend line (average POC price) gives insight into market equilibrium.
One strategy can be to trade a re-test of the fair value trend, trades are taken in the direction of the current trend.
█ Understanding Buy & Sell Volume Labels (Zone Totals)
These labels show the total buy and sell volume accumulated within each zone over the selected lookback period:
Buy Vol (green label) → Total volume where candles closed bullish
Sell Vol (red label) → Total volume where candles closed bearish
Together, they tell you which side dominated:
Higher Buy Vol → Bullish accumulation zone
Higher Sell Vol → Bearish distribution zone
This gives a quick visual insight into who controlled the zone, helping you spot areas of demand or supply imbalance.
█ Understanding POC Volume Labels
The POC (Point of Control) represents the price level where the most volume occurred within the zone. These labels break down that volume into:
Buy % – How much of the volume was buying (price closed up)
Sell % – How much was selling (price closed down)
Total % – How much of the entire zone’s volume happened at the POC
Use it to spot strong demand or supply zones:
High Buy % + High Total % → Strong buying interest = likely support
High Sell % + High Total % → Strong selling pressure = likely resistance
It gives a deeper look into who was in control at the most important price level.
█ Why It’s Useful
Track where fair value is truly forming
Detect aggressive volume accumulation or dumping
Visually split buyer/seller control at the most relevant price levels
Adapt volume structures to current trend direction
█ Settings Explained
Lookback Period: Number of bars to scan for highs/lows. Higher = smoother zones, Lower = reactive.
Zone Width (% of Range): Controls how much of the range is used to define each zone. Higher = broader zones.
Bins per Zone: Number of volume slices per zone. Higher = more detail, but heavier on resources.
-----------------
Disclaimer
The content provided in my scripts, indicators, ideas, algorithms, and systems is for educational and informational purposes only. It does not constitute financial advice, investment recommendations, or a solicitation to buy or sell any financial instruments. I will not accept liability for any loss or damage, including without limitation any loss of profit, which may arise directly or indirectly from the use of or reliance on such information.
All investments involve risk, and the past performance of a security, industry, sector, market, financial product, trading strategy, backtest, or individual's trading does not guarantee future results or returns. Investors are fully responsible for any investment decisions they make. Such decisions should be based solely on an evaluation of their financial circumstances, investment objectives, risk tolerance, and liquidity needs.

Dollar Volume DivergenceOverview
The Dollar Volume Profile and Divergence Indicator is a comprehensive tool designed to analyze both standard volume and dollar volume activity in the market. It visualizes dollar volume (calculated as close * volume) and highlights divergences between dollar volume and standard volume, providing insights into underlying market dynamics that aren't immediately visible with traditional volume analysis.
Key Features
Dollar Volume Profile:
Plots dollar volume as a histogram.
Highlights high-dollar volume bars in green (indicating significant trading activity).
Includes an optional average dollar volume line to show trends over time.
Volume-Divergence Analysis:
Calculates the difference (divergence) between dollar volume and standard volume.
Displays positive divergence (dollar volume > standard volume) in green and negative divergence (dollar volume < standard volume) in red.
Supports both histogram and boolean point visualization for divergence, offering flexibility in how the data is displayed.
Customizable Visualization:
Users can toggle between a Histogram or Boolean Points for divergence visualization.
Option to enable or disable the dollar volume profile and its average line.
Adjustable length parameter to fine-tune sensitivity for averages and divergences.
Use Cases
Volume Confirmation: Analyze whether dollar volume aligns with standard volume to confirm strong price movements.
Divergence Detection: Identify areas where dollar volume and standard volume deviate, which may signal potential reversals or exhaustion in a trend.
Market Strength Analysis: Assess the intensity of trading activity at specific price levels to determine key areas of interest.
How It Works
Dollar Volume Calculation:
Dollar volume is derived by multiplying the close price by the volume for each bar.
A moving average of dollar volume is used to determine relative activity levels.
Divergence Calculation:
The script calculates the difference between dollar volume and standard volume.
Positive values indicate that dollar volume exceeds standard volume, suggesting institutional or larger-scale trades.
Negative values highlight areas of lower dollar volume compared to standard volume.
Visualization:
The Dollar Volume Profile is displayed as a histogram, with high-dollar volume bars highlighted.
Divergences are overlaid as either a histogram or triangle markers, depending on user preference.
Average lines (optional) provide smoother trends for both dollar volume and divergence.
Customization Options
Length: Adjusts the period for moving average calculations.
Plot Style: Choose between Histogram or Boolean Points for divergence visualization.
Toggle Visibility: Enable or disable the Dollar Volume Profile and its average line for a cleaner chart.
Why Use This Indicator?
This indicator bridges the gap between traditional volume analysis and dollar volume analysis, offering deeper insights into market behavior. By combining these metrics, traders can detect nuanced patterns, validate trends, and identify divergences that may signal market turning points or continuation.
Best Practices
Use this indicator in conjunction with price action and other technical indicators for confirmation.
Look for divergences in high-dollar volume areas to detect potential trend reversals.
Analyze the interaction between the dollar volume profile and divergence histogram for a comprehensive view of market activity.
Important Notice:
Trading financial markets involves significant risk and may not be suitable for all investors. The use of technical indicators like this one does not guarantee profitable results. This indicator should not be used as a standalone analysis tool. It is essential to combine it with other forms of analysis, such as fundamental analysis, risk management strategies, and awareness of current market conditions. Always conduct thorough research or consult with a qualified financial advisor before making trading decisions. Past performance is not indicative of future results.
Disclaimer:
Trading financial instruments involves substantial risk and may not be suitable for all investors. Past performance is not indicative of future results. This indicator is provided for informational and educational purposes only and should not be considered investment advice. Always conduct your own research and consult with a licensed financial professional before making any trading decisions.
Note: The effectiveness of any technical indicator can vary based on market conditions and individual trading styles. It's crucial to test indicators thoroughly using historical data and possibly paper trading before applying them in live trading scenarios.

Volume IQOverview
Volume IQ is meant to be the ‘intelligent volume distribution analyzer’ that takes much of the work of interpreting volume profiles off of your shoulders. It attempts to ‘do the technical analysis’ of volume data for you, with its capstone feature being "Trading Action Zones": ranges on the chart whose placement are determined by high and low volume nodes and sentiment analysis, and their adapting range affected by current volatility. These zones are meant to offer practical levels for potential entries, exits, targets, and stops while trading. These zones are the cherry on top of other useful and original features like visuals for grouping areas of similar buy/sell bias.
Originality and Usefulness
Volume IQ stands out for its originality by offering a data-driven approach to interpreting volume profiles and presenting its analysis on the chart. Unlike traditional volume profiles, Volume IQ automates much of the volume analysis process, helping traders identify potential opportunities and key trading areas with minimal effort. Its unique "Trading Action Zones" leverage high and low volume nodes, sentiment analysis, and current volatility to highlight practical levels for entries, exits, targets, and stops. Additionally, the tool provides grouped bias visuals, gradient coloring, and flexible customization options, allowing traders to gain a clearer understanding of market sentiment and structure. By simplifying complex volume data into actionable insights, Volume IQ provides a valuable and efficient resource for charting on TradingView.
The ‘Capstone’ Feature:
Trading ‘Action Zones’: Potential areas to take trading action based on built-in interpretations of high-volume nodes, low-volume nodes, and overarching chart sentiment (whose calculation is described below), and their interplay. Categorized by tiers - with Tier 2 zones intended as potential entry areas, and Tier 1 zones for exits or adds. These zones can also present logical areas to consider targets and stops, for example placing a stop loss in a Tier 1 sell zone below price where there is a series of low-volume nodes and potentially not much support. These zones help you quickly identify potential areas on the chart to ‘take action’.
Key Features:
Level and Block Biases: By estimating buying and selling volume, as well as leveraging intrabar data, the Volume IQ profile provides detailed buy/sell sentiment at individual price levels. It then groups together consecutive price levels with the same bias into what we call ‘Block Biases’ making it easy to determine larger price areas with distinct buying or selling pressure.
Chart Sentiment Analysis: A ‘continuously optimizing algorithm’ configured to find high average runups after a sentiment switch powers what we call ‘bias guidelines’ which border the Volume IQ profile and influence the determination of Action Zones. This algorithm is based on comparing many combinations of volume-weighted trends, largely based on smoothed volume weighted moving averages, on each bar, to ensure that the approach with the highest average runup amongst the combinations is used.
Zones of Control: A gradient-coloring approach to the profile highlighst areas of influence at a glance, making it easier to focus on key price levels.
Broad Compatibility: Works across all chart timeframes and market types - so long as volume data and OHLC candle data is available.
Highly Customizable: Configure features to align with your trading preferences and workflow. Show them all, or pick and choose the ones you want.
Settings
Use a Color Theme: Toggle between our predefined color themes or customize your own.
Style: Select your preferred color theme (e.g., "TI Fusion").
Colors (When Not Using a Theme): Customize primary, secondary, and background colors for your own non-theme styling.
Gradient Coloring: Enable or disable gradient shading of the profile for visual enhancement of zones with high control and low control.
Action Zones: Turn trading action zones on or off to highlight key trading levels.
Time Staggering: Enabling this option will simply ‘stagger’ the display of action zones horizontally. Zones closer to price will be placed leftwards, and as they become more distant from price, they will be ‘staggered out’ rightwards, to give an intuitive feel for the time it may take for price to reach these zones.
Tier Labels: Enable or disable the ‘tier labels’ (1 square for Tier 1, 2 squares for Tier 2) for action zones.
Bias Blocks: Toggle the display of grouped buy/sell bias blocks.
Extend: Choose how the bias blocks are displayed: “Left” to stretch them from the end to the beginning of the histogram, “Right” to extend from the end outwards, and “Across” to extend from the beginning to outwards past the end, enveloping the bias and volume count labels.
Opacity: Adjust the transparency level of bias blocks (0–100).
Level Bias Labels: Turn on/off labels for individual price level biases.
Bias Guidelines: Enable the visual guidelines for bias levels which border the profile.
Volume Counts: Toggle volume count labels for each of the profile’s price levels.
Split Buy/Sell Volume: Enable separate display of buy and sell volume for each level (buy volume on the left, sell volume on the right).
Font Size: Adjust the font size for these labels.
Histogram Display: Choose the display option for the histogram bars of the profile themselves: "Full View" will display the profile, and “None” will hide it.
BG Shading Logic: Adjust the background shading logic for the display: “Neutral” will use the ‘Neutral Color’ from your color theme to put some emphasis around high and low volume nodes, while “None” will remove any background shading.
Detail: This option allows you to set the granularity of the volume data used: “Bar Data” will simply use the bar data from the chart timeframe, while “Intrabar Data” will attempt to use bar data from a lower timeframe. Please note that using intrabar data may not be available with your TradingView subscription on some timeframes, and also that using intrabar data may increase calculation time.
Data Request: Choose the lookback for the volume distribution: "Long-term" will look back 500 bars, and “Short-Term” will halve this.
# of Levels: Specify the number of levels/rows to display for visualizing the distribution.
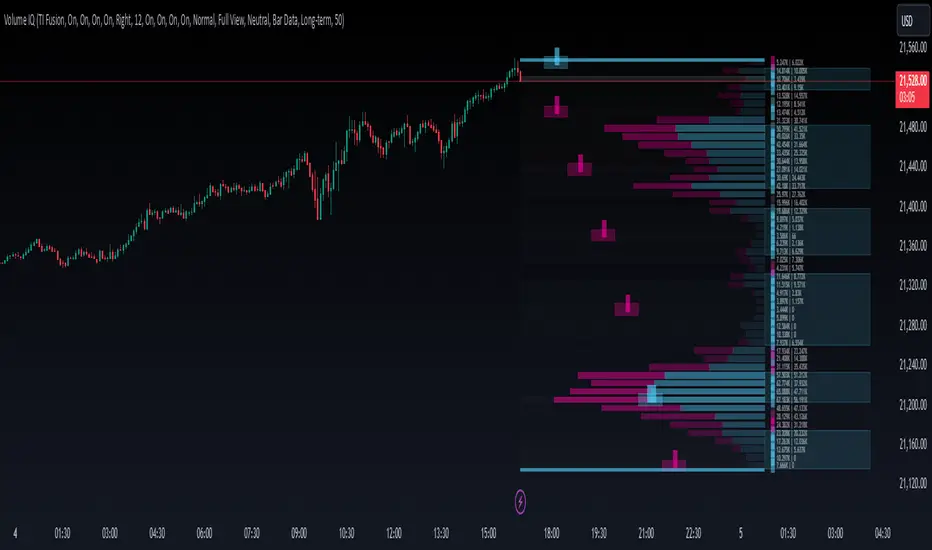
Volume Based Price Prediction [EdgeTerminal]This indicator combines price action, volume analysis, and trend prediction to forecast potential future price movements. The indicator creates a dynamic prediction zone with confidence bands, helping you visualize possible price trajectories based on current market conditions.
Key Features
Dynamic price prediction based on volume-weighted trend analysis
Confidence bands showing potential price ranges
Volume-based candle coloring for enhanced market insight
VWAP and Moving Average overlay
Customizable prediction parameters
Real-time updates with each new bar
Technical Components:
Volume-Price Correlation: The indicator analyzes the relationship between price movements and volume, Identifies stronger trends through volume confirmation and uses Volume-Weighted Average Price (VWAP) for price equilibrium
Trend Strength Analysis: Calculates trend direction using exponential moving averages, weights trend strength by relative volume and incorporates momentum for improved accuracy
Prediction Algorithm: combines current price, trend, and volume metrics, projects future price levels using weighted factors and generates confidence bands based on price volatility
Customizable Parameters:
Moving Average Length: Controls the smoothing period for calculations
Volume Weight Factor: Adjusts how much volume influences predictions
Prediction Periods: Number of bars to project into the future
Confidence Band Width: Controls the width of prediction bands
How to use it:
Look for strong volume confirmation with green candles, watch for prediction line slope changes, use confidence bands to gauge potential volatility and compare predictions with key support/resistance levels
Some useful tips:
Start with default settings and adjust gradually
Use wider confidence bands in volatile markets
Consider prediction lines as zones rather than exact levels
Best applications of this indicator:
Trend continuation probability assessment
Potential reversal point identification
Risk management through confidence bands
Volume-based trend confirmation

Volume StatsDescription:
Volume Stats displays volume data and statistics for every day of the year, and is designed to work on "1D" timeframe. The data is displayed in a table with columns being months of the year, and rows being days of each month. By default, latest data is displayed, but you have an option to switch to data of the previous year as well.
The statistics displayed for each day is:
- volume
- % of total yearly volume
- % of total monthly volume
The statistics displayed for each column (month) is:
- monthly volume
- % of total yearly volume
- sentiment (was there more bullish or bearish volume?)
- min volume (on which day of the month was the min volume)
- max volume (on which day of the month was the max volume)
The cells change their colors depending on whether the volume is bullish or bearish, and what % of total volume the current cell has (either yearly or monthly). The header cells also change their color (based either on sentiment or what % of yearly volume the current month has).
This is the first (and free) version of the indicator, and I'm planning to create a "PRO" version of this indicator in future.
Parameters:
- Timezone
- Cell data -> which data to display in the cells (no data, volume or percentage)
- Highlight min and max volume -> if checked, cells with min and max volume (either monthly or yearly) will be highlighted with a dot or letter (depending on the "Cell data" input)
- Cell stats mode -> which data to use for color and % calculation (All data = yearly, Column = monthly)
- Display data from previous year -> if checked, the data from previous year will be used
- Header color is calculated from -> either sentiment or % of the yearly volume
- Reverse theme -> the table colors are automatically changed based on the "Dark mode" of Tradingview, this checkbox reverses the logic (so that darker colors will be used when "Dark mode" is off, and lighter colors when it's on)
- Hide logo -> hides the cat logo (PLEASE DO NOT HIDE THE CAT)
Conclusion:
Let me know what you think of the indicator. As I said, I'm planning to make a PRO version with more features, for which I already have some ideas, but if you have any suggestions, please let me know.
Cumulative Volume Delta Histogram [TradingFinder] CVD Histogram🔵 Introduction
To fully understand Cumulative Volume Delta (CVD), it’s important to start by explaining Volume Delta. In trading, "Delta" refers to the difference between two values or the rate of change between two data points. Volume Delta represents the difference between buying and selling pressure for each candlestick on a chart, and this difference can vary across different time frames.
A positive delta indicates that buying volume exceeds selling volume, while a negative delta shows that selling pressure is stronger. When buying and selling volumes are equal, the volume delta equals zero.
The Cumulative Volume Delta (CVD) indicator tracks the cumulative difference between buying and selling volumes over time, helping traders analyze market dynamics and identify reliable trading signals through CVD divergences.
🔵 How to Use
Cumulative Volume Delta (CVD) is an essential technical analysis tool that aggregates delta values for each candlestick, creating a comprehensive indicator. This helps traders evaluate overall buying and selling pressure over market swings.
Unlike standard Volume Delta, which compares the delta on a candle-by-candle basis, CVD provides a broader view of buying and selling pressure during market trends. A downward-trending CVD suggests that selling pressure is dominant, which is typically a bearish signal.
Conversely, an upward-trending CVD indicates bullish sentiment, suggesting buyers are in control. This analysis becomes even more valuable when compared with price action and market structure, helping traders predict the direction of asset prices.
🟣 How to Use CVD in Trend Analysis and Market Reversals
Understanding how to detect trend changes using Cumulative Volume Delta is crucial for traders. Typically, CVD aligns with market structure, moving in the same direction as price trends.
However, divergences between CVD and price movements or signs of volume exhaustion can be powerful indicators of potential market reversals. Recognizing these patterns helps traders make more informed decisions and improve their trading strategies.
🟣 How to Spot Trend Exhaustion with CVD
CVD is particularly effective for identifying trend exhaustion in the market. For instance, if an asset's price hits a new low, but CVD doesn’t follow, this might indicate a lack of seller interest, signaling potential exhaustion and a possible reversal.
Similarly, if an asset reaches a new high but CVD fails to follow, it can suggest that buyers lack the strength to push the market higher, indicating a possible reversal to the downside.
🟣 How to Use CVD Divergence in Price Trend Analysis
Another effective use of CVD is identifying divergences in price trends. For example, if CVD breaks a previous high or low while the price remains stable, this divergence may indicate that buying or selling pressure is being absorbed.
For instance, if CVD rises sharply without a corresponding increase in asset prices, it may suggest that sellers are absorbing the buying pressure, which could lead to a strong sell-off. Conversely, if prices remain stable while CVD declines, it may indicate that buyers are absorbing selling pressure, likely leading to a price increase once the selling subsides.
🟣 CVD Display, Candlestick vs. Histogram – What’s the Difference?
CVD can be displayed in two different formats :
Candlestick Display : In this format, the data is shown as green and red candlesticks, each representing the difference in buying and selling pressure over a given time period. This display allows traders to visually analyze market pressure along with price changes.
Histogram Display : Here, the data is represented as vertical green and red bars, where each bar’s height corresponds to the volume delta. This format offers a clearer view of the strengths and weaknesses in market buying and selling pressure.
🟣 What are the Key Settings for CVD?
Cumulative Mode : CVD offers three modes: "Total," "Periodic," and "EMA." In "Total" mode, CVD accumulates the delta from the beginning to the end of the session. In "Periodic" mode, it accumulates volume periodically, resetting at specific intervals. In "EMA" mode, the CVD is smoothed using an Exponential Moving Average (EMA) to filter out short-term fluctuations.
Period : The "Period" setting allows you to define the number of bars or intervals for "Periodic" and "EMA" modes. A shorter period captures more short-term movements, while a longer period smooths out the fluctuations and provides a broader view of market trends.
Market Ultra Data : This feature integrates data from 26 major brokers into the volume calculations, providing more reliable volume data. It’s important to specify the type of market you are analyzing (Forex, crypto, etc.) as different brokers contribute to different markets. Enabling this setting ensures the highest accuracy in volume analysis.
🔵 Conclusion
Cumulative Volume Delta (CVD) is a powerful technical indicator that helps traders assess buying and selling pressure by aggregating the delta values of each candlestick. Whether displayed as candlesticks or histograms, CVD provides insights into market trends, helping traders make informed decisions.
CVD is particularly useful in identifying divergences and exhaustion in market trends. For example, if CVD does not align with price movements, it can signal a potential trend reversal. Traders use this tool to fine-tune their entry and exit points and better predict future market movements.
In summary, CVD is a versatile tool for analyzing volume data and understanding the balance of buying and selling pressure in the market, making it an invaluable asset in any trader’s toolkit