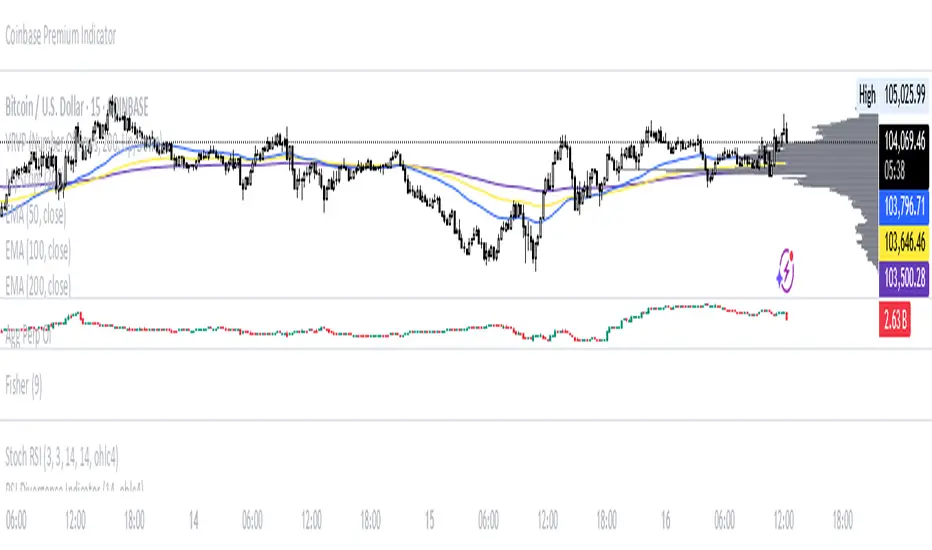
Aggregated Perpetual Futures Open InterestPurpose
Aggregates perpetual futures open interest across Binance, Bybit, and OKX for the base currency of the asset loaded in your tradingview window.
How It Works
Symbol detection: The script grabs syminfo.basecurrency (e.g., “BTC”) from whatever market is on screen.
Ticker mapping: It constructs the three perp-OI feeds that TradingView publishes in the form EXCHANGE:USDT.P_OI
Data request: For each feed it fetches the full OHLC candle (request.security) on the chart’s timeframe. If a venue doesn’t list that perp, the request simply returns na.
Aggregation: The script adds the opens, highs, lows, and closes of all non-na feeds to produce a single aggregated OI candle.
General Notes
The status line shows each venue’s individual OI close.
在腳本中搜尋"如何用wind搜索股票的发行价和份数"
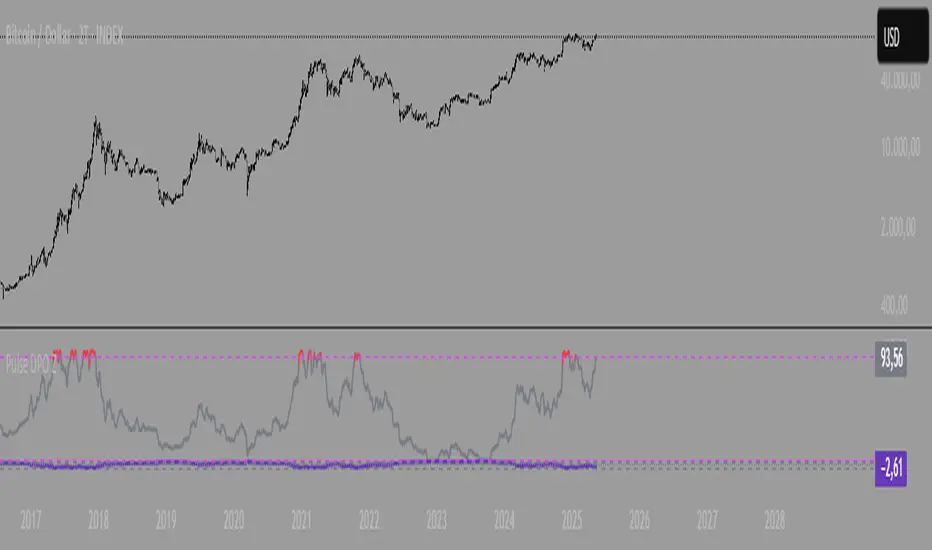
Pulse DPO with Z-Score📌 Pulse DPO with Z-Score — Indicator Description (English)
The Pulse DPO (Detrended Price Oscillator) helps identify major market cycle tops and bottoms by removing long-term trends and focusing on shorter-term price cycles.
This enhanced version includes:
A normalized oscillator (0–100) based on recent price deviations.
A smoothed signal to reduce noise.
A Z-Score transformation, scaling the output to a range from –3 to +3, where:
–3 represents extreme oversold conditions (former normalized value = 100),
+3 represents extreme overbought conditions (former normalized value = 1).
🔍 How it works:
The indicator subtracts a delayed moving average from price to isolate short-term cycles (DPO logic).
It then normalizes the oscillator within a lookback window.
Finally, it converts this to a Z-Score scale for easier interpretation of extremes.
🟢 Suggested Usage:
Consider Long entries or Short exits when Z-Score reaches –2 to –3 (deep oversold).
Consider Short entries or Long exits when Z-Score reaches +2 to +3 (deep overbought).
Use in combination with other signals for higher-confidence setups.
Money Flow: In & Out Detector[THANHCONG]Indicator Name:
Money Flow: In & Out Detector
Indicator Description:
The Money Flow: In & Out Detector indicator uses technical indicators such as RSI (Relative Strength Index), MFI (Money Flow Index), and volume analysis to determine money inflow and outflow in the market.
This indicator helps traders identify changes in money flow, allowing them to detect buy and sell signals based on the combination of the following factors:
RSI > 50 and MFI > 50: Money inflow, indicating a buy signal.
RSI < 50 and MFI < 50: Money outflow, indicating a sell signal.
Volume increase/decrease relative to the average: Identifies strong market behavior changes.
Adjustable Parameters:
RSI Length: The number of periods to calculate the RSI (default is 14).
MFI Length: The number of periods to calculate the MFI (default is 14).
Volume MA Length: The number of periods to calculate the moving average of volume (default is 20).
Volume Increase/Decrease (%): The percentage threshold for volume change compared to the moving average (default is 20%).
Look Back Period: The number of periods used to identify peaks and troughs (default is 20).
How to Use the Indicator:
Money Inflow: When both RSI and MFI are above 50, and volume increases significantly relative to the moving average, the indicator shows a Buy signal.
Money Outflow: When both RSI and MFI are below 50, and volume decreases significantly relative to the moving average, the indicator shows a Sell signal.
Identifying Peaks and Troughs: The indicator also helps identify market peaks and troughs based on technical conditions.
Note:
This indicator assists in decision-making, but does not replace comprehensive market analysis.
Use this indicator in conjunction with other technical analysis methods to increase the accuracy of trade signals.
Steps for Publishing the Indicator on TradingView:
Log in to TradingView:
Go to TradingView and log into your account.
Access Pine Script Editor:
Click on Pine Editor from the menu under the chart.
Paste your Pine Script® code into the editor window.
Check the Source Code:
Ensure your code is error-free and running correctly.
Review the entire source code and add the MPL-2.0 license notice if necessary.
Save and Publish:
After testing and confirming the code works correctly, click Add to Chart to try the indicator on your chart.
If satisfied with the result, click Publish Script at the top right of the Pine Editor.
Provide a name for the indicator and then enter the detailed description you’ve prepared.
Ensure you specify the MPL-2.0 license in the description if required.
Choose the Access Type:
You can choose either Public or Private access for your indicator depending on your intention.
Submit for Publication:
Wait for TradingView to review and approve your indicator. Typically, this process takes a few working days for verification and approval.
User Guide:
You can share detailed instructions for users on how to use the indicator on TradingView, including how to adjust the parameters and interpret the signals. For example:
Set RSI Length: Experiment with different RSI Length values to find the sensitivity that suits your strategy.
Interpreting In/Out Signals: When there is strong money inflow (In), consider entering a buy order. When there is strong money outflow (Out), consider selling.

0830-0845 High/Low Marker (Accurate Start + History)This indicator marks the high and low of the 15-minute candle between 08:30 and 08:45 (local time) of the trading session. The high and low are tracked dynamically, with the lines drawn once the 08:45 candle closes.
Key Features:
Session-based Tracking: Automatically tracks and records the high and low of the 15-minute period starting at 08:30 and ending at 08:45.
Excludes 08:45 High : If a high is created exactly at 08:45, the indicator will ignore it and use the highest value before 08:45, ensuring it only references the price action during the specified window.
Line Extension : The high and low lines are drawn and extended to the right for a user-defined number of bars, making them visible beyond the session's close.
Customizable Parameters : Adjust the start and end times of the session, line colors, and line width to fit your preferences.
Use Case :
Ideal for traders who focus on the price action during the early part of the trading session (08:30 to 08:45) and want to track significant levels of support and resistance from that period.
The extended lines help identify potential price zones for the rest of the session or the trading day.
ConeCastConeCast is a forward-looking projection indicator that visualizes a future price range (or "cone") based on recent trend momentum and adaptive volatility. Unlike lagging bands or reactive channels, this tool plots a predictive zone 3–50 bars ahead, allowing traders to anticipate potential price behavior rather than merely react to it.
How It Works
The core of ConeCast is a dynamic trend-slope engine derived from a Linear Regression line fitted over a user-defined lookback window. The slope of this trend is projected forward, and the cone’s width adapts based on real-time market volatility. In calm markets, the cone is narrow and focused. In volatile regimes, it expands proportionally, using an ATR-based % of price to scale.
Key Features
📈 Predictive Cone Zone: Visualizes a forward range using trend slope × volatility width.
🔄 Auto-Adaptive Volatility Scaling: Expands or contracts based on market quiet/chaotic states.
📊 Regime Detection: Identifies Bull, Bear, or Neutral states using a tunable slope threshold.
🧭 Multi-Timeframe Compatible: Slope and volatility can be calculated from higher timeframes.
🔔 Smart Alerts: Detects price entering the cone, and signals trend regime changes in real time.
🖼️ Clean Visual Output: Optionally includes outer cones, trend-trail marker, and dashboard label.
How to Use It
Use on 15m–4H charts for best forward visibility.
Look for price entering the cone as a potential trend continuation setup.
Monitor regime changes and volatility expansion to filter choppy market zones.
Tune the slope sensitivity and ATR multiplier to match your symbol's behavior.
Use outer cones to anticipate aggressive swings and wick traps.
What Makes It Unique
ConeCast doesn’t follow price — it predicts a possible future price envelope using trend + volatility math, without relying on lagging indicators or repainting logic. It's a hybrid of regression-based forecasting and dynamic risk zoning, designed for swing traders, scalpers, and algo developers alike.
Limitations
ConeCast projects based on current trend and volatility — it does not "know" future price. Like all projection tools, accuracy depends on trend persistence and market conditions. Use this in combination with confirmation signals and risk management.

AlphaTrend++AlphaTrend++
Overview
The AlphaTrend++ is an advanced Pine Script indicator designed to help traders identify buy and sell opportunities in trending and volatile markets. Building on trend-following principles, it uses a modified Average True Range (ATR) calculation combined with volume or momentum data to plot a dynamic trend line. The indicator overlays on the price chart, displaying a colored trend line, a filled trend zone, buy/sell signals, and optional stop-loss tick labels, making it ideal for day trading or swing trading, particularly in markets like futures (e.g., MES).
What It Does
This indicator generates buy and sell signals based on the direction and momentum of a custom trend line, filtered by optional time restrictions and signal frequency logic. The trend line adapts to price action and volatility, with a filled zone highlighting trend strength. Buy/sell signals are plotted as labels, and stop-loss distances are displayed in ticks (customizable for instruments like MES). The indicator supports standard chart types for realistic signal generation.
How It Works
The indicator employs the following components:
Trend Line Calculation: A dynamic trend line is calculated using ATR adjusted by a user-defined multiplier, combined with either Money Flow Index (MFI) or Relative Strength Index (RSI) depending on volume availability. The line tracks price movements, adjusting upward or downward based on trend direction and volatility.
Trend Zone: The area between the current trend line and its value two bars prior is filled, colored green for bullish trends (upward movement) or red for bearish trends (downward movement), providing a visual cue of trend strength.
Signal Generation: Buy signals occur when the trend line crosses above its value two bars ago, and sell signals occur when it crosses below, with optional filtering to reduce signal noise (based on bar timing logic). Signals can be restricted to a 9:00–15:00 UTC trading window.
Stop-Loss Ticks: For each signal, the indicator calculates the distance to the trend line (acting as a stop-loss level) in ticks, using a user-defined tick size (default 0.25 for MES). These are displayed as labels below/above the signal.
Time Filter: An optional filter limits signals to 9:00–15:00 UTC, aligning with active trading sessions like the US market open.
The indicator ensures compatibility with standard chart types (e.g., candlestick or bar charts) to avoid unrealistic results associated with non-standard types like Heikin Ashi or Renko.
How to Use It
Add to Chart: Apply the indicator to a candlestick or bar chart on TradingView.
Configure Settings:
Multiplier: Adjust the ATR multiplier (default 1.0) to control trend line sensitivity. Higher values widen the stop-loss distance.
Common Period: Set the ATR and MFI/RSI period (default 14) for trend calculations.
No Volume Data: Enable if volume data is unavailable (e.g., for certain forex pairs), switching from MFI to RSI.
Tick Size: Set the tick size for stop-loss calculations (default 0.25 for MES futures).
Show Buy/Sell Signals: Toggle signal labels (default enabled).
Show Stop Loss Ticks: Toggle stop-loss tick labels (default enabled).
Use Time Filter: Restrict signals to 9:00–15:00 UTC (default disabled).
Use Filtered Signals: Enable to reduce signal frequency using bar timing logic (default enabled).
Interpret Signals:
Buy Signal: A blue “BUY” label below the bar indicates a potential long entry (trend line crossover, passing filters).
Sell Signal: A red “SELL” label above the bar indicates a potential short entry (trend line crossunder, passing filters).
Trend Zone: Green fill suggests bullish momentum; red fill suggests bearish momentum.
Stop-Loss Ticks: Gray labels show the stop-loss distance in ticks, helping with risk management.
Monitor Context: Use the trend line and filled zone to confirm the market’s direction before acting on signals.
Unique Features
Adaptive Trend Line: Combines ATR with MFI or RSI to create a responsive trend line that adjusts to volatility and market conditions.
Tick-Based Stop-Loss: Displays stop-loss distances in ticks, customizable for specific instruments, aiding precise risk management.
Signal Filtering: Optional bar timing logic reduces false signals, improving reliability in choppy markets.
Trend Zone Visualization: The filled zone between trend line values enhances trend clarity, making it easier to assess momentum.
Time-Restricted Trading: Optional 9:00–15:00 UTC filter aligns signals with high-liquidity sessions.
Notes
Use on standard candlestick or bar charts to ensure accurate signals.
Test the indicator on a demo account to optimize settings for your market and timeframe.
Combine with other analysis (e.g., support/resistance, volume spikes) for better decision-making.
The indicator is not a standalone system; use it as part of a broader trading strategy.
Limitations
Signals may lag in highly volatile or low-liquidity markets due to ATR-based calculations.
The 9:00–15:00 UTC time filter may not suit all markets; disable it for 24-hour assets like forex or crypto.
Stop-loss tick calculations assume consistent tick sizes; verify compatibility with your instrument.
This indicator is designed for traders seeking a robust, trend-following tool with customizable risk management and signal filtering, optimized for active trading sessions.

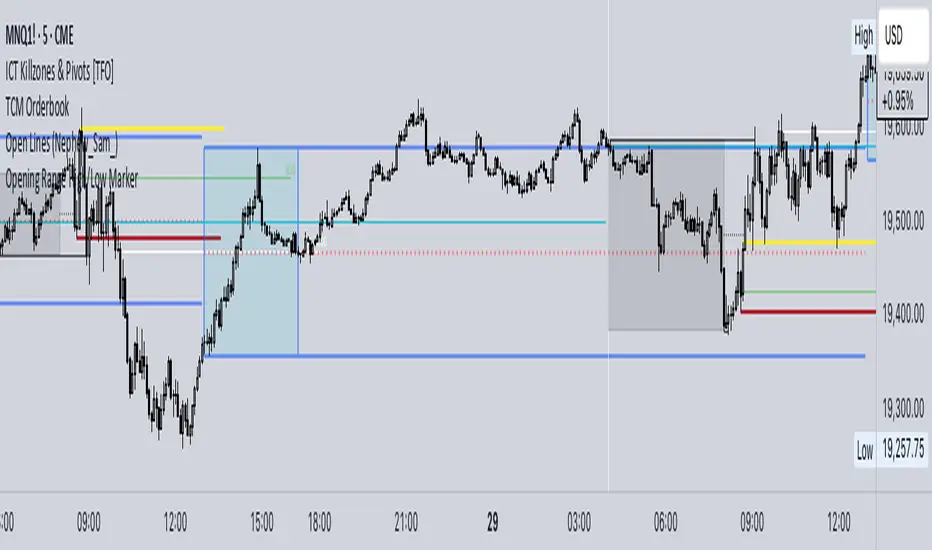
[TTM] ICT Sessions & Ranges🌟 Overview 🌟
The ICT Sessions & Ranges Indicator helps traders identify key intraday price levels by marking custom session highs/lows and opening ranges.
It helps traders spot potential liquidity grabs, reversals, and breakout zones by tracking price behavior around these key areas
🌟 Session Highs & Lows – Liquidity Zones 🌟
Session highs and lows often attract price due to stop orders resting above or below them. These levels are frequently targeted during high-volatility moves.
🔹 Asia Session
- Usually ranges in low volatility.
- Highs/lows often get swept during early London.
- Price may raid these levels, then reverse.
🔹 London Session
- First major volatility of the day.
- Highs/lows often tested or swept in New York.
- Commonly forms the day’s true high or low.
🌟 Opening Range Concepts 🌟
The Opening Range is the first 15, 30, or 60 minutes of a session (e.g., New York).
The high (ORH) and low (ORL) define the market’s initial balance and key reaction levels.
🔹 Breakout Trade
- Price breaks ORH/ORL with momentum.
- Signals directional intent.
- Traders enter on the breakout, with stops inside the range.
🔹 Liquidity Raid
- Price briefly breaks ORH/ORL to trigger stops.
- Reverses after the sweep.
- Look for structure shift and entry near FVG or OB.
🌟 Customizable Settings 🌟
The indicator includes 3 configurable ranges , each with:
Start & End Time – Set any custom time window.
Display Type – Choose Box (highlight range) or Lines (mark high/low).
Color Settings – Set custom colors for boxes and lines.
🌟 Default Settings 🌟
Range 1 : 19:00–00:00 (Asia Session)
Range 2 : 01:45–05:15 (London Session)
Range 3 : 09:30–10:00 (NY Opening Range – 30m)

ETF Builder & Backtest System [TradeDots]Create, analyze, and monitor your own custom “ETF-like” portfolio directly on TradingView. This script merges up to 10 different assets with user-defined weightings into a single composite chart, allowing you to see how your personalized portfolio would have performed historically. It is an original tool designed to help traders and investors quickly gauge risk and return profiles without leaving the TradingView platform.
📝 HOW IT WORKS
1. Custom Portfolio Construction
Multiple Assets : Combine up to 10 different stocks, ETFs, cryptocurrencies, or other symbols.
User-Defined Weights : Allocate each asset a percentage weight (e.g., 15% in AAPL, 10% in MSFT, etc.).
Single Composite Value : The script calculates a weighted “ETF-style” price, effectively simulating a merged portfolio curve on your chart.
2. Performance Tracking & Return Analysis
Automatic History Capture : The indicator records each asset’s starting price when it first appears in your chosen date range.
Rolling Updates : As time progresses, all asset prices are continually evaluated and the portfolio value is updated in real time.
Buy & Hold Returns : See how each asset—and the overall portfolio—performed from the “start” date to the most recent bar.
Annualized Return : Automatically calculates CAGR (Compound Annual Growth Rate) to help visualize performance over varying timescales.
3. Table & Visual Output
Performance Table : A comprehensive table displays individual asset returns, annualized returns, and portfolio totals.
Normalized Chart Plot : The composite ETF value is scaled to 100 at the start date, making it easy to compare relative growth or decline.
Optional Time Filter : You can define a specific date range (Start/End Dates) to focus on a particular period or to limit historical data.
⚙️ KEY FEATURES
1. Flexible Asset Selection
Choose any symbols from multiple asset classes. The script will only run calculations when data is available—no need to worry about missing quotes.
2. Dynamic Table Reporting
Start Price for each asset
Percentage Weight in the portfolio
Total Return (%) and Annualized Return (%)
3. Simple Backtesting Logic
This script takes a straightforward Buy & Hold perspective. Once the start date is reached, the portfolio remains static until the end date, so you can quickly assess hypothetical growth.
4. Plot Customization
Toggle the main “ETF” plot on/off.
Alter the visual style for tables and text.
Adjust the time filter to limit or extend your performance measurement window.
🚀 HOW TO USE IT
1. Add the Script
Search for “ETF Builder & Backtest System ” in the Indicators & Strategies tab or manually add it to your chart after saving it in your Pine Editor.
2. Configure Inputs
Enable Time Filter : Choose whether to restrict the analysis to a particular date range.
Start & End Date : Define the period you want to measure performance over (e.g., from 2019-12-31 to 2025-01-01).
Assets & Weights : Enter each symbol and specify a percentage weight (up to 10 assets).
Display Options : Pick where you want the Table to appear and choose background/text colors.
3. Interpret the Table & Plots
Asset Rows : Each asset’s ticker, weighting, start price, and performance metrics.
ETF Total Row : Summarizes total weighting, composite starting value, and overall returns.
Normalized Plot : Tracks growth/decline of the combined portfolio, starting at 100 on the chart.
4. Refine Your Strategy
Compare how different weights or a new mix of assets would have performed over the same period.
Assess if certain assets contribute disproportionately to your returns or volatility.
Use the results to guide allocations in your real trading or paper trading accounts.
❗️LIMITATIONS
1. Buy & Hold Only
This script does not handle rebalancing or partial divestments. Once the portfolio starts, weights remain fixed throughout the chosen timeframe.
2. No Reinvestment Tracking
Dividends or other distributions are not factored into performance.
3. Data Availability
If historical data for a particular asset is unavailable on TradingView, related results may display as “N/A.”
4. Market Regimes & Volatility
Past performance does not guarantee similar future behavior. Markets can change rapidly, which may render historical backtests less predictive over time.
⚠️ RISK DISCLAIMER
Trading and investing carry significant risk and can result in financial loss. The “ETF Builder & Backtest System ” is provided for informational and educational purposes only. It does not constitute financial advice.
Always conduct your own research.
Use proper risk management and position sizing.
Past performance does not guarantee future results.
This script is an original creation by TradeDots, published under the Mozilla Public License 2.0.
Use this indicator as part of a broader trading or investment approach—consider fundamental and technical factors, overall market context, and personal risk tolerance. No trading tool can assure profits; exercise caution and responsibility in all financial decisions.

Volatility Regime Classifier | ATRP Percentile ZonesThis indicator helps you understand the current volatility environment of any asset by comparing recent ATR-based values to its historical range.
It defines four regimes:
🔴 Low Volatility: Volatility is decreasing
🟢 Normal: Volatility is increasing but still below average
🟠 High: Volatility is elevated
🟣 Extreme: Volatility is very high compared to recent history
⚙️ How it works
We calculate the Average True Range (ATR) as a percentage of price (ATRP), then compare a short-term ATR to a longer-term one. Their difference shows whether volatility is picking up or slowing down.
To make the signal more adaptive, we look at the distribution of recent volatility over a rolling window. We compute the 50th and 70th percentiles of that history to set dynamic thresholds.
About distribution & percentiles
Volatility in financial markets doesn't follow a normal (Gaussian) distribution, it's often skewed, with sudden spikes and fat tails. That means fixed thresholds (like "ATR > 20") can be misleading or irrelevant across assets and timeframes.
Using percentiles solves this:
The 50th percentile marks the middle of the recent volatility range.
The 70th percentile captures a zone where volatility is unusually high, but not too rare, which keeps the signal usable and not overly sensitive.
These levels offer a balance:
⚖️ not too reactive, not too slow — just enough to highlight meaningful shifts.
✅ Use cases
Spot changes in market conditions
Filter or adapt strategies depending on the regime
Adjust position sizing and risk dynamically

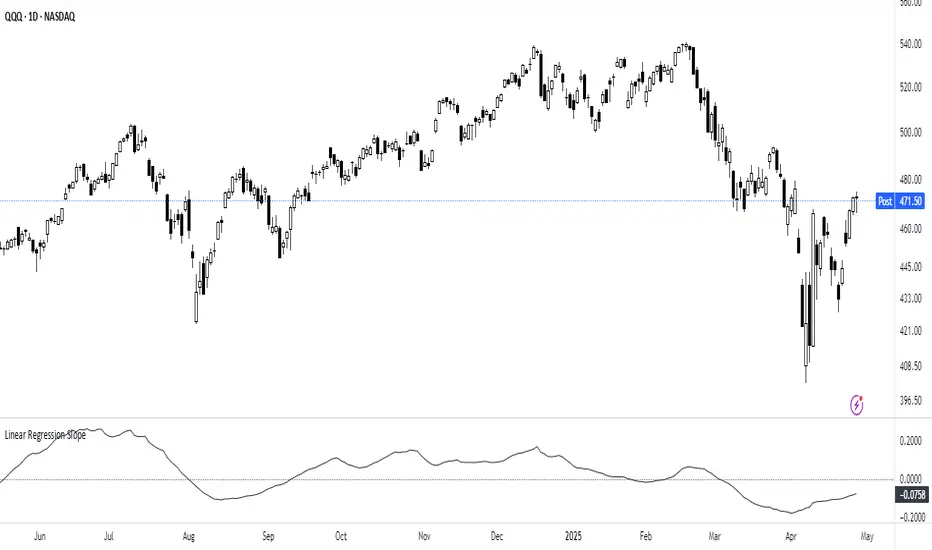
Linear Regression Slope The Linear Regression Slope provides a quantitative measure of trend direction. It fits a linear regression line to the past N closing prices and calculates the slope, representing the average rate of price change per bar.
To ensure comparability across assets and timeframes, the slope is normalized by the ATR over a shorter window. This produces a volatility-adjusted measure which allows for the slope to be interpreted relative to typical price fluctuations.
Mathematically, the slope is derived by minimizing the sum of squared deviations between actual prices and the fitted regression line. A positive normalized slope indicate upwards movement; a negative slope indicate downwards movement. Persistent values near zero could indicate an absence of clear trend, with price dominated by short-term fluctuations or noise.
The definition of a trend depends on the period of observation. The lookback setting should be set based on to the desired timeframe. Shorter lookbacks will respond faster to recent changes but may be more sensitive to noise, while longer lookbacks will emphasize broader structures.
While effective at quantifying existing trends, this method is not predictive. Sudden regime changes, volatility shocks, and non-linear dynamics can all cause rapid slope reversals. Therefore, it is best applied as part of a broader analytical framework.
In summary, the Linear Regression Slope quantifies price direction and serves as a measurable supplement to the visual assessment of trends on price charts.
Additional Features:
Option to display or hide the normalized slope line.
Option to enable background coloring when the slope is above or below zero.
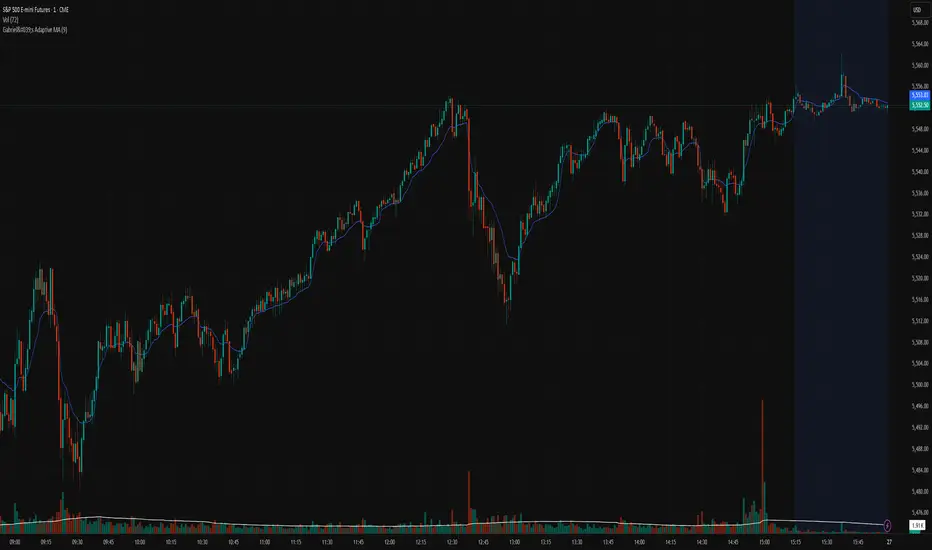
Gabriel's Adaptive MA📜 Gabriel's Adaptive MA — Indicator Description
Gabriel's Adaptive Moving Average (GAMA) is a dynamic trend-following indicator that intelligently adjusts its smoothing based on both trend strength and market volatility.
It is designed to provide faster responsiveness during strong moves while maintaining stability during choppy or consolidating periods.
🧠 What it does:
This indicator plots a custom-built, highly dynamic Moving Average that adapts itself intelligently based on:
Trend Strength (via Perry Kaufman's Efficiency Ratio)
Market Volatility (via Tushar Chande's Volatility Ratio)
It reacts faster when the market is trending strongly and/or highly volatile,
and it smooths out and slows down when the market is choppy or calm.
🔍 How it works (step-by-step):
1. User Inputs:
length: (default 14)
How many bars to look back for calculations.
fastSC: Fastest possible smoothing constant (hardcoded as 2 / (2+1))
slowSC: Slowest possible smoothing constant (hardcoded as 2 / (30+1))
(These are used to control how fast/slow the KAMA can react.)
2. Calculate Trendiness — Kaufman Efficiency Ratio (ER):
Net Change = Absolute difference between current close and close from length bars ago.
Sum of Absolute Changes = Sum of absolute price changes between every bar inside the length window.
Efficiency Ratio (ER) = Net Change divided by Sum of Changes.
✅ If ER is close to 1 → Smooth, trending market.
✅ If ER is close to 0 → Choppy, sideways market.
3. Calculate Bumpiness — Volatility Ratio (VR):
Short-Term Volatility = Standard deviation of close over length.
Long-Term Volatility = Standard deviation of close over length * 2.
Volatility Ratio (VR) = Short-Term Volatility divided by Long-Term Volatility.
✅ If VR is >1 → Market is becoming more volatile recently.
✅ If VR is <1 → Market is calming down.
4. Create the Hybrid Alpha:
Multiply ER × VR.
Then square the result (math.pow(..., 2)).
This hybrid alpha decides how aggressive the MA should be based on both trend and volatility.
If ER and VR are both strong → big alpha → fast movement.
If ER and/or VR are weak → small alpha → slow movement.
5. Calculate the Final Adaptive Smoothing Constant (hybridSC):
hybridSC = slowSC + hybridAlpha × (fastSC - slowSC)
This smoothly interpolates between the slowest and fastest smoothing depending on market conditions.
6. Calculate and Plot the Adaptive MA:
The moving average is manually calculated:
hybridMA := na(hybridMA ) ? close : hybridMA + hybridSC * (close - hybridMA )
It behaves like an EMA but with dynamic smoothing, not a fixed alpha.
✅ If hybridSC is high → MA hugs the price closely.
✅ If hybridSC is low → MA stays smooth and resists noise.
Finally, it plots this Adaptive MA on the chart in blue color.
📊 Visual Summary
Market Type What Happens to GAMA
Trending hard + volatile Follows price quickly
Trending hard + calm Follows steadily but carefully
Sideways + volatile Reacts carefully (won't chase noise)
Sideways + calm Smooths heavily (avoids fakeouts)
✨ Main Strengths:
Adapts automatically without you tuning settings manually every time market changes.
Responds smartly to both trend quality (ER) and market energy (VR).
Reduces lag during real moves.
Filters out false signals during choppy mess.
🧪 Key Innovation compared to normal MAs:
Traditional MA Gabriel's Adaptive MA
Same smoothing every bar Dynamic smoothing every bar
Slow during fast moves Adapts fast during real moves
No understanding of volatility or trendiness Full market sensitivity
⚡ **Simple One-Line Description:**
"Gabriel's Adaptive MA is a dynamic, trend-and-volatility-sensitive moving average that intelligently adjusts its speed to match market conditions."
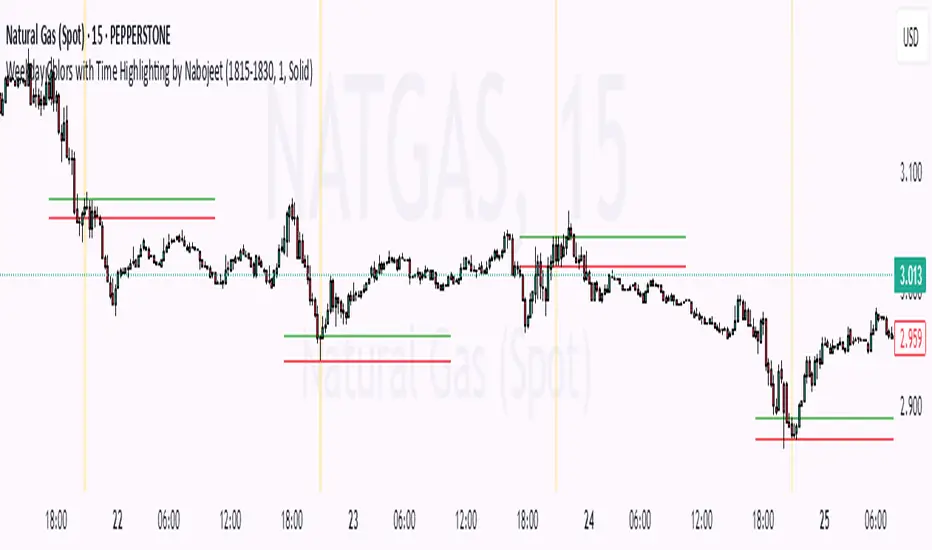
Weekday Colors with Time Highlighting by NabojeetThis script is a Pine Script (version 6) indicator called "Weekday Colors with Time Highlighting" designed for TradingView charts. It has several key functions:
1. **Weekday Color Coding**:
- Assigns different background colors to each trading day (Monday through Friday)
- Allows users to customize the color for each day
- Includes toggles to enable/disable colors for specific days
2. **Time Range Highlighting**:
- Highlights a specific time period (e.g., 18:15-18:30) on every trading day
- Uses a custom color that can be adjusted by the user
- The time range is specified in HHMM-HHMM format
3. **High/Low Line Drawing**:
- Automatically identifies the highest high and lowest low points within the specified time range
- Draws horizontal lines at these levels when the time period ends
- Lines extend forward in time to serve as support/resistance references
- Users can customize the line color, width, and style (solid, dotted, or dashed)
The script is organized into logical sections with input parameters grouped by function (Weekday Colors, Weekday Display, Time Highlighting, and Horizontal Lines). Each section's inputs are customizable through the indicator settings panel.
This indicator would be particularly useful for traders who:
- Want visual distinction between different trading days
- Focus on specific time periods each day (like market opens, closes, or specific sessions)
- Use intraday support/resistance levels from key time periods
- Want to quickly identify session highs and lows
The implementation resets tracking variables at the beginning of each new time range and draws the lines once the time period ends, ensuring accurate high/low marking for each day's specified time window.
Author - Nabojeet
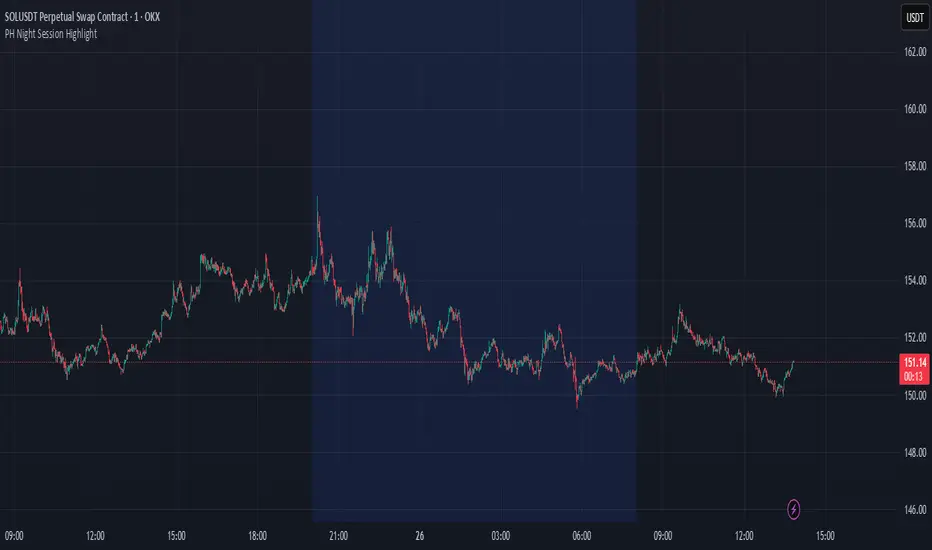
PH Night Session HighlightTraders who want to visually separate the night session on their charts. It highlights the period from 8:01 PM to 7:59 AM (Philippine Time), making it easy to distinguish off-hours or pre-market activity, especially when analyzing crypto or 24/7 markets.
The script automatically adjusts server time (UTC) to Philippine Time (UTC+8) and overlays a soft blue background during the specified time window.
SuperZweig thrust (<= 30 dias)SuperZweig Thrust (≤ 30-day breadth trigger)
This study tracks the classic Zweig Breadth Thrust pattern, but restricts valid signals to a 30-bar (≈ 30-trading-day) window.
---
What it plots
| Plot | Meaning |
|------|---------|
| **Blue line** – `EMA10` | 10-bar exponential moving average of the _breadth ratio_:`advancing issues / (advancing + declining)` |
| **Red h-line 0.35** | Oversold threshold ( < 0.35 ) |
| **Green h-line 0.64** | Overbought threshold ( > 0.64 ) |
| **Red “×”** | The moment EMA10 crosses **down** through 0.35 |
| **Green “●”** | The moment EMA10 crosses **up** through 0.64 |
| **Green “BUY” label** | Complete Super-Zweig thrust: red × followed by green ● **within 30 daily bars** |
Signal logic
1. **Trigger phase** – when EMA10 drops below 0.35
*Script starts a 30-bar countdown.*
2. **Confirmation phase** – if, while the countdown is active, EMA10 rises above 0.64:
*A single “BUY” label is plotted beneath that bar.*
3. **Expiry** – if 30 bars elapse without the 0.64 cross, the cycle resets; no signal is produced.
4. After any valid “BUY” the cycle also resets, so a new signal requires a fresh cross < 0.35.
Inputs
* **EMA length** – default 10.
* **Advancing / Declining symbols** – default `ADVS` / `DECS` (NYSE issues); can be pointed to any Exchange-specific or custom breadth tickers.
Typical use
Apply on a **daily chart** of a broad index (e.g., S&P; 500).
A printed “BUY” indicates a historically rare surge in market breadth often associated with durable rallies. Combine with other risk-management and trend filters before trading.

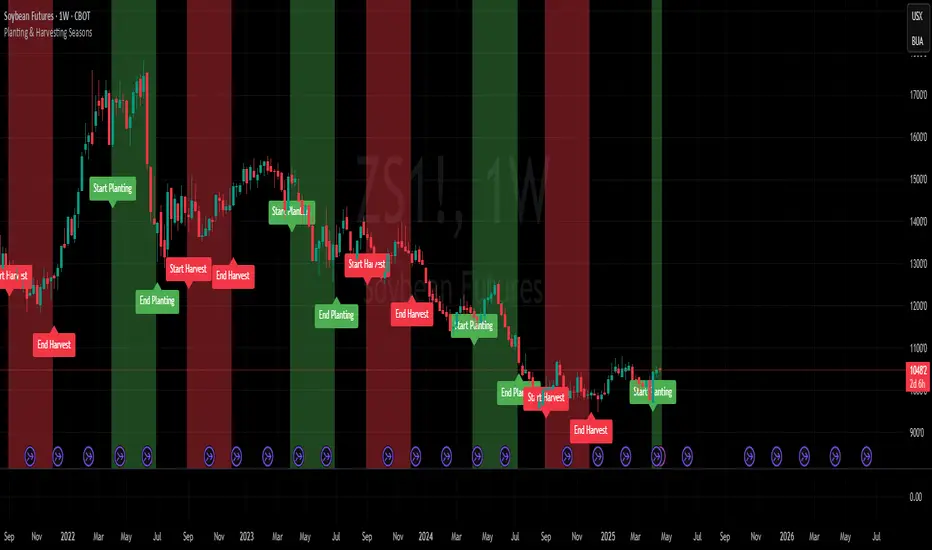
Planting & Harvesting SeasonsHello all,
as a commodity trader, I use a lot of seasonal patterns in my analysis. Some time ago, I came up with the idea to develop a simple script that visually overlays the typical planting and harvesting periods for key agricultural futures directly on the chart.
This script automatically detects the underlying commodity based on the symbol (e.g. ZC, ZW, ZS, CT) and displays color-coded zones for each seasonal window. These zones are based on historical crop calendars and help identify when planting or harvesting typically takes place. The goal is to better align technical setups with fundamental seasonal factors.
This is a basic version and meant as a visual aid — not a trading signal in itself.
Hope you enjoy it and any feedback is highly appreciated!
TDO & Hit Rates by Weekday (5 min)Purpose
Tracks how often the next NY session “hits” the previous day’s True Day Open (TDO) level, separately for sessions that open above vs. below TDO, and breaks the statistics down by weekday (Mon–Fri) plus an overall summary.
Key Features
True Day Open (TDO) Plot
Captures the prior day’s 23:00 CT close price as the TDO.
Plots it as a continuous yellow line across your chart.
Session Labeling
At the end of each NY session (08:30–15:00 CT), places a small “TDO” label at the TDO price to confirm visually where it lay during that day.
Hit‑Count Logic
For each 5 min bar in the NY session, checks if the bar’s high ≥ TDO ≥ low (i.e. the TDO level was “hit”).
Classifies each session by whether its opening price (first 5 min bar) was above or below the TDO.
Weekday Statistics Table
Displays in the bottom‑left of your main chart window.
Rows: Header, Mon, Tue, Wed, Thu, Fri, All.
Columns:
% Hit Above: % of “above‑TDO” sessions that saw at least one hit
% Hit Below: % of “below‑TDO” sessions that saw at least one hit
Automatically updates in real time as new sessions complete.
Inputs & Settings
Data Resolution: Default = 5 min; use any intraday timeframe you like (1, 3, 15 min, etc.).
Extended Hours: Make sure your chart’s Extended Session (overnight) is enabled so the 23:00 CT bar exists.
Overlay: Draws directly on your price chart (no separate pane).
How to Use
Add to Chart: Paste the Pine v5 code into TradingView’s editor and apply to your ES (or other) futures chart.
Enable Overnight Bars: In Chart Settings → Symbol/Session → include Extended Hours.
Select Timeframe: Set the chart (or the indicator’s “Data Resolution” input) to 5 min (or your preferred intraday).
Read the Table:
Each weekday row shows how reliable TDO touches have been historically, separately for “above” and “below” opens.
The bottom “All” row summarizes combined performance.
What You Learn
Edge Analysis: Do sessions opening above TDO tend to test that level more often than those opening below (or vice versa)?
Day‑of‑Week Bias: Are certain weekdays more prone to TDO retests?
Overall Confidence: The “All” row lets you see your full-sample hit‑rate on both sides.

RSI+Stoch Band Oscillator📈 RSI + Stochastic Band Oscillator
Overview:
The RSI + Stochastic Band Oscillator is a technical indicator that combines the strengths of both the Relative Strength Index (RSI) and the Stochastic Oscillator. Instead of using static thresholds, this indicator dynamically constructs upper and lower bands based on the RSI and Stochastic overbought/oversold zones. It then measures the relative position of the current price within this adaptive range, effectively producing a normalized oscillator.
Key Components:
RSI-Based Dynamic Bands:
Using RSI values and exponential moving averages of price changes, upper and lower dynamic bands are constructed.
These bands adjust based on overbought and oversold levels, offering a more responsive framework than fixed RSI thresholds.
Stochastic-Based Dynamic Bands:
Similarly, Stochastic %K and %D values are used to construct dynamic bands.
These adapt to overbought and oversold levels by recalculating potential high/low values within the lookback window.
Oscillator Calculation:
The oscillator (osc) is computed as the relative position of the current close within the combined upper and lower bands of both RSI and Stochastic.
This value is normalized between 0 and 100, allowing clear identification of extreme conditions.
Visual Features:
The oscillator is plotted as a line between 0 and 100.
Color-filled areas highlight when the oscillator enters extreme zones:
Above 100 with falling momentum: Red zone (potential reversal).
Below 0 with rising momentum: Green zone (potential reversal).
Additional trend conditions (falling/rising RSI, %K, and %D) are used to strengthen reversal signals by confirming momentum shifts.

HG StdDevThe HG StdDev indicator provides a dynamic view of market volatility by calculating the standard deviation of a selected price source over a customizable period. Additionally, it plots a threshold line representing the highest standard deviation over a secondary lookback window.
Red Line: Current standard deviation (volatility) of the price.
Gray Line: Highest standard deviation value within the lookback range, serving as a reference for recent peak volatility.
Use this tool to identify periods of increasing or extreme volatility, potential breakout zones, or to filter signals based on volatility thresholds.

RSI and CCICombined RSI and CCI Indicator for MetaTrader
The Combined RSI and CCI Indicator is a powerful hybrid momentum oscillator designed to merge the strengths of two popular indicators—the Relative Strength Index (RSI) and the Commodity Channel Index (CCI)—into a single, visually intuitive chart window. This tool enhances traders’ ability to identify overbought and oversold conditions, divergences, trend strength, and potential reversal zones with improved precision.
Purpose
By integrating RSI and CCI, this indicator helps filter out false signals that often occur when using each tool independently. It is especially useful for swing trading, trend confirmation, and spotting high-probability entry/exit zones. This dual-oscillator approach combines RSI’s relative momentum insights with CCI’s deviation-based analysis to produce a more reliable signal structure.
Key Features
Dual Oscillator Display: Plots both RSI and CCI on the same subwindow for easy comparison and correlation analysis.
Customizable Parameters:
RSI Period and Level (default: 14)
CCI Period and Typical Price Type (default: 20, TP)
Overbought/Oversold Levels for both indicators
Color-Coded Zones:
Background highlights when both RSI and CCI enter overbought/oversold territory, signaling high potential reversal zones.
Combined Signal Logic (Optional Feature):
Buy Signal: RSI < 30 and CCI < -100
Sell Signal: RSI > 70 and CCI > 100
These can be visualized as arrows or plotted as signal markers.
Trend Filter Overlay (Optional):
Can be combined with a moving average or price action filter to confirm trend direction before accepting signals.
Divergence Detection (Advanced Option):
Optional plotting of bullish or bearish divergence where both indicators diverge from price action.
Multi-Timeframe Compatibility:
Allows the use of higher timeframe RSI/CCI values to confirm signals on lower timeframes.
Benefits
Improved Signal Accuracy: Using both RSI and CCI together helps avoid false breakouts and whipsaws.
More Informed Decision-Making: Correlating momentum (RSI) with deviation (CCI) provides a well-rounded picture of market behavior.
Efficient Charting: Saves screen space and cognitive load by combining two indicators into one clean panel.
Scalable Strategy Integration: Can be used in discretionary trading or coded into automated strategies/alerts.
Use Case Example
In a ranging market, the indicator highlights zones where both RSI and CCI are oversold, alerting traders to potential bounce opportunities.
In trending markets, it confirms trend strength when RSI and CCI are both aligned with trend direction.
When RSI is diverging from price but CCI isn’t, it can be a clue of weakening momentum, helping traders scale out or avoid traps.
This combined indicator offers a versatile, high-performance toolset for traders looking to elevate their technical analysis by leveraging multiple momentum perspectives simultaneously.

Advanced OHLC ExporterThis Pine Script indicator provides one-click export of candlestick data (OHLC + Volume) from any TradingView chart. It displays the current candle's values in a clean table while ensuring all visible historical data is available for export in CSV format.
Key Features
📊 Visual Data Display
Real-time OHLC table in the top-right corner.
Color-coded values for quick analysis (green=high, red=low).
Volume shown in standardized formatting.
Data Export Ready
All plotted values appear in TradingView's Data Window.
Right-click → "Export Data" to save:
Open, High, Low, Close (OHLC) prices
Trading volume
Timestamps for each candle
⚙️ Customizable Output
Works on any timeframe (1m to 1M)
Compatible with: Forex, Stocks, Crypto, Futures
How Traders Use This
Technical Analysts - Export clean datasets for external analysis.
Backtesters - Quickly gather historical price data for strategy development.
Researchers - Study candlestick patterns with precise numerical data.

Rolling ATR Momentum - EnhancedATR Rolling Momentum Indicator – User Manual
---
🔍 Overview
The ATR Rolling Momentum Indicator is a dynamic volatility tool built on the Average True Range (ATR). It not only tracks increasing or decreasing momentum but also provides early warnings and confirmation signals for potential breakout moves. It’s especially powerful for futures and options traders looking to align with expanding price action.
---
📊 Core Components
✅ ATR Delta (Rolling ATR)
- Definition: Difference between current ATR and past ATR (user-defined lookback).
- Use: Tells whether volatility is expanding (positive delta) or contracting (negative delta).
- Visual: Green line for rising momentum, red for declining.
🟣 ATR Delta Slope
- Definition: Measures acceleration in momentum.
- Use: Helps identify early signs of breakout buildup.
- Visual: Purple line. Watch for slope turning up from below.
🟡 Volatility Squeeze (Yellow Dot)
- Definition: Current ATR is significantly lower than its 20-period average.
- Use: Indicates the market is coiling—possible breakout ahead.
🔼 Momentum Start (Green Triangle)
- Definition: ATR Delta slope turns from negative to positive.
- Use: Early warning to prepare for volatility expansion.
🔷 Breakout Confirmation (Blue Label Up)
- Definition: ATR Delta exceeds its high of the last 10 candles.
- Use: Confirms volatility breakout—trade opportunity if direction aligns.
🟩/🟥 Background Color
- Green Background: Momentum rising (positive ATR delta)
- Red Background: Momentum falling (negative ATR delta)
- Yellow Tint: Active squeeze zone
---
✅ How to Use It (Futures/Options Focus)
Step-by-Step:
1. Squeeze Detected (Yellow Dot) → Stay alert. Market is coiling.
2. Green Triangle Appears → Momentum is starting to rise.
3. Background Turns Green → Confirmed rising momentum.
4. Blue Label Appears → Confirmed breakout (enter trade if trend aligns).
Directional Bias:
- Use your main chart setup (price action, EMAs, trendlines, etc.) to decide direction (Call or Put, Long or Short).
- ATR Momentum only tells you how strong the move is—not which way.
---
⚙️ Inputs & Settings
- ATR Period: Default 14 (core volatility measure)
- Rolling Lookback: Used to calculate delta (default 5)
- Slope Length: Used to measure acceleration (default 3)
- Squeeze Factor: Default 0.8 — lower = more sensitive squeeze detection
- Breakout Lookback: Checks ATR delta against last X bars (default 10)
---
🧠 Pro Tips
- Works great when paired with EMA stacks, price structure, or breakout patterns.
- Avoid taking trades based only on squeeze or momentum—combine with chart confirmation.
- If background turns red after a breakout, it may be losing momentum—book partials or tighten stops.
---
🧭 Ideal For:
- Nifty/BankNifty Futures
- Option directional trades (call/put buying)
- Index scalping and momentum swing setups
---
Use this tool as your volatility compass—it won't tell you where to go, but it'll tell you when the wind is strong enough to move fast.
End of Manual

Daily ProtractorDaily Protractor Indicator
Overview
The Daily Protractor is a visually intuitive tool designed for traders who want to analyze price action through angular measurements on a 5-minute chart. By overlaying a protractor on the chart, this indicator helps identify potential support, resistance, and trend directions based on angular relationships from the first 5-minute candle of each day. It’s particularly useful for intraday traders looking to incorporate geometric analysis into their strategies for spot or strike charts.
Key Features
Dynamic Protractor Overlay: Draws a protractor centered on the low of the first 5-minute candle of each day, with customizable radius in both bars (horizontal) and price units (vertical).
Angular Measurements: Displays angles in 5-degree increments, covering a full 360° circle or a 105° to -105° (91° to 269°) half-circle, depending on user preference.
Customizable Display:
Adjust the number of days to display protractors (up to 5 days).
Customize line colors for different angle ranges (0° to 180°, 180° to 360°, and 0° specifically).
Modify line thickness, label size, and label colors for better visibility.
Center Point Highlight: Marks the center of each protractor with a labeled point for easy reference.
Efficient Design:
Optimized with max_lines_count, max_labels_count, and max_bars_back to ensure smooth performance on TradingView.
How It Works
The indicator identifies the first 5-minute candle of each day and uses its low price as the center point for a protractor. It then draws lines at 5-degree intervals, radiating from the center, with each line representing an angle from 0° to 360°. Labels at the end of each line display the angle in degrees, with negative values shown for angles between 195° and 345° (e.g., 270° is displayed as -90°). The protractor’s radius can be adjusted in both time (bars) and price units, allowing traders to scale the tool to their chart’s characteristics.
Usage Instructions
Add to Chart:
Apply the indicator to a 5-minute chart of your chosen instrument (e.g., spot or strike charts).
Interpret the Protractor:
Use the angular lines to identify potential price levels or trend directions.
The 0° line (horizontal) can act as a reference for horizontal support/resistance.
Angles between 0° and 180° (upper half) and 180° and 360° (lower half) are color-coded for quick identification.
Customize Settings:
Toggle the Show 105° to -105° option to display a half-circle (91° to 269°) instead of a full 360° protractor.
Adjust the Radius in Bars and Radius in Price Units to scale the protractor to your chart.
Set the Maximum Days to Display to control how many daily protractors are shown.
Modify line thickness, colors, and label settings to suit your visual preferences.
Customization Options
Protractor Settings:
Show 105° to -105° (91° to 269°): Toggle between a full circle or a half-circle protractor.
Radius in Bars: Set the horizontal span of the protractor (default: 75 bars).
Radius in Price Units: Set the vertical span in price units (default: 1000.0).
Maximum Days to Display: Limit the number of protractors shown (default: 5 days).
Line Settings:
Line Thickness: Adjust the thickness of the protractor lines (1 or 2).
Line Color (0° to 180°): Color for the upper half (default: light blue).
Line Color (180° to 360°): Color for the lower half (default: light red).
Line Color (0°): Color for the 0° line (default: black).
Label Settings:
Label Size: Choose between small, normal, or large labels.
Label Color (0° to 180°): Color for labels in the upper half (default: red).
Label Color (180° to 360°): Color for labels in the lower half (default: green).
Notes
The indicator was designed with the help of Grok3 for use on 5-minute charts only, as it relies on the first 5-minute candle of the day to set the protractor’s center.
For best results, adjust the radius settings to match the volatility and price scale of your instrument. However, where the price is in single digits it is advised to switch off the labels or I would suggest not to use the same.
The protractor can be used alongside other technical tools to confirm trends, reversals, or key price levels.
Limitations: This cannot be used on instruments that trade for more than 75 candles with a timeframe of 5 minutes as the angles would not cover the entire trading window. I am working coming up with a script to address this limitation.
Feedback
I’d love to hear your thoughts! If you find the Daily Protractor helpful or have suggestions for improvements, please leave a comment or reach out. Happy trading!

[3Commas] Turtle StrategyTurtle Strategy
🔷 What it does: This indicator implements a modernized version of the Turtle Trading Strategy, designed for trend-following and automated trading with webhook integration. It identifies breakout opportunities using Donchian channels, providing entry and exit signals.
Channel 1: Detects short-term breakouts using the highest highs and lowest lows over a set period (default 20).
Channel 2: Acts as a confirmation filter by applying an offset to the same period, reducing false signals.
Exit Channel: Functions as a dynamic stop-loss (wait for candle close), adjusting based on market structure (default 10 periods).
Additionally, traders can enable a fixed Take Profit level, ensuring a systematic approach to profit-taking.
🔷 Who is it for:
Trend Traders: Those looking to capture long-term market moves.
Bot Users: Traders seeking to automate entries and exits with bot integration.
Rule-Based Traders: Operators who prefer a structured, systematic trading approach.
🔷 How does it work: The strategy generates buy and sell signals using a dual-channel confirmation system.
Long Entry: A buy signal is generated when the close price crosses above the previous high of Channel 1 and is confirmed by Channel 2.
Short Entry: A sell signal occurs when the close price falls below the previous low of Channel 1, with confirmation from Channel 2.
Exit Management: The Exit Channel acts as a trailing stop, dynamically adjusting to price movements. To exit the trade, wait for a full bar close.
Optional Take Profit (%): Closes trades at a predefined %.
🔷 Why it’s unique:
Modern Adaptation: Updates the classic Turtle Trading Strategy, with the possibility of using a second channel with an offset to filter the signals.
Dynamic Risk Management: Utilizes a trailing Exit Channel to help protect gains as trades move favorably.
Bot Integration: Automates trade execution through direct JSON signal communication with your DCA Bots.
🔷 Considerations Before Using the Indicator:
Market & Timeframe: Best suited for trending markets; higher timeframes (e.g., H4, D1) are recommended to minimize noise.
Sideways Markets: In choppy conditions, breakouts may lead to false signals—consider using additional filters.
Backtesting & Demo Testing: It is crucial to thoroughly backtest the strategy and run it on a demo account before risking real capital.
Parameter Adjustments: Ensure that commissions, slippage, and position sizes are set accurately to reflect real trading conditions.
🔷 STRATEGY PROPERTIES
Symbol: BINANCE:ETHUSDT (Spot).
Timeframe: 4h.
Test Period: All historical data available.
Initial Capital: 10000 USDT.
Order Size per Trade: 1% of Capital, you can use a higher value e.g. 5%, be cautious that the Max Drawdown does not exceed 10%, as it would indicate a very risky trading approach.
Commission: Binance commission 0.1%, adjust according to the exchange being used, lower numbers will generate unrealistic results. By using low values e.g. 5%, it allows us to adapt over time and check the functioning of the strategy.
Slippage: 5 ticks, for pairs with low liquidity or very large orders, this number should be increased as the order may not be filled at the desired level.
Margin for Long and Short Positions: 100%.
Indicator Settings: Default Configuration.
Period Channel 1: 20.
Period Channel 2: 20.
Period Channel 2 Offset: 20.
Period Exit: 10.
Take Profit %: Disable.
Strategy: Long & Short.
🔷 STRATEGY RESULTS
⚠️Remember, past results do not guarantee future performance.
Net Profit: +516.87 USDT (+5.17%).
Max Drawdown: -100.28 USDT (-0.95%).
Total Closed Trades: 281.
Percent Profitable: 40.21%.
Profit Factor: 1.704.
Average Trade: +1.84 USDT (+1.80%).
Average # Bars in Trades: 29.
🔷 How to Use It:
🔸 Adjust Settings:
Select your asset and timeframe suited for trend trading.
Adjust the periods for Channel 1, Channel 2, and the Exit Channel to align with the asset’s historical behavior. You can visualize these channels by going to the Style tab and enabling them.
For example, if you set Channel 2 to 40 with an offset of 40, signals will take longer to appear but will aim for a more defined trend.
Experiment with different values, a possible exit configuration is using 20 as well. Compare the results and adjust accordingly.
Enable the Take Profit (%) option if needed.
🔸Results Review:
It is important to check the Max Drawdown. This value should ideally not exceed 10% of your capital. Consider adjusting the trade size to ensure this threshold is not surpassed.
Remember to include the correct values for commission and slippage according to the symbol and exchange where you are conducting the tests. Otherwise, the results will not be realistic.
If you are satisfied with the results, you may consider automating your trades. However, it is strongly recommended to use a small amount of capital or a demo account to test proper execution before committing real funds.
🔸Create alerts to trigger the DCA Bot:
Verify Messages: Ensure the message matches the one specified by the DCA Bot.
Multi-Pair Configuration: For multi-pair setups, enable the option to add the symbol in the correct format.
Signal Settings: Enable the option to receive long or short signals (Entry | TP | SL), copy and paste the messages for the DCA Bots configured.
Alert Setup:
When creating an alert, set the condition to the indicator and choose "alert() function call only".
Enter any desired Alert Name.
Open the Notifications tab, enable Webhook URL, and paste the Webhook URL.
For more details, refer to the section: "How to use TradingView Custom Signals".
Finalize Alerts: Click Create, you're done! Alerts will now be sent automatically in the correct format.
🔷 INDICATOR SETTINGS
Period Channel 1: Period of highs and lows to trigger signals
Period Channel 2: Period of highs and lows to filter signals
Offset: Move Channel 2 to the right x bars to try to filter out the favorable signals.
Period Exit: It is the period of the Donchian channel that is used as trailing for the exits.
Strategy: Order Type direction in which trades are executed.
Take Profit %: When activated, the entered value will be used as the Take Profit in percentage from the entry price level.
Use Custom Test Period: When enabled signals only works in the selected time window. If disabled it will use all historical data available on the chart.
Test Start and End: Once the Custom Test Period is enabled, here you select the start and end date that you want to analyze.
Check Messages: Check Messages: Enable this option to review the messages that will be sent to the bot.
Entry | TP | SL: Enable this options to send Buy Entry, Take Profit (TP), and Stop Loss (SL) signals.
Deal Entry and Deal Exit: Copy and paste the message for the deal start signal and close order at Market Price of the DCA Bot. This is the message that will be sent with the alert to the Bot, you must verify that it is the same as the bot so that it can process properly.
DCA Bot Multi-Pair: You must activate it if you want to use the signals in a DCA Bot Multi-pair in the text box you must enter (using the correct format) the symbol in which you are creating the alert, you can check the format of each symbol when you create the bot.
👨🏻💻💭 We hope this tool helps enhance your trading. Your feedback is invaluable, so feel free to share any suggestions for improvements or new features you'd like to see implemented.
__
The information and publications within the 3Commas TradingView account are not meant to be and do not constitute financial, investment, trading, or other types of advice or recommendations supplied or endorsed by 3Commas and any of the parties acting on behalf of 3Commas, including its employees, contractors, ambassadors, etc.
