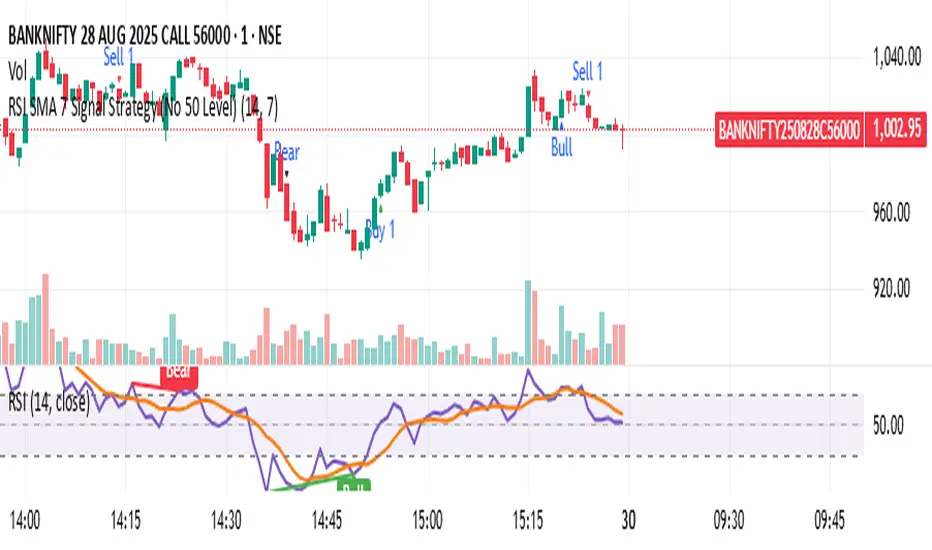
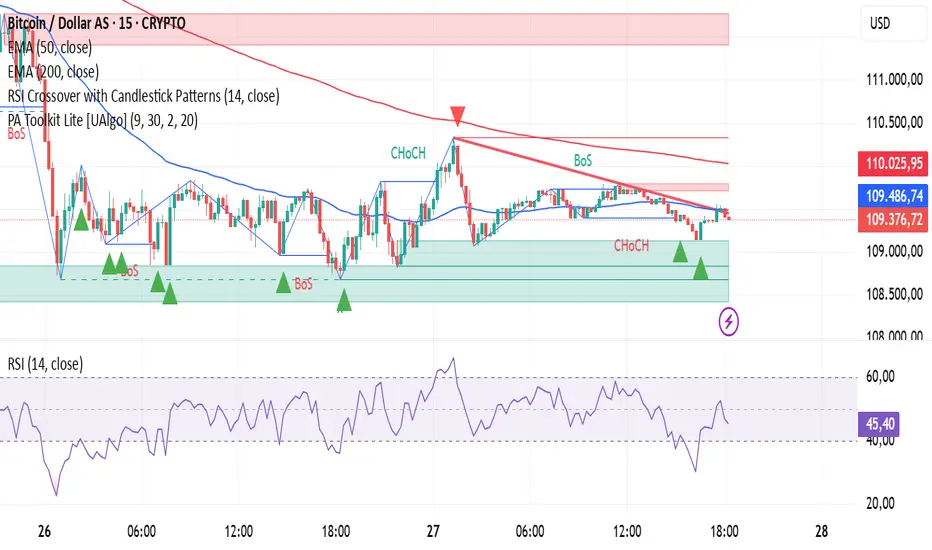
RSI Crossover with Candlestick Patternsusing the RSI indicator levels 40 and 60, where the signal cuts above level 40 with a candlestick hammer or bull engulfing and cuts below level 60 with a candlestick inverter hammer or bearish engulfing.
在腳本中搜尋"市值60亿的股票"
Stochastic [Paifc0de]Stochastic — clean stochastic oscillator with visual masking, neutral markers, and basic filters
What it does
This indicator plots a standard stochastic oscillator (%K with smoothing and %D) and adds practical quality-of-life features for lower timeframes: optional visual masking when %K hugs overbought/oversold, neutral K–D cross markers, session-gated edge triangles (K crossing 20/80), and simple filters (minimum %K slope, minimum |K–D| gap, optional %D slope agreement, mid-zone mute, and a cooldown between markers). Display values are clamped to 0–100 to keep the panel scale stable. The tool is for research/education and does not generate entries/exits or financial advice.
Default preset: 20 / 10 / 10
K Length = 20
Classic lookback used in many textbooks. On intraday charts it balances responsiveness and stability: short enough to react to momentum shifts, long enough to avoid constant whipsaws. In practice it captures ~the last 20 bars’ position of close within the high–low range.
K Smoothing = 10
A 10-period SMA applied to the raw %K moderates the “saw-tooth” effect that raw stochastic can exhibit in choppy phases. The smoothing reduces over-reaction to micro spikes while preserving the main rhythm of swings; visually, %K becomes a continuous path that is easier to read.
D Length = 10
%D is the moving average of smoothed %K. With 10, %D becomes a clearly slower guide line. The larger separation between %K(10-SMA) and %D(10-SMA of %K) produces cleaner crosses and fewer spurious toggles than micro settings (e.g., 3/3/3). On M5–M15 this pair often yields readable cross cycles without flooding the chart.
How the 20/10/10 trio behaves
In persistent trends, %K will spend more time near 20 or 80; the 10-period smoothing delays flips slightly and emphasizes only meaningful turn attempts.
In ranges, %K oscillates around mid-zone (40–60). With 10/10 smoothing, cross signals cluster less densely; combining with the |K–D| gap filter helps keep only decisive crosses.
If your symbol is unusually volatile or illiquid, reduce K Length (e.g., 14) or reduce K Smoothing (e.g., 7) to keep responsiveness. If crosses feel late, decrease D Length (e.g., 7). If noise is excessive, increase K Smoothing first, then consider raising D Length.
Visuals
OB/OS lines: default 80/20 reference levels and a midline at 50.
Masking near edges: %K can be temporarily hidden when it is pressing an edge, approaching it with low slope, or going nearly flat near the boundary. This keeps the panel readable during “stuck at the edge” phases.
Soft glow (optional): highlights %K’s active path; can be turned off.
Light/Dark palette: quick toggle to match your chart theme.
Scale safety: all plotted values (lines, fills, markers) are clamped to 0–100 to prevent the axis from expanding beyond the stochastic range.
Markers and filters
Neutral K–D cross markers: circles in the mid-zone when %K crosses %D.
Edge triangles: show when %K crosses 20 or 80; can be restricted to a session window (02:00–12:00 ET).
Filters (optional):
Min %K slope: require a minimum absolute slope so very flat crosses are ignored.
Min |K–D| gap: demand separation between lines at the cross moment.
%D slope agreement: keep crosses that align with %D’s direction.
Mid-zone mute: suppress crosses inside a user-defined 40–60 band (defaults).
Cooldown: minimum bars between successive markers.
Parameters (quick guide)
K Length / K Smoothing / D Length: core stochastic settings. Start with 20/10/10; tune K Smoothing first if you see too much jitter.
Overbought / Oversold (80/20): adjust for assets that tend to trend (raise to 85/15) or mean-revert (lower to 75/25).
Slope & gap filters: increase on very noisy symbols; reduce if you miss too many crosses.
Session window (triangles only): use if you want edge markers only during active hours.
Marker size and offset: cosmetic; they do not affect calculations.
Alerts
K–D Cross Up (filtered) and K–D Cross Down (filtered): fire when a cross passes your filters/cooldown.
Edge Up / Edge Down: fire when %K crosses the 20/80 levels.
All alerts confirm on bar close.
Notes & attribution
Original implementation and integration by Paifc0de; no third-party code is copied.
This indicator is for research/education and does not provide entries/exits or financial advice.

DynamoSent DynamoSent Pro+ — Professional Listing (Preview)
— Adaptive Macro Sentiment (v6)
— Export, Adaptive Lookback, Confidence, Boxes, Heatmap + Dynamic OB/OS
Preview / Experimental build. I’m actively refining this tool—your feedback is gold.
If you spot edge cases, want new presets, or have market-specific ideas, please comment or DM me on TradingView.
⸻
What it is
DynamoSent Pro+ is an adaptive, non-repainting macro sentiment engine that compresses VIX, DXY and a price-based activity proxy (e.g., SPX/sector ETF/your symbol) into a 0–100 sentiment line. It scales context by volatility (ATR%) and can self-calibrate with rolling quantile OB/OS. On top of that, it adds confidence scoring, a plain-English Context Coach, MTF agreement, exportable sentiment for other indicators, and a clean Light/Dark UI.
Why it’s different
• Adaptive lookback tracks regime changes: when volatility rises, we lengthen context; when it falls, we shorten—less whipsaw, more relevance.
• Dynamic OB/OS (quantiles) self-calibrates to each instrument’s distribution—no arbitrary 30/70 lines.
• MTF agreement + Confidence gate reduce false positives by highlighting alignment across timeframes.
• Exportable output: hidden plot “DynamoSent Export” can be selected as input.source in your other Pine scripts.
• Non-repainting rigor: all request.security() calls use lookahead_off + gaps_on; signals wait for bar close.
Key visuals
• Sentiment line (0–100), OB/OS zones (static or dynamic), optional TF1/TF2 overlays.
• Regime boxes (Overbought / Oversold / Neutral) that update live without repaint.
• Info Panel with confidence heat, regime, trend arrow, MTF readout, and Coach sentence.
• Session heat (Asia/EU/US) to match intraday behavior.
• Light/Dark theme switch in Inputs (auto-contrasted labels & headers).
⸻
How to use (examples & recipes)
1) EURUSD (swing / intraday blend)
• Preset: EURUSD 1H Swing
• Chart: 1H; TF1=1H, TF2=4H (default).
• Proxies: Defaults work (VIX=D, DXY=60, Proxy=D).
• Dynamic OB/OS: ON at 20/80; Confidence ≥ 55–60.
• Playbook:
• When sentiment crosses above 50 + margin with Δ ≥ signalK and MTF agreement ≥ 0.5, treat as trend breakout.
• In Oversold with rising Coach & TF agreement, take fade longs back toward mid-range.
• Alerts: Enable Breakout Long/Short and Fade; keep cooldown 8–12 bars.
2) SPY (daytrading)
• Preset: SPY 15m Daytrade; Chart: 15m.
• VIX (D) matters more; preset weights already favor it.
• Start with static 30/70; later try dynamic 25/75 for adaptive thresholds.
• Use Coach: in US session, when it says “Overbought + MTF agree → sell rallies / chase breakouts”, lean momentum-continuation after pullbacks.
3) BTCUSD (crypto, 24/7)
• Preset: BTCUSD 1H; Chart: 1H.
• DXY and BTC.D inform macro tone; keep Carry-forward ON to bridge sparse ticks.
• Prefer Dynamic OB/OS (15/85) for wider swings.
• Fade signals on weekend chop; Breakout when Confidence > 60 and MTF ≥ 1.0.
4) XAUUSD (gold, macro blend)
• Preset: XAUUSD 4H; Chart: 4H.
• Weights tilt to DXY and US10Y (handled by preset).
• Coach + MTF helps separate trend legs from news pops.
⸻
Best practices
• Theme: Switch Light/Dark in Inputs; the panel adapts contrast automatically.
• Export: In another script → Source → DynamoSent Pro+ → DynamoSent Export. Build your own filters/strategies atop the same sentiment.
• Dynamic vs Static OB/OS:
• Static 30/70: fast, universal baseline.
• Dynamic (quantiles): instrument-aware; use 20/80 (default) or 15/85 for choppy markets.
• Confidence gate: Start at 50–60% to filter noise; raise when you want only A-grade setups.
• Adaptive Lookback: Keep ON. For ultra-liquid indices, you can switch it OFF and set a fixed lookback.
⸻
Non-repainting & safety notes
• All request.security() calls use lookahead=barmerge.lookahead_off and gaps=barmerge.gaps_on.
• No forward references; signals & regime flips are confirmed on bar close.
• History-dependent funcs (ta.change, ta.percentile_linear_interpolation, etc.) are computed each bar (not conditionally).
• Adaptive lookback is clamped ≥ 1 to avoid lowest/highest errors.
• Missing-data warning triggers only when all proxies are NA for a streak; carry-forward can bridge small gaps without repaint.
⸻
Known limits & tips
• If a proxy symbol isn’t available on your plan/exchange, you’ll see the NA warning: choose a different symbol via Symbol Search, or keep Carry-forward ON (it defaults to neutral where needed).
• Intraday VIX is sparse—using Daily is intentional.
• Dynamic OB/OS needs enough history (see dynLenFloor). On short histories it gracefully falls back to static levels.
Thanks for trying the preview. Your comments drive the roadmap—presets, new proxies, extra alerts, and integrations.

Trading Activity Index (Zeiierman)█ Overview
Trading Activity Index (Zeiierman) is a volume-based market activity meter that transforms dollar-volume into a smooth, normalized “activity index.”
It highlights when market participation is unusually low or high with a dynamic color gradient:
Light Blue → Low Activity (thin participation, low liquidity conditions)
Red/Orange → High Activity (active markets, large trades flowing in)
Additional percentile bands (20/40/60/80%) give context, helping you see whether the current activity level is in the bottom quintile, mid-range, or near historical extremes.
█ How It Works
⚪ Dollar Volume Transformation
Each bar, dollar volume is computed:
float dlrVol = close * volume
float dlrVolAvg = ta.sma(dlrVol, len_form)
Dollar volume = price × volume, smoothed by a configurable SMA window.
The result is log-transformed, compressing large outliers for a more stable signal.
⚪ Rolling Percentiles & Ranking
The log-dollar-volume series is compared to its rolling history (len_hist bars):
float p20 = ta.percentile_linear_interpolation(vscale, len_hist, 20)
float p40 = ta.percentile_linear_interpolation(vscale, len_hist, 40)
float p60 = ta.percentile_linear_interpolation(vscale, len_hist, 60)
float p80 = ta.percentile_linear_interpolation(vscale, len_hist, 80)
A normalized rank (0–1) is produced to color the main Trading Activity line.
█ How to Use
⚪ Detect High-Impact Sessions
Quickly see if today’s session is active or quiet relative to its own history — great for filtering setups that need activity.
⚪ Spot Breakouts & Traps
Combine with price action:
High activity near breakouts = strong follow-through likely.
Low activity breakouts = vulnerable to fake-outs.
⚪ Market Regime Context
Percentile bands help you assess whether participation is building up, in the middle of the range, or drying out — valuable for timing mean-reversion trades.
Above 80th percentile (red/orange) → Market is highly active, breakout trades and trend strategies are favored.
Below 20th percentile (light blue) → Market is quiet; fade moves or wait for expansion.
Watch transitions from blue → orange as a signal of growing institutional participation.
█ Settings
Formation Window (bars) – Number of bars used to average dollar volume before log transform.
History Window (bars) – Lookback period for percentile calculations and rank normalization.
-----------------
Disclaimer
The content provided in my scripts, indicators, ideas, algorithms, and systems is for educational and informational purposes only. It does not constitute financial advice, investment recommendations, or a solicitation to buy or sell any financial instruments. I will not accept liability for any loss or damage, including without limitation any loss of profit, which may arise directly or indirectly from the use of or reliance on such information.
All investments involve risk, and the past performance of a security, industry, sector, market, financial product, trading strategy, backtest, or individual's trading does not guarantee future results or returns. Investors are fully responsible for any investment decisions they make. Such decisions should be based solely on an evaluation of their financial circumstances, investment objectives, risk tolerance, and liquidity needs.

Bar Index & TimeLibrary to convert a bar index to a timestamp and vice versa.
Utilizes runtime memory to store the 𝚝𝚒𝚖𝚎 and 𝚝𝚒𝚖𝚎_𝚌𝚕𝚘𝚜𝚎 values of every bar on the chart (and optional future bars), with the ability of storing additional custom values for every chart bar.
█ PREFACE
This library aims to tackle some problems that pine coders (from beginners to advanced) often come across, such as:
I'm trying to draw an object with a 𝚋𝚊𝚛_𝚒𝚗𝚍𝚎𝚡 that is more than 10,000 bars into the past, but this causes my script to fail. How can I convert the 𝚋𝚊𝚛_𝚒𝚗𝚍𝚎𝚡 to a UNIX time so that I can draw visuals using xloc.bar_time ?
I have a diagonal line drawing and I want to get the "y" value at a specific time, but line.get_price() only accepts a bar index value. How can I convert the timestamp into a bar index value so that I can still use this function?
I want to get a previous 𝚘𝚙𝚎𝚗 value that occurred at a specific timestamp. How can I convert the timestamp into a historical offset so that I can use 𝚘𝚙𝚎𝚗 ?
I want to reference a very old value for a variable. How can I access a previous value that is older than the maximum historical buffer size of 𝚟𝚊𝚛𝚒𝚊𝚋𝚕𝚎 ?
This library can solve the above problems (and many more) with the addition of a few lines of code, rather than requiring the coder to refactor their script to accommodate the limitations.
█ OVERVIEW
The core functionality provided is conversion between xloc.bar_index and xloc.bar_time values.
The main component of the library is the 𝙲𝚑𝚊𝚛𝚝𝙳𝚊𝚝𝚊 object, created via the 𝚌𝚘𝚕𝚕𝚎𝚌𝚝𝙲𝚑𝚊𝚛𝚝𝙳𝚊𝚝𝚊() function which basically stores the 𝚝𝚒𝚖𝚎 and 𝚝𝚒𝚖𝚎_𝚌𝚕𝚘𝚜𝚎 of every bar on the chart, and there are 3 more overloads to this function that allow collecting and storing additional data. Once a 𝙲𝚑𝚊𝚛𝚝𝙳𝚊𝚝𝚊 object is created, use any of the exported methods:
Methods to convert a UNIX timestamp into a bar index or bar offset:
𝚝𝚒𝚖𝚎𝚜𝚝𝚊𝚖𝚙𝚃𝚘𝙱𝚊𝚛𝙸𝚗𝚍𝚎𝚡(), 𝚐𝚎𝚝𝙽𝚞𝚖𝚋𝚎𝚛𝙾𝚏𝙱𝚊𝚛𝚜𝙱𝚊𝚌𝚔()
Methods to retrieve the stored data for a bar index:
𝚝𝚒𝚖𝚎𝙰𝚝𝙱𝚊𝚛𝙸𝚗𝚍𝚎𝚡(), 𝚝𝚒𝚖𝚎𝙲𝚕𝚘𝚜𝚎𝙰𝚝𝙱𝚊𝚛𝙸𝚗𝚍𝚎𝚡(), 𝚟𝚊𝚕𝚞𝚎𝙰𝚝𝙱𝚊𝚛𝙸𝚗𝚍𝚎𝚡(), 𝚐𝚎𝚝𝙰𝚕𝚕𝚅𝚊𝚛𝚒𝚊𝚋𝚕𝚎𝚜𝙰𝚝𝙱𝚊𝚛𝙸𝚗𝚍𝚎𝚡()
Methods to retrieve the stored data at a number of bars back (i.e., historical offset):
𝚝𝚒𝚖𝚎(), 𝚝𝚒𝚖𝚎𝙲𝚕𝚘𝚜𝚎(), 𝚟𝚊𝚕𝚞𝚎()
Methods to retrieve all the data points from the earliest bar (or latest bar) stored in memory, which can be useful for debugging purposes:
𝚐𝚎𝚝𝙴𝚊𝚛𝚕𝚒𝚎𝚜𝚝𝚂𝚝𝚘𝚛𝚎𝚍𝙳𝚊𝚝𝚊(), 𝚐𝚎𝚝𝙻𝚊𝚝𝚎𝚜𝚝𝚂𝚝𝚘𝚛𝚎𝚍𝙳𝚊𝚝𝚊()
Note: the library's strong suit is referencing data from very old bars in the past, which is especially useful for scripts that perform its necessary calculations only on the last bar.
█ USAGE
Step 1
Import the library. Replace with the latest available version number for this library.
//@version=6
indicator("Usage")
import n00btraders/ChartData/
Step 2
Create a 𝙲𝚑𝚊𝚛𝚝𝙳𝚊𝚝𝚊 object to collect data on every bar. Do not declare as `var` or `varip`.
chartData = ChartData.collectChartData() // call on every bar to accumulate the necessary data
Step 3
Call any method(s) on the 𝙲𝚑𝚊𝚛𝚝𝙳𝚊𝚝𝚊 object. Do not modify its fields directly.
if barstate.islast
int firstBarTime = chartData.timeAtBarIndex(0)
int lastBarTime = chartData.time(0)
log.info("First `time`: " + str.format_time(firstBarTime) + ", Last `time`: " + str.format_time(lastBarTime))
█ EXAMPLES
• Collect Future Times
The overloaded 𝚌𝚘𝚕𝚕𝚎𝚌𝚝𝙲𝚑𝚊𝚛𝚝𝙳𝚊𝚝𝚊() functions that accept a 𝚋𝚊𝚛𝚜𝙵𝚘𝚛𝚠𝚊𝚛𝚍 argument can additionally store time values for up to 500 bars into the future.
//@version=6
indicator("Example `collectChartData(barsForward)`")
import n00btraders/ChartData/1
chartData = ChartData.collectChartData(barsForward = 500)
var rectangle = box.new(na, na, na, na, xloc = xloc.bar_time, force_overlay = true)
if barstate.islast
int futureTime = chartData.timeAtBarIndex(bar_index + 100)
int lastBarTime = time
box.set_lefttop(rectangle, lastBarTime, open)
box.set_rightbottom(rectangle, futureTime, close)
box.set_text(rectangle, "Extending box 100 bars to the right. Time: " + str.format_time(futureTime))
• Collect Custom Data
The overloaded 𝚌𝚘𝚕𝚕𝚎𝚌𝚝𝙲𝚑𝚊𝚛𝚝𝙳𝚊𝚝𝚊() functions that accept a 𝚟𝚊𝚛𝚒𝚊𝚋𝚕𝚎𝚜 argument can additionally store custom user-specified values for every bar on the chart.
//@version=6
indicator("Example `collectChartData(variables)`")
import n00btraders/ChartData/1
var map variables = map.new()
variables.put("open", open)
variables.put("close", close)
variables.put("open-close midpoint", (open + close) / 2)
variables.put("boolean", open > close ? 1 : 0)
chartData = ChartData.collectChartData(variables = variables)
var fgColor = chart.fg_color
var table1 = table.new(position.top_right, 2, 9, color(na), fgColor, 1, fgColor, 1, true)
var table2 = table.new(position.bottom_right, 2, 9, color(na), fgColor, 1, fgColor, 1, true)
if barstate.isfirst
table.cell(table1, 0, 0, "ChartData.value()", text_color = fgColor)
table.cell(table2, 0, 0, "open ", text_color = fgColor)
table.merge_cells(table1, 0, 0, 1, 0)
table.merge_cells(table2, 0, 0, 1, 0)
for i = 1 to 8
table.cell(table1, 0, i, text_color = fgColor, text_halign = text.align_left, text_font_family = font.family_monospace)
table.cell(table2, 0, i, text_color = fgColor, text_halign = text.align_left, text_font_family = font.family_monospace)
table.cell(table1, 1, i, text_color = fgColor)
table.cell(table2, 1, i, text_color = fgColor)
if barstate.islast
for i = 1 to 8
float open1 = chartData.value("open", 5000 * i)
float open2 = i < 3 ? open : -1
table.cell_set_text(table1, 0, i, "chartData.value(\"open\", " + str.tostring(5000 * i) + "): ")
table.cell_set_text(table2, 0, i, "open : ")
table.cell_set_text(table1, 1, i, str.tostring(open1))
table.cell_set_text(table2, 1, i, open2 >= 0 ? str.tostring(open2) : "Error")
• xloc.bar_index → xloc.bar_time
The 𝚝𝚒𝚖𝚎 value (or 𝚝𝚒𝚖𝚎_𝚌𝚕𝚘𝚜𝚎 value) can be retrieved for any bar index that is stored in memory by the 𝙲𝚑𝚊𝚛𝚝𝙳𝚊𝚝𝚊 object.
//@version=6
indicator("Example `timeAtBarIndex()`")
import n00btraders/ChartData/1
chartData = ChartData.collectChartData()
if barstate.islast
int start = bar_index - 15000
int end = bar_index - 100
// line.new(start, close, end, close) // !ERROR - `start` value is too far from current bar index
start := chartData.timeAtBarIndex(start)
end := chartData.timeAtBarIndex(end)
line.new(start, close, end, close, xloc.bar_time, width = 10)
• xloc.bar_time → xloc.bar_index
Use 𝚝𝚒𝚖𝚎𝚜𝚝𝚊𝚖𝚙𝚃𝚘𝙱𝚊𝚛𝙸𝚗𝚍𝚎𝚡() to find the bar that a timestamp belongs to.
If the timestamp falls in between the close of one bar and the open of the next bar,
the 𝚜𝚗𝚊𝚙 parameter can be used to determine which bar to choose:
𝚂𝚗𝚊𝚙.𝙻𝙴𝙵𝚃 - prefer to choose the leftmost bar (typically used for closing times)
𝚂𝚗𝚊𝚙.𝚁𝙸𝙶𝙷𝚃 - prefer to choose the rightmost bar (typically used for opening times)
𝚂𝚗𝚊𝚙.𝙳𝙴𝙵𝙰𝚄𝙻𝚃 (or 𝚗𝚊) - copies the same behavior as xloc.bar_time uses for drawing objects
//@version=6
indicator("Example `timestampToBarIndex()`")
import n00btraders/ChartData/1
startTimeInput = input.time(timestamp("01 Aug 2025 08:30 -0500"), "Session Start Time")
endTimeInput = input.time(timestamp("01 Aug 2025 15:15 -0500"), "Session End Time")
chartData = ChartData.collectChartData()
if barstate.islastconfirmedhistory
int startBarIndex = chartData.timestampToBarIndex(startTimeInput, ChartData.Snap.RIGHT)
int endBarIndex = chartData.timestampToBarIndex(endTimeInput, ChartData.Snap.LEFT)
line1 = line.new(startBarIndex, 0, startBarIndex, 1, extend = extend.both, color = color.new(color.green, 60), force_overlay = true)
line2 = line.new(endBarIndex, 0, endBarIndex, 1, extend = extend.both, color = color.new(color.green, 60), force_overlay = true)
linefill.new(line1, line2, color.new(color.green, 90))
// using Snap.DEFAULT to show that it is equivalent to drawing lines using `xloc.bar_time` (i.e., it aligns to the same bars)
startBarIndex := chartData.timestampToBarIndex(startTimeInput)
endBarIndex := chartData.timestampToBarIndex(endTimeInput)
line.new(startBarIndex, 0, startBarIndex, 1, extend = extend.both, color = color.yellow, width = 3)
line.new(endBarIndex, 0, endBarIndex, 1, extend = extend.both, color = color.yellow, width = 3)
line.new(startTimeInput, 0, startTimeInput, 1, xloc.bar_time, extend.both, color.new(color.blue, 85), width = 11)
line.new(endTimeInput, 0, endTimeInput, 1, xloc.bar_time, extend.both, color.new(color.blue, 85), width = 11)
• Get Price of Line at Timestamp
The pine script built-in function line.get_price() requires working with bar index values. To get the price of a line in terms of a timestamp, convert the timestamp into a bar index or offset.
//@version=6
indicator("Example `line.get_price()` at timestamp")
import n00btraders/ChartData/1
lineStartInput = input.time(timestamp("01 Aug 2025 08:30 -0500"), "Line Start")
chartData = ChartData.collectChartData()
var diagonal = line.new(na, na, na, na, force_overlay = true)
if time <= lineStartInput
line.set_xy1(diagonal, bar_index, open)
if barstate.islastconfirmedhistory
line.set_xy2(diagonal, bar_index, close)
if barstate.islast
int timeOneWeekAgo = timenow - (7 * timeframe.in_seconds("1D") * 1000)
// Note: could also use `timetampToBarIndex(timeOneWeekAgo, Snap.DEFAULT)` and pass the value directly to `line.get_price()`
int barsOneWeekAgo = chartData.getNumberOfBarsBack(timeOneWeekAgo)
float price = line.get_price(diagonal, bar_index - barsOneWeekAgo)
string formatString = "Time 1 week ago: {0,number,#}\n - Equivalent to {1} bars ago\n\n𝚕𝚒𝚗𝚎.𝚐𝚎𝚝_𝚙𝚛𝚒𝚌𝚎(): {2,number,#.##}"
string labelText = str.format(formatString, timeOneWeekAgo, barsOneWeekAgo, price)
label.new(timeOneWeekAgo, price, labelText, xloc.bar_time, style = label.style_label_lower_right, size = 16, textalign = text.align_left, force_overlay = true)
█ RUNTIME ERROR MESSAGES
This library's functions will generate a custom runtime error message in the following cases:
𝚌𝚘𝚕𝚕𝚎𝚌𝚝𝙲𝚑𝚊𝚛𝚝𝙳𝚊𝚝𝚊() is not called consecutively, or is called more than once on a single bar
Invalid 𝚋𝚊𝚛𝚜𝙵𝚘𝚛𝚠𝚊𝚛𝚍 argument in the 𝚌𝚘𝚕𝚕𝚎𝚌𝚝𝙲𝚑𝚊𝚛𝚝𝙳𝚊𝚝𝚊() function
Invalid 𝚟𝚊𝚛𝚒𝚊𝚋𝚕𝚎𝚜 argument in the 𝚌𝚘𝚕𝚕𝚎𝚌𝚝𝙲𝚑𝚊𝚛𝚝𝙳𝚊𝚝𝚊() function
Invalid 𝚕𝚎𝚗𝚐𝚝𝚑 argument in any of the functions that accept a number of bars back
Note: there is no runtime error generated for an invalid 𝚝𝚒𝚖𝚎𝚜𝚝𝚊𝚖𝚙 or 𝚋𝚊𝚛𝙸𝚗𝚍𝚎𝚡 argument in any of the functions. Instead, the functions will assign 𝚗𝚊 to the returned values.
Any other runtime errors are due to incorrect usage of the library.
█ NOTES
• Function Descriptions
The library source code uses Markdown for the exported functions. Hover over a function/method call in the Pine Editor to display formatted, detailed information about the function/method.
//@version=6
indicator("Demo Function Tooltip")
import n00btraders/ChartData/1
chartData = ChartData.collectChartData()
int barIndex = chartData.timestampToBarIndex(timenow)
log.info(str.tostring(barIndex))
• Historical vs. Realtime Behavior
Under the hood, the data collector for this library is declared as `var`. Because of this, the 𝙲𝚑𝚊𝚛𝚝𝙳𝚊𝚝𝚊 object will always reflect the latest available data on realtime updates. Any data that is recorded for historical bars will remain unchanged throughout the execution of a script.
//@version=6
indicator("Demo Realtime Behavior")
import n00btraders/ChartData/1
var map variables = map.new()
variables.put("open", open)
variables.put("close", close)
chartData = ChartData.collectChartData(variables)
if barstate.isrealtime
varip float initialOpen = open
varip float initialClose = close
varip int updateCount = 0
updateCount += 1
float latestOpen = open
float latestClose = close
float recordedOpen = chartData.valueAtBarIndex("open", bar_index)
float recordedClose = chartData.valueAtBarIndex("close", bar_index)
string formatString = "# of updates: {0}\n\n𝚘𝚙𝚎𝚗 at update #1: {1,number,#.##}\n𝚌𝚕𝚘𝚜𝚎 at update #1: {2,number,#.##}\n\n"
+ "𝚘𝚙𝚎𝚗 at update #{0}: {3,number,#.##}\n𝚌𝚕𝚘𝚜𝚎 at update #{0}: {4,number,#.##}\n\n"
+ "𝚘𝚙𝚎𝚗 stored in memory: {5,number,#.##}\n𝚌𝚕𝚘𝚜𝚎 stored in memory: {6,number,#.##}"
string labelText = str.format(formatString, updateCount, initialOpen, initialClose, latestOpen, latestClose, recordedOpen, recordedClose)
label.new(bar_index, close, labelText, style = label.style_label_left, force_overlay = true)
• Collecting Chart Data for Other Contexts
If your use case requires collecting chart data from another context, avoid directly retrieving the 𝙲𝚑𝚊𝚛𝚝𝙳𝚊𝚝𝚊 object as this may exceed memory limits .
//@version=6
indicator("Demo Return Calculated Results")
import n00btraders/ChartData/1
timeInput = input.time(timestamp("01 Sep 2025 08:30 -0500"), "Time")
var int oneMinuteBarsAgo = na
// !ERROR - Memory Limits Exceeded
// chartDataArray = request.security_lower_tf(syminfo.tickerid, "1", ChartData.collectChartData())
// oneMinuteBarsAgo := chartDataArray.last().getNumberOfBarsBack(timeInput)
// function that returns calculated results (a single integer value instead of an entire `ChartData` object)
getNumberOfBarsBack() =>
chartData = ChartData.collectChartData()
chartData.getNumberOfBarsBack(timeInput)
calculatedResultsArray = request.security_lower_tf(syminfo.tickerid, "1", getNumberOfBarsBack())
oneMinuteBarsAgo := calculatedResultsArray.size() > 0 ? calculatedResultsArray.last() : na
if barstate.islast
string labelText = str.format("The selected timestamp occurs 1-minute bars ago", oneMinuteBarsAgo)
label.new(bar_index, hl2, labelText, style = label.style_label_left, size = 16, force_overlay = true)
• Memory Usage
The library's convenience and ease of use comes at the cost of increased usage of computational resources. For simple scripts, using this library will likely not cause any issues with exceeding memory limits. But for large and complex scripts, you can reduce memory issues by specifying a lower 𝚌𝚊𝚕𝚌_𝚋𝚊𝚛𝚜_𝚌𝚘𝚞𝚗𝚝 amount in the indicator() or strategy() declaration statement.
//@version=6
// !ERROR - Memory Limits Exceeded using the default number of bars available (~20,000 bars for Premium plans)
//indicator("Demo `calc_bars_count` parameter")
// Reduce number of bars using `calc_bars_count` parameter
indicator("Demo `calc_bars_count` parameter", calc_bars_count = 15000)
import n00btraders/ChartData/1
map variables = map.new()
variables.put("open", open)
variables.put("close", close)
variables.put("weekofyear", weekofyear)
variables.put("dayofmonth", dayofmonth)
variables.put("hour", hour)
variables.put("minute", minute)
variables.put("second", second)
// simulate large memory usage
chartData0 = ChartData.collectChartData(variables)
chartData1 = ChartData.collectChartData(variables)
chartData2 = ChartData.collectChartData(variables)
chartData3 = ChartData.collectChartData(variables)
chartData4 = ChartData.collectChartData(variables)
chartData5 = ChartData.collectChartData(variables)
chartData6 = ChartData.collectChartData(variables)
chartData7 = ChartData.collectChartData(variables)
chartData8 = ChartData.collectChartData(variables)
chartData9 = ChartData.collectChartData(variables)
log.info(str.tostring(chartData0.time(0)))
log.info(str.tostring(chartData1.time(0)))
log.info(str.tostring(chartData2.time(0)))
log.info(str.tostring(chartData3.time(0)))
log.info(str.tostring(chartData4.time(0)))
log.info(str.tostring(chartData5.time(0)))
log.info(str.tostring(chartData6.time(0)))
log.info(str.tostring(chartData7.time(0)))
log.info(str.tostring(chartData8.time(0)))
log.info(str.tostring(chartData9.time(0)))
if barstate.islast
result = table.new(position.middle_right, 1, 1, force_overlay = true)
table.cell(result, 0, 0, "Script Execution Successful ✅", text_size = 40)
█ EXPORTED ENUMS
Snap
Behavior for determining the bar that a timestamp belongs to.
Fields:
LEFT : Snap to the leftmost bar.
RIGHT : Snap to the rightmost bar.
DEFAULT : Default `xloc.bar_time` behavior.
Note: this enum is used for the 𝚜𝚗𝚊𝚙 parameter of 𝚝𝚒𝚖𝚎𝚜𝚝𝚊𝚖𝚙𝚃𝚘𝙱𝚊𝚛𝙸𝚗𝚍𝚎𝚡().
█ EXPORTED TYPES
Note: users of the library do not need to worry about directly accessing the fields of these types; all computations are done through method calls on an object of the 𝙲𝚑𝚊𝚛𝚝𝙳𝚊𝚝𝚊 type.
Variable
Represents a user-specified variable that can be tracked on every chart bar.
Fields:
name (series string) : Unique identifier for the variable.
values (array) : The array of stored values (one value per chart bar).
ChartData
Represents data for all bars on a chart.
Fields:
bars (series int) : Current number of bars on the chart.
timeValues (array) : The `time` values of all chart (and future) bars.
timeCloseValues (array) : The `time_close` values of all chart (and future) bars.
variables (array) : Additional custom values to track on all chart bars.
█ EXPORTED FUNCTIONS
collectChartData()
Collects and tracks the `time` and `time_close` value of every bar on the chart.
Returns: `ChartData` object to convert between `xloc.bar_index` and `xloc.bar_time`.
collectChartData(barsForward)
Collects and tracks the `time` and `time_close` value of every bar on the chart as well as a specified number of future bars.
Parameters:
barsForward (simple int) : Number of future bars to collect data for.
Returns: `ChartData` object to convert between `xloc.bar_index` and `xloc.bar_time`.
collectChartData(variables)
Collects and tracks the `time` and `time_close` value of every bar on the chart. Additionally, tracks a custom set of variables for every chart bar.
Parameters:
variables (simple map) : Custom values to collect on every chart bar.
Returns: `ChartData` object to convert between `xloc.bar_index` and `xloc.bar_time`.
collectChartData(barsForward, variables)
Collects and tracks the `time` and `time_close` value of every bar on the chart as well as a specified number of future bars. Additionally, tracks a custom set of variables for every chart bar.
Parameters:
barsForward (simple int) : Number of future bars to collect data for.
variables (simple map) : Custom values to collect on every chart bar.
Returns: `ChartData` object to convert between `xloc.bar_index` and `xloc.bar_time`.
█ EXPORTED METHODS
method timestampToBarIndex(chartData, timestamp, snap)
Converts a UNIX timestamp to a bar index.
Namespace types: ChartData
Parameters:
chartData (series ChartData) : The `ChartData` object.
timestamp (series int) : A UNIX time.
snap (series Snap) : A `Snap` enum value.
Returns: A bar index, or `na` if unable to find the appropriate bar index.
method getNumberOfBarsBack(chartData, timestamp)
Converts a UNIX timestamp to a history-referencing length (i.e., number of bars back).
Namespace types: ChartData
Parameters:
chartData (series ChartData) : The `ChartData` object.
timestamp (series int) : A UNIX time.
Returns: A bar offset, or `na` if unable to find a valid number of bars back.
method timeAtBarIndex(chartData, barIndex)
Retrieves the `time` value for the specified bar index.
Namespace types: ChartData
Parameters:
chartData (series ChartData) : The `ChartData` object.
barIndex (int) : The bar index.
Returns: The `time` value, or `na` if there is no `time` stored for the bar index.
method time(chartData, length)
Retrieves the `time` value of the bar that is `length` bars back relative to the latest bar.
Namespace types: ChartData
Parameters:
chartData (series ChartData) : The `ChartData` object.
length (series int) : Number of bars back.
Returns: The `time` value `length` bars ago, or `na` if there is no `time` stored for that bar.
method timeCloseAtBarIndex(chartData, barIndex)
Retrieves the `time_close` value for the specified bar index.
Namespace types: ChartData
Parameters:
chartData (series ChartData) : The `ChartData` object.
barIndex (series int) : The bar index.
Returns: The `time_close` value, or `na` if there is no `time_close` stored for the bar index.
method timeClose(chartData, length)
Retrieves the `time_close` value of the bar that is `length` bars back from the latest bar.
Namespace types: ChartData
Parameters:
chartData (series ChartData) : The `ChartData` object.
length (series int) : Number of bars back.
Returns: The `time_close` value `length` bars ago, or `na` if there is none stored.
method valueAtBarIndex(chartData, name, barIndex)
Retrieves the value of a custom variable for the specified bar index.
Namespace types: ChartData
Parameters:
chartData (series ChartData) : The `ChartData` object.
name (series string) : The variable name.
barIndex (series int) : The bar index.
Returns: The value of the variable, or `na` if that variable is not stored for the bar index.
method value(chartData, name, length)
Retrieves a variable value of the bar that is `length` bars back relative to the latest bar.
Namespace types: ChartData
Parameters:
chartData (series ChartData) : The `ChartData` object.
name (series string) : The variable name.
length (series int) : Number of bars back.
Returns: The value `length` bars ago, or `na` if that variable is not stored for the bar index.
method getAllVariablesAtBarIndex(chartData, barIndex)
Retrieves all custom variables for the specified bar index.
Namespace types: ChartData
Parameters:
chartData (series ChartData) : The `ChartData` object.
barIndex (series int) : The bar index.
Returns: Map of all custom variables that are stored for the specified bar index.
method getEarliestStoredData(chartData)
Gets all values from the earliest bar data that is currently stored in memory.
Namespace types: ChartData
Parameters:
chartData (series ChartData) : The `ChartData` object.
Returns: A tuple:
method getLatestStoredData(chartData, futureData)
Gets all values from the latest bar data that is currently stored in memory.
Namespace types: ChartData
Parameters:
chartData (series ChartData) : The `ChartData` object.
futureData (series bool) : Whether to include the future data that is stored in memory.
Returns: A tuple:

Technical Summary VWAP | RSI | VolatilityTechnical Summary VWAP | RSI | Volatility
The Quantum Trading Matrix is a multi-dimensional market-analysis dashboard designed as an educational and idea-generation tool to help traders read price structure, participation, momentum and volatility in one compact view. It is not an automated execution system; rather, it aggregates lightweight “quantum” signals — VWAP position, momentum oscillator behaviour, multi-EMA trend scoring, volume flow and institutional activity heuristics, market microstructure pivots and volatility measures — and synthesizes them into a single, transparent score and signal recommendation. The primary goal is to make explicit why a given market looks favourable or unfavourable by showing the individual ingredients and how they combine, enabling traders to learn, test and form rules based on observable market mechanics.
Each module of the matrix answers a distinct market question. VWAP and its percentage distance indicate whether the current price is trading above or below the intraday volume-weighted average — a proxy for intraday institutional control and value. The quantum momentum oscillator (fast and slow EMA difference scaled to percent) captures short-to-intermediate momentum shifts, providing a quickly responsive view of directional pressure. Multi-EMA trend scoring (8/21/50) produces a simple, transparent trend score by counting conditions such as price above EMAs and cross-EMAs ordering; this score is used to categorize market trend into descriptive buckets (e.g., STRONG UP, WEAK UP, NEUTRAL, DOWN). Volume analysis compares current volume to a recent moving average and computes a Z-score to detect spikes and unusual participation; additional buy/sell pressure heuristics (buyingPressure, sellingPressure, flowRatio) estimate whether upside or downside participation dominates the bar. Institutional activity is approximated by flagging large orders relative to volume baseline (e.g., volume > 2.5× MA) and estimating a dark pool proxy; this is a heuristic to highlight bars that likely had large players involved.
The dashboard also performs market-structure detection with small pivot windows to identify recent local support/resistance areas and computes price position relative to the daily high/low (dailyMid, pricePosition). Volatility is measured via ATR divided by price and bucketed into LOW/NORMAL/HIGH/EXTREME categories to help you adapt stop sizing and expectational horizons. Finally, all these pieces feed an interpretable scoring function that rewards alignment: VWAP above, strong flow ratio, bullish trend score, bullish momentum, and favorable RSI zone add to the overall score which is presented as a 0–100 metric and a colored emoji indicator for at-a-glance assessment.
The mashup is purposeful: each indicator covers a failure mode of the other. For example, momentum readings can be misleading during volatility spikes; VWAP informs whether institutions are on the bid or offer; volume Z-score detects abnormal participation that can validate a breakout; multi-EMA score mitigates single-EMA whipsaws by requiring a combination of price/EMA conditions. Combining these signals increases information content while keeping each component explainable — a key compliance requirement. The script intentionally emphasizes transparency: when it shows a BUY/SELL/HOLD recommendation, the dashboard shows the underlying sub-components so a trader can see whether VWAP, momentum, volume, trend or structure primarily drove the score.
For practical use, adopt a clear workflow: (1) check the matrix score and read the component tiles (VWAP position, momentum, trend and volume) to understand the drivers; (2) confirm market-structure support/resistance and pricePosition relative to the daily range; (3) require at least two corroborating components (for example, VWAP ABOVE + Momentum BULLISH or Volume spike + Trend STRONG UP) before considering entries; (4) use ATR-based stops or daily pivot distance for stop placement and size positions such that the trade risks a small, pre-defined percent of capital; (5) for intraday scalps shorten holding time and tighten stops, for swing trades increase lookback lengths and require multi-timeframe (higher TF) agreement. Treat the matrix as an idea filter and replay lab: when an alert triggers, replay the bars and observe which components anticipated the move and which lagged.
Parameter tuning matters. Shortening the momentum length makes the oscillator more sensitive (useful for scalping), while lengthening it reduces noise for swing contexts. Volume profile bars and MA length should match the instrument’s liquidity — increase the MA for low-liquidity stocks to reduce false institutional flags. The trend multiplier and signal sensitivity parameters let you calibrate how aggressively the matrix counts micro evidence into the score. Always backtest parameter sets across multiple periods and instruments; run walk-forward tests and keep a simple out-of-sample validation window to reduce overfitting risk.
Limitations and failure modes are explicit: institutional flags and dark-pool estimates are heuristics and cannot substitute for true tape or broker-level order flow; volume split by price range is an approximation and will not perfectly reflect signed volume; pivot detection with small windows may miss larger structural swings; VWAP is typically intraday-centric and less meaningful across multi-day swing contexts; the score is additive and may not capture non-linear relationships between features in extreme market regimes (e.g., flash crashes, circuit breaker events, or overnight gaps). The matrix is also susceptible to false signals during major news releases when price and volume behavior dislocate from typical patterns. Users should explicitly test behavior around earnings, macro data and low-liquidity periods.
To learn with the matrix, perform these experiments: (A) collect all BUY/SELL alerts over a 6-month period and measure median outcome at 5, 20 and 60 bars; (B) require additional gating conditions (e.g., only accept BUY when flowRatio>60 and trendScore≥4) and compare expectancy; (C) vary the institutional threshold (2×, 2.5×, 3× volumeMA) to see how many true positive spikes remain; (D) perform multi-instrument tests to ensure parameters are not tuned to a single ticker. Document every test and prefer robust, slightly lower returns with clearer logic rather than tuned “optimal” results that fail out of sample.
Originality statement: This script’s originality lies in the curated combination of intraday value (VWAP), multi-EMA trend scoring, momentum percent oscillator, volume Z-score plus buy/sell flow heuristics and a compact, interpretable scoring system. The script is not a simple indicator mashup; it is a didactic ensemble specifically designed to make internal rationale visible so traders can learn how each market characteristic contributes to actionable probability. The tool’s novelty is its emphasis on interpretability — showing the exact contributing signals behind a composite score — enabling reproducible testing and educational value.
Finally, for TradingView publication, include a clear description listing the modules, a short non-technical summary of how they interact, the tunable inputs, limitations and a risk disclaimer. Remove any promotional content or external contact links. If you used trademark symbols, either provide registration details or remove them. This transparent documentation satisfies TradingView’s requirement that mashups justify their composition and teach users how to use them.
Quantum Trading Matrix — multi-factor intraday dashboard (educational use only).
Purpose: Combines intraday VWAP position, a fast/slow EMA momentum percent oscillator, multi-EMA trend scoring (8/21/50), volume Z-score and buy/sell flow heuristics, pivot-based microstructure detection, and ATR-based volatility buckets to produce a transparent, componentized market score and trade-idea indicator. The mashup is intentional: VWAP identifies intraday value, momentum detects short bursts, EMAs provide structural trend bias, and volume/flow confirm participation. Signals require alignment of at least two components (for example, VWAP ABOVE + Momentum BULLISH + positive flow) for higher confidence.
Inputs: momentum period, volume MA/profile length, EMA configuration (8/21/50), trend multiplier, signal sensitivity, color and display options. Use shorter momentum lengths for scalps and longer for swing analysis. Increase volume MA for thinly traded instruments.
Limitations: Institutional/dark-pool estimates and flow heuristics are approximations, not actual exchange tape. VWAP is intraday-focused. Expect false signals during major news or low-liquidity sessions. Backtest and paper-trade before applying real capital.
Risk Disclaimer: For education and analysis only. Not financial advice. Use proper risk management. The author is not responsible for trading losses.
________________________________________
Risk & Misuse Disclaimer
This indicator is provided for education, analysis and idea generation only. It is not investment or financial advice and does not guarantee profits. Institutional activity flags, dark-pool estimates and flow heuristics are approximations and should not be treated as exchange tape. Backtest thoroughly and use demo/paper accounts before trading real capital. Always apply appropriate position sizing and stop-loss rules. The author is not responsible for any trading losses resulting from the use or misuse of this tool.
________________________________________
Risk Disclaimer: This tool is provided for education and analysis only. It is not financial advice and does not guarantee returns. Users assume all risk for trades made based on this script. Back test thoroughly and use proper risk management.

ATAI Volume analysis with price action V 1.00ATAI Volume Analysis with Price Action
1. Introduction
1.1 Overview
ATAI Volume Analysis with Price Action is a composite indicator designed for TradingView. It combines per‑side volume data —that is, how much buying and selling occurs during each bar—with standard price‑structure elements such as swings, trend lines and support/resistance. By blending these elements the script aims to help a trader understand which side is in control, whether a breakout is genuine, when markets are potentially exhausted and where liquidity providers might be active.
The indicator is built around TradingView’s up/down volume feed accessed via the TradingView/ta/10 library. The following excerpt from the script illustrates how this feed is configured:
import TradingView/ta/10 as tvta
// Determine lower timeframe string based on user choice and chart resolution
string lower_tf_breakout = use_custom_tf_input ? custom_tf_input :
timeframe.isseconds ? "1S" :
timeframe.isintraday ? "1" :
timeframe.isdaily ? "5" : "60"
// Request up/down volume (both positive)
= tvta.requestUpAndDownVolume(lower_tf_breakout)
Lower‑timeframe selection. If you do not specify a custom lower timeframe, the script chooses a default based on your chart resolution: 1 second for second charts, 1 minute for intraday charts, 5 minutes for daily charts and 60 minutes for anything longer. Smaller intervals provide a more precise view of buyer and seller flow but cover fewer bars. Larger intervals cover more history at the cost of granularity.
Tick vs. time bars. Many trading platforms offer a tick / intrabar calculation mode that updates an indicator on every trade rather than only on bar close. Turning on one‑tick calculation will give the most accurate split between buy and sell volume on the current bar, but it typically reduces the amount of historical data available. For the highest fidelity in live trading you can enable this mode; for studying longer histories you might prefer to disable it. When volume data is completely unavailable (some instruments and crypto pairs), all modules that rely on it will remain silent and only the price‑structure backbone will operate.
Figure caption, Each panel shows the indicator’s info table for a different volume sampling interval. In the left chart, the parentheses “(5)” beside the buy‑volume figure denote that the script is aggregating volume over five‑minute bars; the center chart uses “(1)” for one‑minute bars; and the right chart uses “(1T)” for a one‑tick interval. These notations tell you which lower timeframe is driving the volume calculations. Shorter intervals such as 1 minute or 1 tick provide finer detail on buyer and seller flow, but they cover fewer bars; longer intervals like five‑minute bars smooth the data and give more history.
Figure caption, The values in parentheses inside the info table come directly from the Breakout — Settings. The first row shows the custom lower-timeframe used for volume calculations (e.g., “(1)”, “(5)”, or “(1T)”)
2. Price‑Structure Backbone
Even without volume, the indicator draws structural features that underpin all other modules. These features are always on and serve as the reference levels for subsequent calculations.
2.1 What it draws
• Pivots: Swing highs and lows are detected using the pivot_left_input and pivot_right_input settings. A pivot high is identified when the high recorded pivot_right_input bars ago exceeds the highs of the preceding pivot_left_input bars and is also higher than (or equal to) the highs of the subsequent pivot_right_input bars; pivot lows follow the inverse logic. The indicator retains only a fixed number of such pivot points per side, as defined by point_count_input, discarding the oldest ones when the limit is exceeded.
• Trend lines: For each side, the indicator connects the earliest stored pivot and the most recent pivot (oldest high to newest high, and oldest low to newest low). When a new pivot is added or an old one drops out of the lookback window, the line’s endpoints—and therefore its slope—are recalculated accordingly.
• Horizontal support/resistance: The highest high and lowest low within the lookback window defined by length_input are plotted as horizontal dashed lines. These serve as short‑term support and resistance levels.
• Ranked labels: If showPivotLabels is enabled the indicator prints labels such as “HH1”, “HH2”, “LL1” and “LL2” near each pivot. The ranking is determined by comparing the price of each stored pivot: HH1 is the highest high, HH2 is the second highest, and so on; LL1 is the lowest low, LL2 is the second lowest. In the case of equal prices the newer pivot gets the better rank. Labels are offset from price using ½ × ATR × label_atr_multiplier, with the ATR length defined by label_atr_len_input. A dotted connector links each label to the candle’s wick.
2.2 Key settings
• length_input: Window length for finding the highest and lowest values and for determining trend line endpoints. A larger value considers more history and will generate longer trend lines and S/R levels.
• pivot_left_input, pivot_right_input: Strictness of swing confirmation. Higher values require more bars on either side to form a pivot; lower values create more pivots but may include minor swings.
• point_count_input: How many pivots are kept in memory on each side. When new pivots exceed this number the oldest ones are discarded.
• label_atr_len_input and label_atr_multiplier: Determine how far pivot labels are offset from the bar using ATR. Increasing the multiplier moves labels further away from price.
• Styling inputs for trend lines, horizontal lines and labels (color, width and line style).
Figure caption, The chart illustrates how the indicator’s price‑structure backbone operates. In this daily example, the script scans for bars where the high (or low) pivot_right_input bars back is higher (or lower) than the preceding pivot_left_input bars and higher or lower than the subsequent pivot_right_input bars; only those bars are marked as pivots.
These pivot points are stored and ranked: the highest high is labelled “HH1”, the second‑highest “HH2”, and so on, while lows are marked “LL1”, “LL2”, etc. Each label is offset from the price by half of an ATR‑based distance to keep the chart clear, and a dotted connector links the label to the actual candle.
The red diagonal line connects the earliest and latest stored high pivots, and the green line does the same for low pivots; when a new pivot is added or an old one drops out of the lookback window, the end‑points and slopes adjust accordingly. Dashed horizontal lines mark the highest high and lowest low within the current lookback window, providing visual support and resistance levels. Together, these elements form the structural backbone that other modules reference, even when volume data is unavailable.
3. Breakout Module
3.1 Concept
This module confirms that a price break beyond a recent high or low is supported by a genuine shift in buying or selling pressure. It requires price to clear the highest high (“HH1”) or lowest low (“LL1”) and, simultaneously, that the winning side shows a significant volume spike, dominance and ranking. Only when all volume and price conditions pass is a breakout labelled.
3.2 Inputs
• lookback_break_input : This controls the number of bars used to compute moving averages and percentiles for volume. A larger value smooths the averages and percentiles but makes the indicator respond more slowly.
• vol_mult_input : The “spike” multiplier; the current buy or sell volume must be at least this multiple of its moving average over the lookback window to qualify as a breakout.
• rank_threshold_input (0–100) : Defines a volume percentile cutoff: the current buyer/seller volume must be in the top (100−threshold)%(100−threshold)% of all volumes within the lookback window. For example, if set to 80, the current volume must be in the top 20 % of the lookback distribution.
• ratio_threshold_input (0–1) : Specifies the minimum share of total volume that the buyer (for a bullish breakout) or seller (for bearish) must hold on the current bar; the code also requires that the cumulative buyer volume over the lookback window exceeds the seller volume (and vice versa for bearish cases).
• use_custom_tf_input / custom_tf_input : When enabled, these inputs override the automatic choice of lower timeframe for up/down volume; otherwise the script selects a sensible default based on the chart’s timeframe.
• Label appearance settings : Separate options control the ATR-based offset length, offset multiplier, label size and colors for bullish and bearish breakout labels, as well as the connector style and width.
3.3 Detection logic
1. Data preparation : Retrieve per‑side volume from the lower timeframe and take absolute values. Build rolling arrays of the last lookback_break_input values to compute simple moving averages (SMAs), cumulative sums and percentile ranks for buy and sell volume.
2. Volume spike: A spike is flagged when the current buy (or, in the bearish case, sell) volume is at least vol_mult_input times its SMA over the lookback window.
3. Dominance test: The buyer’s (or seller’s) share of total volume on the current bar must meet or exceed ratio_threshold_input. In addition, the cumulative sum of buyer volume over the window must exceed the cumulative sum of seller volume for a bullish breakout (and vice versa for bearish). A separate requirement checks the sign of delta: for bullish breakouts delta_breakout must be non‑negative; for bearish breakouts it must be non‑positive.
4. Percentile rank: The current volume must fall within the top (100 – rank_threshold_input) percent of the lookback distribution—ensuring that the spike is unusually large relative to recent history.
5. Price test: For a bullish signal, the closing price must close above the highest pivot (HH1); for a bearish signal, the close must be below the lowest pivot (LL1).
6. Labeling: When all conditions above are satisfied, the indicator prints “Breakout ↑” above the bar (bullish) or “Breakout ↓” below the bar (bearish). Labels are offset using half of an ATR‑based distance and linked to the candle with a dotted connector.
Figure caption, (Breakout ↑ example) , On this daily chart, price pushes above the red trendline and the highest prior pivot (HH1). The indicator recognizes this as a valid breakout because the buyer‑side volume on the lower timeframe spikes above its recent moving average and buyers dominate the volume statistics over the lookback period; when combined with a close above HH1, this satisfies the breakout conditions. The “Breakout ↑” label appears above the candle, and the info table highlights that up‑volume is elevated relative to its 11‑bar average, buyer share exceeds the dominance threshold and money‑flow metrics support the move.
Figure caption, In this daily example, price breaks below the lowest pivot (LL1) and the lower green trendline. The indicator identifies this as a bearish breakout because sell‑side volume is sharply elevated—about twice its 11‑bar average—and sellers dominate both the bar and the lookback window. With the close falling below LL1, the script triggers a Breakout ↓ label and marks the corresponding row in the info table, which shows strong down volume, negative delta and a seller share comfortably above the dominance threshold.
4. Market Phase Module (Volume Only)
4.1 Concept
Not all markets trend; many cycle between periods of accumulation (buying pressure building up), distribution (selling pressure dominating) and neutral behavior. This module classifies the current bar into one of these phases without using ATR , relying solely on buyer and seller volume statistics. It looks at net flows, ratio changes and an OBV‑like cumulative line with dual‑reference (1‑ and 2‑bar) trends. The result is displayed both as on‑chart labels and in a dedicated row of the info table.
4.2 Inputs
• phase_period_len: Number of bars over which to compute sums and ratios for phase detection.
• phase_ratio_thresh : Minimum buyer share (for accumulation) or minimum seller share (for distribution, derived as 1 − phase_ratio_thresh) of the total volume.
• strict_mode: When enabled, both the 1‑bar and 2‑bar changes in each statistic must agree on the direction (strict confirmation); when disabled, only one of the two references needs to agree (looser confirmation).
• Color customisation for info table cells and label styling for accumulation and distribution phases, including ATR length, multiplier, label size, colors and connector styles.
• show_phase_module: Toggles the entire phase detection subsystem.
• show_phase_labels: Controls whether on‑chart labels are drawn when accumulation or distribution is detected.
4.3 Detection logic
The module computes three families of statistics over the volume window defined by phase_period_len:
1. Net sum (buyers minus sellers): net_sum_phase = Σ(buy) − Σ(sell). A positive value indicates a predominance of buyers. The code also computes the differences between the current value and the values 1 and 2 bars ago (d_net_1, d_net_2) to derive up/down trends.
2. Buyer ratio: The instantaneous ratio TF_buy_breakout / TF_tot_breakout and the window ratio Σ(buy) / Σ(total). The current ratio must exceed phase_ratio_thresh for accumulation or fall below 1 − phase_ratio_thresh for distribution. The first and second differences of the window ratio (d_ratio_1, d_ratio_2) determine trend direction.
3. OBV‑like cumulative net flow: An on‑balance volume analogue obv_net_phase increments by TF_buy_breakout − TF_sell_breakout each bar. Its differences over the last 1 and 2 bars (d_obv_1, d_obv_2) provide trend clues.
The algorithm then combines these signals:
• For strict mode , accumulation requires: (a) current ratio ≥ threshold, (b) cumulative ratio ≥ threshold, (c) both ratio differences ≥ 0, (d) net sum differences ≥ 0, and (e) OBV differences ≥ 0. Distribution is the mirror case.
• For loose mode , it relaxes the directional tests: either the 1‑ or the 2‑bar difference needs to agree in each category.
If all conditions for accumulation are satisfied, the phase is labelled “Accumulation” ; if all conditions for distribution are satisfied, it’s labelled “Distribution” ; otherwise the phase is “Neutral” .
4.4 Outputs
• Info table row : Row 8 displays “Market Phase (Vol)” on the left and the detected phase (Accumulation, Distribution or Neutral) on the right. The text colour of both cells matches a user‑selectable palette (typically green for accumulation, red for distribution and grey for neutral).
• On‑chart labels : When show_phase_labels is enabled and a phase persists for at least one bar, the module prints a label above the bar ( “Accum” ) or below the bar ( “Dist” ) with a dashed or dotted connector. The label is offset using ATR based on phase_label_atr_len_input and phase_label_multiplier and is styled according to user preferences.
Figure caption, The chart displays a red “Dist” label above a particular bar, indicating that the accumulation/distribution module identified a distribution phase at that point. The detection is based on seller dominance: during that bar, the net buyer-minus-seller flow and the OBV‑style cumulative flow were trending down, and the buyer ratio had dropped below the preset threshold. These conditions satisfy the distribution criteria in strict mode. The label is placed above the bar using an ATR‑based offset and a dashed connector. By the time of the current bar in the screenshot, the phase indicator shows “Neutral” in the info table—signaling that neither accumulation nor distribution conditions are currently met—yet the historical “Dist” label remains to mark where the prior distribution phase began.
Figure caption, In this example the market phase module has signaled an Accumulation phase. Three bars before the current candle, the algorithm detected a shift toward buyers: up‑volume exceeded its moving average, down‑volume was below average, and the buyer share of total volume climbed above the threshold while the on‑balance net flow and cumulative ratios were trending upwards. The blue “Accum” label anchored below that bar marks the start of the phase; it remains on the chart because successive bars continue to satisfy the accumulation conditions. The info table confirms this: the “Market Phase (Vol)” row still reads Accumulation, and the ratio and sum rows show buyers dominating both on the current bar and across the lookback window.
5. OB/OS Spike Module
5.1 What overbought/oversold means here
In many markets, a rapid extension up or down is often followed by a period of consolidation or reversal. The indicator interprets overbought (OB) conditions as abnormally strong selling risk at or after a price rally and oversold (OS) conditions as unusually strong buying risk after a decline. Importantly, these are not direct trade signals; rather they flag areas where caution or contrarian setups may be appropriate.
5.2 Inputs
• minHits_obos (1–7): Minimum number of oscillators that must agree on an overbought or oversold condition for a label to print.
• syncWin_obos: Length of a small sliding window over which oscillator votes are smoothed by taking the maximum count observed. This helps filter out choppy signals.
• Volume spike criteria: kVolRatio_obos (ratio of current volume to its SMA) and zVolThr_obos (Z‑score threshold) across volLen_obos. Either threshold can trigger a spike.
• Oscillator toggles and periods: Each of RSI, Stochastic (K and D), Williams %R, CCI, MFI, DeMarker and Stochastic RSI can be independently enabled; their periods are adjustable.
• Label appearance: ATR‑based offset, size, colors for OB and OS labels, plus connector style and width.
5.3 Detection logic
1. Directional volume spikes: Volume spikes are computed separately for buyer and seller volumes. A sell volume spike (sellVolSpike) flags a potential OverBought bar, while a buy volume spike (buyVolSpike) flags a potential OverSold bar. A spike occurs when the respective volume exceeds kVolRatio_obos times its simple moving average over the window or when its Z‑score exceeds zVolThr_obos.
2. Oscillator votes: For each enabled oscillator, calculate its overbought and oversold state using standard thresholds (e.g., RSI ≥ 70 for OB and ≤ 30 for OS; Stochastic %K/%D ≥ 80 for OB and ≤ 20 for OS; etc.). Count how many oscillators vote for OB and how many vote for OS.
3. Minimum hits: Apply the smoothing window syncWin_obos to the vote counts using a maximum‑of‑last‑N approach. A candidate bar is only considered if the smoothed OB hit count ≥ minHits_obos (for OverBought) or the smoothed OS hit count ≥ minHits_obos (for OverSold).
4. Tie‑breaking: If both OverBought and OverSold spike conditions are present on the same bar, compare the smoothed hit counts: the side with the higher count is selected; ties default to OverBought.
5. Label printing: When conditions are met, the bar is labelled as “OverBought X/7” above the candle or “OverSold X/7” below it. “X” is the number of oscillators confirming, and the bracket lists the abbreviations of contributing oscillators. Labels are offset from price using half of an ATR‑scaled distance and can optionally include a dotted or dashed connector line.
Figure caption, In this chart the overbought/oversold module has flagged an OverSold signal. A sell‑off from the prior highs brought price down to the lower trend‑line, where the bar marked “OverSold 3/7 DeM” appears. This label indicates that on that bar the module detected a buy‑side volume spike and that at least three of the seven enabled oscillators—in this case including the DeMarker—were in oversold territory. The label is printed below the candle with a dotted connector, signaling that the market may be temporarily exhausted on the downside. After this oversold print, price begins to rebound towards the upper red trend‑line and higher pivot levels.
Figure caption, This example shows the overbought/oversold module in action. In the left‑hand panel you can see the OB/OS settings where each oscillator (RSI, Stochastic, Williams %R, CCI, MFI, DeMarker and Stochastic RSI) can be enabled or disabled, and the ATR length and label offset multiplier adjusted. On the chart itself, price has pushed up to the descending red trendline and triggered an “OverBought 3/7” label. That means the sell‑side volume spiked relative to its average and three out of the seven enabled oscillators were in overbought territory. The label is offset above the candle by half of an ATR and connected with a dashed line, signaling that upside momentum may be overextended and a pause or pullback could follow.
6. Buyer/Seller Trap Module
6.1 Concept
A bull trap occurs when price appears to break above resistance, attracting buyers, but fails to sustain the move and quickly reverses, leaving a long upper wick and trapping late entrants. A bear trap is the opposite: price breaks below support, lures in sellers, then snaps back, leaving a long lower wick and trapping shorts. This module detects such traps by looking for price structure sweeps, order‑flow mismatches and dominance reversals. It uses a scoring system to differentiate risk from confirmed traps.
6.2 Inputs
• trap_lookback_len: Window length used to rank extremes and detect sweeps.
• trap_wick_threshold: Minimum proportion of a bar’s range that must be wick (upper for bull traps, lower for bear traps) to qualify as a sweep.
• trap_score_risk: Minimum aggregated score required to flag a trap risk. (The code defines a trap_score_confirm input, but confirmation is actually based on price reversal rather than a separate score threshold.)
• trap_confirm_bars: Maximum number of bars allowed for price to reverse and confirm the trap. If price does not reverse in this window, the risk label will expire or remain unconfirmed.
• Label settings: ATR length and multiplier for offsetting, size, colours for risk and confirmed labels, and connector style and width. Separate settings exist for bull and bear traps.
• Toggle inputs: show_trap_module and show_trap_labels enable the module and control whether labels are drawn on the chart.
6.3 Scoring logic
The module assigns points to several conditions and sums them to determine whether a trap risk is present. For bull traps, the score is built from the following (bear traps mirror the logic with highs and lows swapped):
1. Sweep (2 points): Price trades above the high pivot (HH1) but fails to close above it and leaves a long upper wick at least trap_wick_threshold × range. For bear traps, price dips below the low pivot (LL1), fails to close below and leaves a long lower wick.
2. Close break (1 point): Price closes beyond HH1 or LL1 without leaving a long wick.
3. Candle/delta mismatch (2 points): The candle closes bullish yet the order flow delta is negative or the seller ratio exceeds 50%, indicating hidden supply. Conversely, a bearish close with positive delta or buyer dominance suggests hidden demand.
4. Dominance inversion (2 points): The current bar’s buyer volume has the highest rank in the lookback window while cumulative sums favor sellers, or vice versa.
5. Low‑volume break (1 point): Price crosses the pivot but total volume is below its moving average.
The total score for each side is compared to trap_score_risk. If the score is high enough, a “Bull Trap Risk” or “Bear Trap Risk” label is drawn, offset from the candle by half of an ATR‑scaled distance using a dashed outline. If, within trap_confirm_bars, price reverses beyond the opposite level—drops back below the high pivot for bull traps or rises above the low pivot for bear traps—the label is upgraded to a solid “Bull Trap” or “Bear Trap” . In this version of the code, there is no separate score threshold for confirmation: the variable trap_score_confirm is unused; confirmation depends solely on a successful price reversal within the specified number of bars.
Figure caption, In this example the trap module has flagged a Bear Trap Risk. Price initially breaks below the most recent low pivot (LL1), but the bar closes back above that level and leaves a long lower wick, suggesting a failed push lower. Combined with a mismatch between the candle direction and the order flow (buyers regain control) and a reversal in volume dominance, the aggregate score exceeds the risk threshold, so a dashed “Bear Trap Risk” label prints beneath the bar. The green and red trend lines mark the current low and high pivot trajectories, while the horizontal dashed lines show the highest and lowest values in the lookback window. If, within the next few bars, price closes decisively above the support, the risk label would upgrade to a solid “Bear Trap” label.
Figure caption, In this example the trap module has identified both ends of a price range. Near the highs, price briefly pushes above the descending red trendline and the recent pivot high, but fails to close there and leaves a noticeable upper wick. That combination of a sweep above resistance and order‑flow mismatch generates a Bull Trap Risk label with a dashed outline, warning that the upside break may not hold. At the opposite extreme, price later dips below the green trendline and the labelled low pivot, then quickly snaps back and closes higher. The long lower wick and subsequent price reversal upgrade the previous bear‑trap risk into a confirmed Bear Trap (solid label), indicating that sellers were caught on a false breakdown. Horizontal dashed lines mark the highest high and lowest low of the lookback window, while the red and green diagonals connect the earliest and latest pivot highs and lows to visualize the range.
7. Sharp Move Module
7.1 Concept
Markets sometimes display absorption or climax behavior—periods when one side steadily gains the upper hand before price breaks out with a sharp move. This module evaluates several order‑flow and volume conditions to anticipate such moves. Users can choose how many conditions must be met to flag a risk and how many (plus a price break) are required for confirmation.
7.2 Inputs
• sharp Lookback: Number of bars in the window used to compute moving averages, sums, percentile ranks and reference levels.
• sharpPercentile: Minimum percentile rank for the current side’s volume; the current buy (or sell) volume must be greater than or equal to this percentile of historical volumes over the lookback window.
• sharpVolMult: Multiplier used in the volume climax check. The current side’s volume must exceed this multiple of its average to count as a climax.
• sharpRatioThr: Minimum dominance ratio (current side’s volume relative to the opposite side) used in both the instant and cumulative dominance checks.
• sharpChurnThr: Maximum ratio of a bar’s range to its ATR for absorption/churn detection; lower values indicate more absorption (large volume in a small range).
• sharpScoreRisk: Minimum number of conditions that must be true to print a risk label.
• sharpScoreConfirm: Minimum number of conditions plus a price break required for confirmation.
• sharpCvdThr: Threshold for cumulative delta divergence versus price change (positive for bullish accumulation, negative for bearish distribution).
• Label settings: ATR length (sharpATRlen) and multiplier (sharpLabelMult) for positioning labels, label size, colors and connector styles for bullish and bearish sharp moves.
• Toggles: enableSharp activates the module; show_sharp_labels controls whether labels are drawn.
7.3 Conditions (six per side)
For each side, the indicator computes six boolean conditions and sums them to form a score:
1. Dominance (instant and cumulative):
– Instant dominance: current buy volume ≥ sharpRatioThr × current sell volume.
– Cumulative dominance: sum of buy volumes over the window ≥ sharpRatioThr × sum of sell volumes (and vice versa for bearish checks).
2. Accumulation/Distribution divergence: Over the lookback window, cumulative delta rises by at least sharpCvdThr while price fails to rise (bullish), or cumulative delta falls by at least sharpCvdThr while price fails to fall (bearish).
3. Volume climax: The current side’s volume is ≥ sharpVolMult × its average and the product of volume and bar range is the highest in the lookback window.
4. Absorption/Churn: The current side’s volume divided by the bar’s range equals the highest value in the window and the bar’s range divided by ATR ≤ sharpChurnThr (indicating large volume within a small range).
5. Percentile rank: The current side’s volume percentile rank is ≥ sharp Percentile.
6. Mirror logic for sellers: The above checks are repeated with buyer and seller roles swapped and the price break levels reversed.
Each condition that passes contributes one point to the corresponding side’s score (0 or 1). Risk and confirmation thresholds are then applied to these scores.
7.4 Scoring and labels
• Risk: If scoreBull ≥ sharpScoreRisk, a “Sharp ↑ Risk” label is drawn above the bar. If scoreBear ≥ sharpScoreRisk, a “Sharp ↓ Risk” label is drawn below the bar.
• Confirmation: A risk label is upgraded to “Sharp ↑” when scoreBull ≥ sharpScoreConfirm and the bar closes above the highest recent pivot (HH1); for bearish cases, confirmation requires scoreBear ≥ sharpScoreConfirm and a close below the lowest pivot (LL1).
• Label positioning: Labels are offset from the candle by ATR × sharpLabelMult (full ATR times multiplier), not half, and may include a dashed or dotted connector line if enabled.
Figure caption, In this chart both bullish and bearish sharp‑move setups have been flagged. Earlier in the range, a “Sharp ↓ Risk” label appears beneath a candle: the sell‑side score met the risk threshold, signaling that the combination of strong sell volume, dominance and absorption within a narrow range suggested a potential sharp decline. The price did not close below the lower pivot, so this label remains a “risk” and no confirmation occurred. Later, as the market recovered and volume shifted back to the buy side, a “Sharp ↑ Risk” label prints above a candle near the top of the channel. Here, buy‑side dominance, cumulative delta divergence and a volume climax aligned, but price has not yet closed above the upper pivot (HH1), so the alert is still a risk rather than a confirmed sharp‑up move.
Figure caption, In this chart a Sharp ↑ label is displayed above a candle, indicating that the sharp move module has confirmed a bullish breakout. Prior bars satisfied the risk threshold — showing buy‑side dominance, positive cumulative delta divergence, a volume climax and strong absorption in a narrow range — and this candle closes above the highest recent pivot, upgrading the earlier “Sharp ↑ Risk” alert to a full Sharp ↑ signal. The green label is offset from the candle with a dashed connector, while the red and green trend lines trace the high and low pivot trajectories and the dashed horizontals mark the highest and lowest values of the lookback window.
8. Market‑Maker / Spread‑Capture Module
8.1 Concept
Liquidity providers often “capture the spread” by buying and selling in almost equal amounts within a very narrow price range. These bars can signal temporary congestion before a move or reflect algorithmic activity. This module flags bars where both buyer and seller volumes are high, the price range is only a few ticks and the buy/sell split remains close to 50%. It helps traders spot potential liquidity pockets.
8.2 Inputs
• scalpLookback: Window length used to compute volume averages.
• scalpVolMult: Multiplier applied to each side’s average volume; both buy and sell volumes must exceed this multiple.
• scalpTickCount: Maximum allowed number of ticks in a bar’s range (calculated as (high − low) / minTick). A value of 1 or 2 captures ultra‑small bars; increasing it relaxes the range requirement.
• scalpDeltaRatio: Maximum deviation from a perfect 50/50 split. For example, 0.05 means the buyer share must be between 45% and 55%.
• Label settings: ATR length, multiplier, size, colors, connector style and width.
• Toggles : show_scalp_module and show_scalp_labels to enable the module and its labels.
8.3 Signal
When, on the current bar, both TF_buy_breakout and TF_sell_breakout exceed scalpVolMult times their respective averages and (high − low)/minTick ≤ scalpTickCount and the buyer share is within scalpDeltaRatio of 50%, the module prints a “Spread ↔” label above the bar. The label uses the same ATR offset logic as other modules and draws a connector if enabled.
Figure caption, In this chart the spread‑capture module has identified a potential liquidity pocket. Buyer and seller volumes both spiked above their recent averages, yet the candle’s range measured only a couple of ticks and the buy/sell split stayed close to 50 %. This combination met the module’s criteria, so it printed a grey “Spread ↔” label above the bar. The red and green trend lines link the earliest and latest high and low pivots, and the dashed horizontals mark the highest high and lowest low within the current lookback window.
9. Money Flow Module
9.1 Concept
To translate volume into a monetary measure, this module multiplies each side’s volume by the closing price. It tracks buying and selling system money default currency on a per-bar basis and sums them over a chosen period. The difference between buy and sell currencies (Δ$) shows net inflow or outflow.
9.2 Inputs
• mf_period_len_mf: Number of bars used for summing buy and sell dollars.
• Label appearance settings: ATR length, multiplier, size, colors for up/down labels, and connector style and width.
• Toggles: Use enableMoneyFlowLabel_mf and showMFLabels to control whether the module and its labels are displayed.
9.3 Calculations
• Per-bar money: Buy $ = TF_buy_breakout × close; Sell $ = TF_sell_breakout × close. Their difference is Δ$ = Buy $ − Sell $.
• Summations: Over mf_period_len_mf bars, compute Σ Buy $, Σ Sell $ and ΣΔ$ using math.sum().
• Info table entries: Rows 9–13 display these values as texts like “↑ USD 1234 (1M)” or “ΣΔ USD −5678 (14)”, with colors reflecting whether buyers or sellers dominate.
• Money flow status: If Δ$ is positive the bar is marked “Money flow in” ; if negative, “Money flow out” ; if zero, “Neutral”. The cumulative status is similarly derived from ΣΔ.Labels print at the bar that changes the sign of ΣΔ, offset using ATR × label multiplier and styled per user preferences.
Figure caption, The chart illustrates a steady rise toward the highest recent pivot (HH1) with price riding between a rising green trend‑line and a red trend‑line drawn through earlier pivot highs. A green Money flow in label appears above the bar near the top of the channel, signaling that net dollar flow turned positive on this bar: buy‑side dollar volume exceeded sell‑side dollar volume, pushing the cumulative sum ΣΔ$ above zero. In the info table, the “Money flow (bar)” and “Money flow Σ” rows both read In, confirming that the indicator’s money‑flow module has detected an inflow at both bar and aggregate levels, while other modules (pivots, trend lines and support/resistance) remain active to provide structural context.
In this example the Money Flow module signals a net outflow. Price has been trending downward: successive high pivots form a falling red trend‑line and the low pivots form a descending green support line. When the latest bar broke below the previous low pivot (LL1), both the bar‑level and cumulative net dollar flow turned negative—selling volume at the close exceeded buying volume and pushed the cumulative Δ$ below zero. The module reacts by printing a red “Money flow out” label beneath the candle; the info table confirms that the “Money flow (bar)” and “Money flow Σ” rows both show Out, indicating sustained dominance of sellers in this period.
10. Info Table
10.1 Purpose
When enabled, the Info Table appears in the lower right of your chart. It summarises key values computed by the indicator—such as buy and sell volume, delta, total volume, breakout status, market phase, and money flow—so you can see at a glance which side is dominant and which signals are active.
10.2 Symbols
• ↑ / ↓ — Up (↑) denotes buy volume or money; down (↓) denotes sell volume or money.
• MA — Moving average. In the table it shows the average value of a series over the lookback period.
• Σ (Sigma) — Cumulative sum over the chosen lookback period.
• Δ (Delta) — Difference between buy and sell values.
• B / S — Buyer and seller share of total volume, expressed as percentages.
• Ref. Price — Reference price for breakout calculations, based on the latest pivot.
• Status — Indicates whether a breakout condition is currently active (True) or has failed.
10.3 Row definitions
1. Up volume / MA up volume – Displays current buy volume on the lower timeframe and its moving average over the lookback period.
2. Down volume / MA down volume – Shows current sell volume and its moving average; sell values are formatted in red for clarity.
3. Δ / ΣΔ – Lists the difference between buy and sell volume for the current bar and the cumulative delta volume over the lookback period.
4. Σ / MA Σ (Vol/MA) – Total volume (buy + sell) for the bar, with the ratio of this volume to its moving average; the right cell shows the average total volume.
5. B/S ratio – Buy and sell share of the total volume: current bar percentages and the average percentages across the lookback period.
6. Buyer Rank / Seller Rank – Ranks the bar’s buy and sell volumes among the last (n) bars; lower rank numbers indicate higher relative volume.
7. Σ Buy / Σ Sell – Sum of buy and sell volumes over the lookback window, indicating which side has traded more.
8. Breakout UP / DOWN – Shows the breakout thresholds (Ref. Price) and whether the breakout condition is active (True) or has failed.
9. Market Phase (Vol) – Reports the current volume‑only phase: Accumulation, Distribution or Neutral.
10. Money Flow – The final rows display dollar amounts and status:
– ↑ USD / Σ↑ USD – Buy dollars for the current bar and the cumulative sum over the money‑flow period.
– ↓ USD / Σ↓ USD – Sell dollars and their cumulative sum.
– Δ USD / ΣΔ USD – Net dollar difference (buy minus sell) for the bar and cumulatively.
– Money flow (bar) – Indicates whether the bar’s net dollar flow is positive (In), negative (Out) or neutral.
– Money flow Σ – Shows whether the cumulative net dollar flow across the chosen period is positive, negative or neutral.
The chart above shows a sequence of different signals from the indicator. A Bull Trap Risk appears after price briefly pushes above resistance but fails to hold, then a green Accum label identifies an accumulation phase. An upward breakout follows, confirmed by a Money flow in print. Later, a Sharp ↓ Risk warns of a possible sharp downturn; after price dips below support but quickly recovers, a Bear Trap label marks a false breakdown. The highlighted info table in the center summarizes key metrics at that moment, including current and average buy/sell volumes, net delta, total volume versus its moving average, breakout status (up and down), market phase (volume), and bar‑level and cumulative money flow (In/Out).
11. Conclusion & Final Remarks
This indicator was developed as a holistic study of market structure and order flow. It brings together several well‑known concepts from technical analysis—breakouts, accumulation and distribution phases, overbought and oversold extremes, bull and bear traps, sharp directional moves, market‑maker spread bars and money flow—into a single Pine Script tool. Each module is based on widely recognized trading ideas and was implemented after consulting reference materials and example strategies, so you can see in real time how these concepts interact on your chart.
A distinctive feature of this indicator is its reliance on per‑side volume: instead of tallying only total volume, it separately measures buy and sell transactions on a lower time frame. This approach gives a clearer view of who is in control—buyers or sellers—and helps filter breakouts, detect phases of accumulation or distribution, recognize potential traps, anticipate sharp moves and gauge whether liquidity providers are active. The money‑flow module extends this analysis by converting volume into currency values and tracking net inflow or outflow across a chosen window.
Although comprehensive, this indicator is intended solely as a guide. It highlights conditions and statistics that many traders find useful, but it does not generate trading signals or guarantee results. Ultimately, you remain responsible for your positions. Use the information presented here to inform your analysis, combine it with other tools and risk‑management techniques, and always make your own decisions when trading.
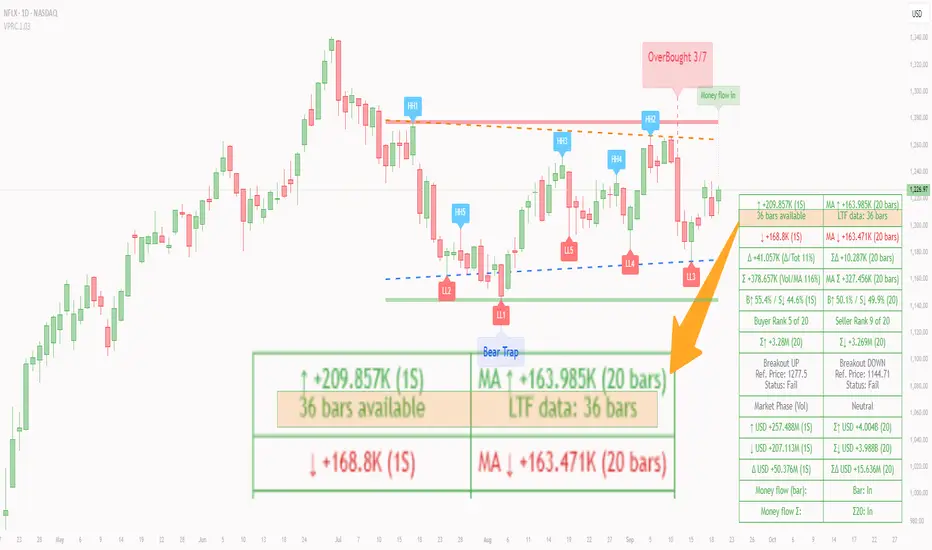
Bot Analyzer📌 Script Name: Bot Analyzer
This TradingView Pine Script v5 indicator creates a dashboard table on the chart that helps you analyze any asset for running a martingale grid bot on futures.
🔧 User Inputs
TP % (tpPct): Take Profit percentage.
SO step % (soStepPct): Step size between safety orders.
SO n (soCount): Number of safety orders.
M mult (martMult): Martingale multiplier (how much each next order increases in size).
Lev (leverage): Leverage used in futures.
BB len / BB mult: Bollinger Bands settings for measuring channel width.
ATR len: ATR period for volatility.
HV days: Lookback window (days) for Historical Volatility calculation.
📐 Calculations
ATR % (atrPct): Normalized ATR relative to price.
Bollinger Band width % (bbPct): Market channel width as percentage of basis.
Historical Volatility (hvAnn): Annualized volatility, calculated from daily log returns.
Dynamic Step % (dynStepPct): Step size for safety orders, automatically adjusted from ATR and clamped between 0.3% and 5%.
Covered Move % (coveredPct): Total percentage move the bot can withstand before last safety order.
Martingale Size Factor (sizeFactor): Total position size multiplier after all safety orders, based on martingale multiplier.
Risk Score (riskLabel): Simple risk estimate:
Low if risk < 30
Mid if risk < 60
High if risk ≥ 60
📊 Output (Table on Chart)
At the top-right of the chart, the script draws a table with 9 rows:
Metric Value
BB % Bollinger Band width in %
HV % Historical Volatility (annualized %)
TP % Take profit setting
SO step % Safety order step size
SO n Number of safety orders
M mult Martingale multiplier
Dyn step % Dynamic step based on ATR
Size x Total position size factor (e.g., 4.5x)
Risk Risk label (Low / Mid / High)
⚙️ Use Case
Helps choose coins for a martingale bot:
If BB% is wide and HV% is high → the asset is volatile enough.
If Risk shows "High" → parameters are aggressive, you may need to adjust step size, SO count, or leverage.
The dashboard lets you compare assets quickly without switching between multiple indicators.

% of Average Volume% of Average Volume (RVOL)
What it is
This indicator measures cumulative volume during pre market and separately during the first 10 minutes of trading and compares it to the average 30 day volume. This matters as a high ratio of volume within the premarket and then during the first 10 minutes of trading can correlate to a stock that has a higher probability of trending in that direction throughout the day.
What it’s meant to do
Identify abnormally high or low participation early in the day.
Normalize volume by time of session, so 9:40 volume is compared to past 9:40 volume—not to the full-day total.
Provide consistent RVOL across 1–5–15–60 minute charts (the same market state yields similar readings).
Handle pre-market cleanly (optional) without inflating RVOL.
How it works (plain English)
Cumulative Intraday Volume: Adds up all bars from the session (or pre-market, if enabled) up to “now.”
Time-Matched Baseline: For each prior day in your lookback, it accumulates only up to the same intraday minute and averages those values.
RVOL %: RVOL = (Today cumulative / Average cumulative at same time) × 100.
This “like-for-like” approach prevents the classic mistakes that overstate RVOL in pre-market or make it drift with timeframe changes.
Works best on
Intraday charts: 1, 2, 3, 4, 5, 10, 15, 30, 45, 60 min
Regular & extended hours: NYSE/Nasdaq equities, futures, ETFs
Daily/weekly views are supported for reference, but the edge comes from intraday time-matched analysis.
Tip: For thin names or very early pre-market, expect more variability—lower liquidity increases noise.
Customization (Inputs → Settings)
Lookback Sessions (e.g., 20): How many prior trading days to build the average.
Include Pre-Market (on/off): If on, RVOL accumulates from pre-market start and compares to historical pre-market at the same time; if off, it begins at the regular session open only.
Session Timezone / Exchange Hours: Choose the session definition that matches your market (e.g., NYSE) so “time-matched” means the same thing every day.
Cutoff Minute (Optional): Fix a reference minute (e.g., 6:40 a.m. PT / 9:40 a.m. ET) to evaluate RVOL at a standard check-in time.
Smoothing (Optional): Apply a short moving average to the RVOL line to reduce jitter.
Thresholds & Colors: Set levels (e.g., 150%, 300%) to color the plot/labels and trigger alerts.
Show Labels/Debug: Toggle on-chart labels (current RVOL%, baseline vols) for quick audits.
On-chart visuals & alerts
RVOL% Line/Histogram: Color-coded by thresholds (e.g., >300% “exceptional”, >150% “elevated”).
Session Markers: Optional vertical lines for pre-market/regular open.
Alerts:
RVOL Crosses Above X% (e.g., 150%, 300%)
RVOL Crosses Below X%
RVOL Rising/Falling (slope-based, optional)
Good defaults to start
Lookback: 20 sessions
Pre-market: Off for large caps, On for momentum screens
Thresholds: 150% (notable), 300% (exceptional)
Smoothing: 0–3 bars (or off for fastest response)
Notes & best practices
Timeframe consistency: Because calculations are time-matched, RVOL should remain directionally consistent across intraday timeframes. If you see divergences, confirm your session hours & timezone match your instrument’s exchange.
Holiday/half days: These are included in history; you can shorten lookback or exclude such sessions if your workflow prefers.
Low-float names: Consider a slightly longer lookback to reduce outlier effects.
TL;DR
A time-matched RVOL that treats pre-market correctly, stays stable across intraday timeframes, and is fully customizable for your exchange hours, thresholds, and alerts—so you can spot real participation when it matters.

Dow Theory Indicator## 🎯 Key Features of the Indicator
### 📈 Complete Implementation of Dow Theory
- Three-tier trend structure: primary trend (50 periods), secondary trend (20 periods), and minor trend (10 periods).
- Swing point analysis: automatically detects critical swing highs and lows.
- Trend confirmation mechanism: strict confirmation logic based on consecutive higher highs/higher lows or lower highs/lower lows.
- Volume confirmation: ensures price moves are supported by trading volume.
### 🕐 Flexible Timeframe Parameters
All key parameters are adjustable, making it especially suitable for U.S. equities:
Trend analysis parameters:
- Primary trend period: 20–200 (default 50; recommended 50–100 for U.S. stocks).
- Secondary trend period: 10–100 (default 20; recommended 15–30 for U.S. stocks).
- Minor trend period: 5–50 (default 10; recommended 5–15 for U.S. stocks).
Dow Theory parameters:
- Swing high/low lookback: 5–50 (default 10).
- Trend confirmation bar count: 1–10 (default 3).
- Volume confirmation period: 10–100 (default 20).
### 🇺🇸 U.S. Market Optimizations
- Session awareness: distinguishes Regular Trading Hours (9:30–16:00 EST) from pre-market and after-hours.
- Pre/post-market weighting: adjustable weighting factor for signals during extended hours.
- Earnings season filter: automatically adjusts sensitivity during earnings periods.
- U.S.-optimized default parameters.
## 🎨 Visualization
1. Trend lines: three differently colored trend lines.
2. Background fill: green (uptrend) / red (downtrend) / gray (neutral).
3. Signal markers: arrows, labels, and warning icons.
4. Swing point markers: small triangles at key turning points.
5. Info panel: real-time display of eight key metrics.
## 🚨 Alert System
- Trend turning to up/down.
- Strong bullish/bearish signals (dual confirmation).
- Volume divergence warning.
- New swing high/low formed.
## 📋 How to Use
1. Open the Pine Editor in TradingView.
2. Copy the contents of dow_theory_indicator.pine.
3. Paste and click “Add to chart.”
4. Adjust parameters based on trading style:
- Long-term investing: increase all period parameters.
- Swing trading: use the default parameters.
- Short-term trading: decrease all period parameters.
## 💡 Parameter Tips for U.S. Stocks
- Large-cap blue chips (AAPL, MSFT): primary 60–80, secondary 25–30.
- Mid-cap growth stocks: primary 40–60, secondary 18–25.
- Small-cap high-volatility stocks: primary 30–50, secondary 15–20.

Yelober - Market Internal direction+ Key levelsYelober – Market Internals + Key Levels is a focused intraday trading tool that helps you spot high-probability price direction by anchoring decisions to structure that matters: yesterday’s RTH High/Low, today’s pre-market High/Low, and a fast Value Area/POC from the prior session. Paired with a compact market internals dashboard (NYSE/NASDAQ UVOL vs. DVOL ratios, VOLD slopes, TICK/TICKQ momentum, and optional VIX trend), it gives you a real-time read on breadth so you can choose which direction to trade, when to enter (breaks, retests, or fades at PMH/PML/VAH/VAL/POC), and how to plan exits as internals confirm or deteriorate. On top of these intraday decision benefits, it also allows traders—in a very subtle but powerful way—to keep an eye on the VIX and immediately recognize significant spikes or sharp decreases that should be factored in before entering a trade, or used as a quick signal to modify an existing position. In short: clear levels for the chart, live internals for the context, and a smarter, rules-based path to execution.
# Yelober – Market Internals + Key Levels
*A TradingView indicator for session key levels + real‑time market internals (NYSE/NASDAQ TICK, UVOL/DVOL/VOLD, and VIX).*
**Script name in Pine:** `Yelober - Market Internal direction+ Key levels` (Pine v6)
---
## 1) What this indicator does
**Purpose:** Help intraday traders quickly find high‑probability reaction zones and read market internals momentum without switching charts. It overlays yesterday/today’s **automatic price levels** on your active chart and shows a **market breadth table** that summarizes NYSE/NASDAQ buying pressure and TICK direction, with an optional VIX trend read.
### Key features at a glance
* **Automatic Price Levels (overlay on chart)**
* Yesterday’s High/Low of Day (**yHoD**, **yLoD**)
* Extended Hours High/Low (**yEHH**, **yEHL**) across yesterday AH + today pre‑market
* Today’s Pre‑Market High/Low (**PMH**, **PML**)
* Yesterday’s **Value Area High/Low** (**VAH/VAL**) and **Point of Control (POC)** computed from a volume profile of yesterday’s **regular session**
* Smart de‑duplication:
* Shows **only the higher** of (yEHH vs PMH) and **only the lower** of (yEHL vs PML) to avoid redundant bands
* **Market Breadth Table (on‑chart table)**
* **NYSE ratio** = UVOL/DVOL (signed) with **VOLD slope** from session open
* **NASDAQ ratio** = UVOLQ/DVOLQ (signed) with **VOLDQ slope** from session open
* **TICK** and **TICKQ**: live cumulative ratio and short‑term slope
* **VIX** (optional): current value + slope over a configurable lookback/timeframe
* Color‑coded trends with sensible thresholds and optional normalization
---
## 2) How to use it (trader workflow)
1. **Mark your reaction zones**
* Watch **yHoD/yLoD**, **PMH/PML**, and **VAH/VAL/POC** for first touches, break/retest, and failure tests.
* Expect increased responsiveness when multiple levels cluster (e.g., PMH ≈ VAH ≈ daily pivot).
2. **Read the breadth panel for context**
* **NYSE/NASDAQ ratio** (>1 = more up‑volume than down‑volume; <−1 = down‑dominant). Strong green across both favors long setups; red favors short setups.
* **VOLD slopes** (NYSE & NASDAQ): positive and accelerating → broadening participation; negative → persistent pressure.
* **TICK/TICKQ**: cumulative ratio and **slope arrows** (↗ / ↘ / →). Use the slope to gauge **near‑term thrust or fade**.
* **VIX slope**: rising VIX (red) often coincides with risk‑off; falling VIX (green) with risk‑on.
3. **Confluence = higher confidence**
* Example: Price reclaims **PMH** while **NYSE/NASDAQ ratios** print green and **TICK slopes** point ↗ — consider break‑and‑go; if VIX slope is ↘, that adds risk‑on confidence.
* Example: Price rejects **VAH** while **VOLD slopes** roll negative and VIX ↗ — consider fade/reversal.
4. **Risk management**
* Place stops just beyond key levels tested; if breadth flips, tighten or exit.
> **Timeframes:** Works best on 1–15m charts for intraday. Value Area is computed from **yesterday’s RTH**; choose a smaller calculation timeframe (e.g., 5–15m) for stable profiles.
---
## 3) Inputs & settings (what each option controls)
### Global Style
* **Enable all automatic price levels**: master toggle for yHoD/yLoD, yEHH/yEHL, PMH/PML, VAH/VAL/POC.
* **Line style/width**: applies to all drawn levels.
* **Label size/style** and **label color linking**: use the same color as the line or override with a global label color.
* **Maximum bars lookback**: how far the script scans to build yesterday metrics (performance‑sensitive).
### Value Area / Volume Profile
* **Enable Value Area calculations** *(on by default)*: computes yesterday’s **POC**, **VAH**, **VAL** from a simplified intraday volume profile built from yesterday’s **regular session bars**.
* **Max Volume Profile Points** *(default 50)*: lower values = faster; higher = more precise.
* **Value Area Calculation Timeframe** *(default 15)*: the security timeframe used when collecting yesterday’s highs/lows/volumes.
### Individual Level Toggles & Colors
* **yHoD / yLoD** (yesterday high/low)
* **yEHH / yEHL** (yesterday AH + today pre‑market extremes)
* **PMH / PML** (today pre‑market extremes)
* **VAH / VAL / POC** (yesterday RTH value area + point of control)
### Market Breadth Panel
* **Show NYSE / NASDAQ / VIX**: choose which series to display in the table.
* **Table Position / Size / Background Color**: UI placement and legibility.
* **Slope Averaging Periods** *(default 5)*: number of recent TICK/TICKQ ratio points used in slope calculation.
* **Candles for Rate** *(default 10)* & **Normalize Rate**: VIX slope calculation as % change between `now` and `n` candles ago; normalize divides by `n`.
* **VIX Timeframe**: optionally compute VIX on a higher TF (e.g., 15, 30, 60) for a smoother regime read.
* **Volume Normalization** (NYSE & NASDAQ): display VOLD slopes scaled to `tens/thousands/millions/10th millions` for readable magnitudes; color thresholds adapt to your choice.
---
## 4) Data sources & definitions
* **UVOL/VOLD (NYSE)** and **UVOLQ/DVOLQ/VOLDQ (NASDAQ)** via `request.security()`
* **Ratio** = `UVOL/DVOL` (signed; negative when down‑volume dominates)
* **VOLD slope** ≈ `(VOLD_now − VOLD_open) / bars_since_open`, then normalized per your setting
* **TICK/TICKQ**: cumulative sum of prints this session with **positives vs negatives ratio**, plus a simple linear regression **slope** of the last `N` ratio values
* **VIX**: value and slope across a user‑selected timeframe and lookback
* **Sessions (EST/EDT)**
* **Regular:** 09:30–16:00
* **Pre‑Market:** 04:00–09:30
* **After Hours:** 16:00–20:00
* **Extended‑hours extremes** combine **yesterday AH** + **today PM**
> **Note:** All session checks are done with TradingView’s `time(…,"America/New_York")` context. If your broker’s RTH differs (e.g., futures), adjust expectations accordingly.
---
## 5) How the algorithms work (plain English)
### A) Key Levels
* **Yesterday’s RTH High/Low**: scans yesterday’s bars within 09:30–16:00 and records the extremes + bar indices.
* **Extended Hours**: scans yesterday AH and today PM to get **yEHH/yEHL**. Script shows **either yEHH or PMH** (whichever is **higher**) and **either yEHL or PML** (whichever is **lower**) to avoid duplicate bands stacked together.
* **Value Area & POC (RTH only)**
* Build a coarse volume profile with `Max Volume Profile Points` buckets across the price range formed by yesterday’s RTH bars.
* Distribute each bar’s volume uniformly across the buckets it spans (fast approximation to keep Pine within execution limits).
* **POC** = bucket with max volume. **VA** expands from POC outward until **70%** of cumulative volume is enclosed → yields **VAH/VAL**.
### B) Market Breadth Table
* **NYSE/NASDAQ Ratio**: signed UVOL/DVOL with basic coloring.
* **VOLD Slopes**: from session open to current, normalized to human‑readable units; colors flip green/red based on thresholds that map to your normalization setting (e.g., ±2M for NYSE, ±3.5×10M for NASDAQ).
* **TICK/TICKQ Slope**: linear regression over the last `N` ratio points → **↗ / → / ↘** with the rounded slope value.
* **VIX Slope**: % change between now and `n` candles ago (optionally divided by `n`). Red when rising beyond threshold; green when falling.
---
## 6) Recommended presets
* **Stocks (liquid, intraday)**
* Value Area **ON**, `Max Volume Points` = **40–60**, **Timeframe** = **5–15**
* Breadth: show **NYSE & NASDAQ & VIX**, `Slope periods` = **5–8**, `Candles for rate` = **10–20**, **Normalize VIX** = **ON**
* **Index futures / very high‑volume symbols**
* If you see Pine timeouts, set `Max Volume Points` = **20–40** or temporarily **disable Value Area**.
* Keep breadth panel **ON** (it’s light). Consider **VIX timeframe = 15/30** for regime clarity.
---
## 7) Tips, edge cases & performance
* **Performance:** The volume profile is capped (`maxBarsToProcess ≤ 500` and bucketed) to keep it responsive. If you experience slowdowns, reduce `Max Volume Points`, `Maximum bars lookback`, or disable Value Area.
* **Redundant lines:** The script **intentionally suppresses** PMH/PML when yEHH/yEHL are more extreme, and vice‑versa.
* **Label visibility:** Use `Label style = none` if you only want clean lines and read values from the right‑end labels.
* **Futures/RTH differences:** Value Area is from **yesterday’s RTH** only; for 24h instruments the RTH period may not reflect overnight structure.
* **Session transitions:** PMH/PML tracking stops as soon as RTH starts; values persist as static levels for the session.
---
## 8) Known limitations
* Uses public TradingView symbols: `UVOL`, `VOLD`, `UVOLQ`, `DVOLQ`, `VOLDQ`, `TICK`, `TICKQ`, `VIX`. If your data plan or region limits any symbol, the corresponding table rows may show `na`.
* The VA/POC approximation assumes uniform distribution of each bar’s volume across its high–low. That’s fast but not a tick‑level profile.
* Works best on US equities with standard NY session; alternative sessions may need code changes.
---
## 9) Troubleshooting
* **“Script is too slow / timed out”** → Lower `Max Volume Points`, lower `Maximum bars lookback`, or toggle **OFF** `Enable Value Area calculations` for that instrument.
* **Missing breadth values** → Ensure the symbols above load on your account; try reloading chart or switching timeframes once.
* **Overlapping labels** → Set `Label style = none` or reduce label size.
---
## 10) Version / license / contribution
* **Version:** Initial public release (Pine v6).
* **Author:** © yelober
* **License:** Free for community use and enhancement. Please keep author credit.
* **Contributing:** Open PRs/ideas: presets, alert conditions, multi‑day VA composites, optional mid‑value (`(VAH+VAL)/2`), session filter for futures, and alertable state machine for breadth regime transitions.
---
## 11) Quick start (TL;DR)
1. Add the indicator and **keep default settings**.
2. Trade **reactions** at yHoD/yLoD/PMH/PML/VAH/VAL/POC.
3. Use the **breadth table**: look for **green ratios + ↗ slopes** (risk‑on) or **red ratios + ↘ slopes** (risk‑off). Check **VIX** slope for confirmation.
4. Manage risk around levels; when breadth flips against you, tighten or exit.
---
### Changelog (public)
* **v1.0:** First community release with automatic RTH levels, VA/POC approximation, breadth dashboard (NYSE/NASDAQ/TICK/TICKQ/VIX) with normalization and adaptive color thresholds.

Persistence# Persistence
## What it does
Measures **price change persistence**, defined as the percentage of bars within a lookback window that closed higher than the prior close. A high value means the instrument has been closing up frequently, which can indicate durable momentum. This mirrors Stockbee’s idea: *select stocks with high price change persistence*, and then combine **momentum plus persistence**.
## Can be used for scanning in PineScreener
## Calculation
* `isUp` is true when `close > close `.
* `countUp` counts true instances over the last `len` bars.
* `pctUp = 100 * countUp / len`, bounded between 0 and 100.
* A 50% level is a natural baseline. Above 50% suggests more up closes than down closes in the window.
## Inputs
* **Lookback bars (`len`)**: default 252 for roughly one trading year on a daily chart. On weekly charts use something like 52, on monthly charts use 12.
## How to use
1. **Screen for persistence**
Sort a watchlist by the plotted value, higher is better. Many momentum traders start looking above 58 to 65 percent, then layer a trend filter.
2. **Combine with momentum**
Examples, pick tickers with:
* `pctUp > 60`, and price above a rising EMA50 or EMA100.
* `pctUp rising` and weekly ROC positive.
3. **Switch timeframe to change the horizon**
* Daily chart with `len = 252` approximates one year.
* Weekly chart with `len = 52` approximates one year.
* Monthly chart with `len = 12` approximates one year.
## TC2000 equivalence
Stockbee’s TC2000 expression:
```
CountTrue(c > c1, 252)
```
## Interpretation guide
* **70 to 90**: very strong persistence; often trend leaders, check for extensions and risk controls.
* **60 to 70**: constructive persistence; good hunting ground for swing setups that also pass momentum filters.
* **50**: neutral baseline; around random up vs down frequency.
* **Below 50**: persistent weakness; consider only for mean reversion or short strategies.
## Practical tips
* **Event effects**: ex-dividend gaps can reduce persistence on high yield names. Earnings gaps can swing the value sharply.
* **Survivorship bias**: when backtesting on curated lists, persistence can look cleaner than in live scans.
* **Liquidity**: thin names may show noisy persistence due to erratic prints.
## Reference to Stockbee
* “One way to select stocks for swing trading is to find those with high price change persistence.”
* “Persistence can be calculated on a daily, monthly, or weekly timeframe.”
* TC2000 function: `CountTrue(c > c1, 252)`
* Example noted in the tweet: CVNA had very high one-year price persistence at the time of that post.
* Takeaway: **look for momentum plus persistence**, not persistence alone.

Fear & Greed Oscillator — LEAPs (v6, manual DMI/ADX)Fear & Greed Oscillator for LEAPs — a composite sentiment/trend tool that highlights long-term fear/greed extremes and trend quality for better LEAP entries and exits.
This custom Fear & Greed Oscillator (FGO-LEAP) is designed for swing trades and long-term LEAP option entries. It blends multiple signals — MACD (trend), ADX/DMI (trend quality), OBV (accumulation/distribution), RSI & Stoch RSI (momentum), and volume spikes — into a single score that ranges from –100 (extreme fear) to +100 (extreme greed). The weights are tuned for LEAPs, emphasizing slower trend and accumulation signals rather than short-term noise.
Use Weekly charts for the main signal and Daily only for entry timing. Entries are strongest when the score is above zero and rising, with both MACD and DMI positive. Extreme Fear (< –60) can mark long-term bottoms when followed by a recovery, while Extreme Greed (> +60) often signals overheated conditions. A cross below zero is an early warning to reduce or roll positions.
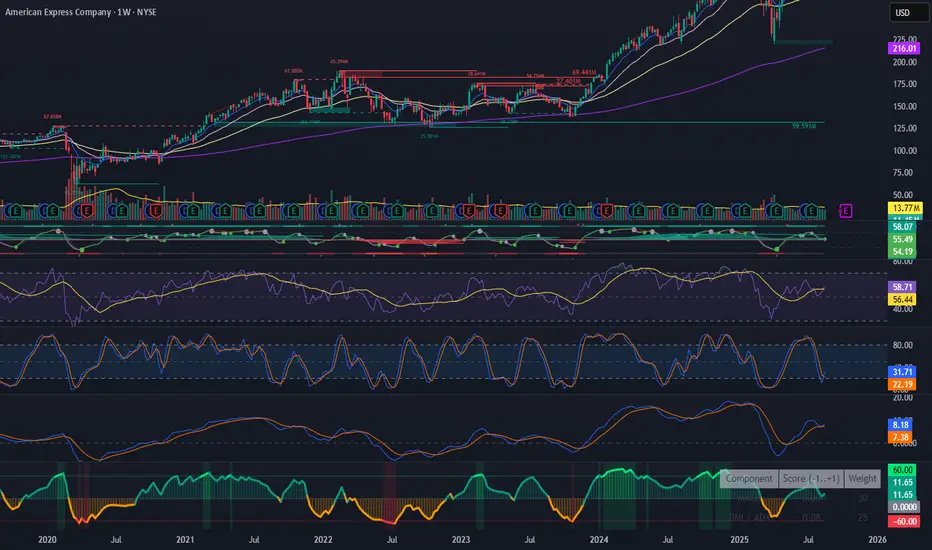
[blackcat] L3 Improved Dual Ehlers BPF for Volatility DetectionOVERVIEW
This script implements an advanced L3 Improved Dual Ehlers Bandpass Filter (BPF) for volatility detection, combining both L1 and L2 calculation methods to create a comprehensive trading signal. The script leverages John Ehlers' sophisticated digital signal processing techniques to identify market cycles and extract meaningful trading signals from price action. By combining multiple cycle detection methods and filtering approaches, it provides traders with a powerful tool for identifying trend changes, momentum shifts, and potential reversal points across various market conditions and timeframes. The L3 approach uniquely combines the outputs of both L1 (01 range) and L2 (-11 range) methods, creating a signal that ranges from -1~2 and provides enhanced sensitivity to market dynamics.
FEATURES
🔄 Dual Calculation Methods: Choose between L1 (01 range), L2 (-11 range), or combine both for L3 signal (-1~2 range) to match your trading style
📊 Multiple Cycle Detection: Seven different dominant cycle calculation methods including HoDyDC (Hilbert Transform Dominant Cycle), PhAcDC (Phase Accumulation Dominant Cycle), DuDiDC (Duane Dominant Cycle), CycPer (Cycle Period), BPZC (Bandpass Zero Crossing), AutoPer (Autocorrelation Period), and DFTDC (Discrete Fourier Transform Dominant Cycle)
🎛️ Flexible Mixing Options: Six sophisticated mixing methods including weighted averaging, simple sum, difference extraction, dominant-only, subdominant-only, and adaptive mixing that adjusts based on signal strength
🌊 Bandpass Filtering: Precise bandwidth control for both dominant and subdominant filters, allowing fine-tuning of frequency response characteristics
📈 Advanced Divergence Detection: Robust algorithm for identifying bullish and bearish divergences with customizable lookback periods and range constraints
🎨 Comprehensive Visualization: Extensive customization options for all signals, colors, plot styles, and display elements
🔔 Comprehensive Alert System: Built-in alerts for divergence signals, zero line crosses, and various market conditions
📊 Real-time Cycle Information: Optional display of dominant and subdominant cycle periods for educational purposes
🔄 Adaptive Signal Processing: Dynamic adjustment of parameters based on market conditions and volatility
🎯 Multiple Signal Outputs: Simultaneous generation of L1, L2, and L3 signals for different trading strategies
HOW TO USE
Select Calculation Method: Choose between "l1" (01 range), "l2" (-11 range), or "both" (L3, -1~2 range) in the Calculation Method settings based on your preferred signal characteristics
Configure Cycle Detection: Select your preferred Dominant Cycle Method from the seven available options and adjust the Cycle Part parameter (0.1-0.9) to fine-tune cycle sensitivity
Set Subdominant Parameters: Configure the subdominant cycle either as a ratio of the dominant cycle or as a fixed period, depending on your analysis approach
Adjust Filter Bandwidth: Fine-tune the bandwidth settings for both dominant and subdominant filters (0.1-1.0) to control the frequency response and signal smoothing
Choose Mixing Method: Select how to combine the filters - weighted averaging for balance, sum for maximum sensitivity, difference for trend isolation, or adaptive mixing for dynamic response
Configure Smoothing: Select from SMA, EMA, or HMA smoothing methods with adjustable length (1-20 bars) to reduce noise in the final signal
Customize Visualization: Enable/disable individual plots, divergence detection, zero line, fill areas, and customize all colors to match your chart preferences
Set Divergence Parameters: Configure lookback ranges (5-60 bars) for divergence detection to match your trading timeframe and style
Monitor Signals: Watch for crosses above/below zero line and divergence patterns, paying attention to signal strength and consistency
Set Up Alerts: Configure alerts for divergence signals, zero line crosses, and other market conditions to stay informed of trading opportunities
LIMITATIONS
The script requires the dc_ta library from blackcat1402 for several advanced cycle calculation methods (HoDyDC, PhAcDC, DuDiDC, CycPer, BPZC, AutoPer, DFTDC)
L1 method operates in 01 range while L2 method uses -11 range, requiring different interpretation approaches
Combined L3 signal ranges from -1~2 when both methods are selected, creating unique signal characteristics that traders must adapt to
Divergence detection accuracy depends on proper lookback period settings and market volatility conditions
Performance may be impacted with very long lookback ranges (>60 bars) or when multiple plots are simultaneously enabled
The script is designed for non-overlay use and may not display correctly on certain chart types or with conflicting indicators
Adaptive mixing method requires careful threshold tuning to avoid excessive signal fluctuation
Cycle detection algorithms may produce unreliable results during low volatility or highly choppy market conditions
The script assumes regular price data and may not perform optimally with irregular or gapped price sequences
NOTES
The script implements advanced mathematical calculations including bandpass filters, Hilbert transforms, and various cycle detection algorithms developed by John Ehlers
For optimal results, experiment with different cycle detection methods and bandwidth settings across various market conditions and timeframes
The adaptive mixing method automatically adjusts weights based on signal strength, providing dynamic response to changing market conditions
Divergence detection works best when the "Plot Divergence" option is enabled and when combined with other technical analysis tools
Zero line crosses can indicate potential trend changes or momentum shifts, especially when confirmed by volume or other indicators
The script includes commented code for cycle information display that can be enabled if you want to monitor cycle periods in real-time
Different calculation methods may perform better in different market environments - L1 tends to be smoother while L2 is more sensitive
The subdominant cycle helps filter out noise and provides additional confirmation for signals generated by the dominant cycle
Bandwidth settings control the filter's frequency response - lower values provide more smoothing while higher values increase sensitivity
Mixing methods offer different approaches to combining signals - weighted averaging is generally most reliable for most trading applications
THANKS
Special thanks to John Ehlers for his pioneering work in cycle analysis and digital signal processing for financial markets. This script implements and significantly improves upon his bandpass filter methodology, incorporating multiple advanced techniques from his extensive body of work. Also heartfelt thanks to blackcat1402 for the dc_ta library that provides essential cycle calculation methods and for maintaining such a valuable resource for the Pine Script community. Additional appreciation to the TradingView platform for providing the tools and environment that make sophisticated technical analysis accessible to traders worldwide. This script represents a collaborative effort in advancing the field of algorithmic trading and technical analysis.
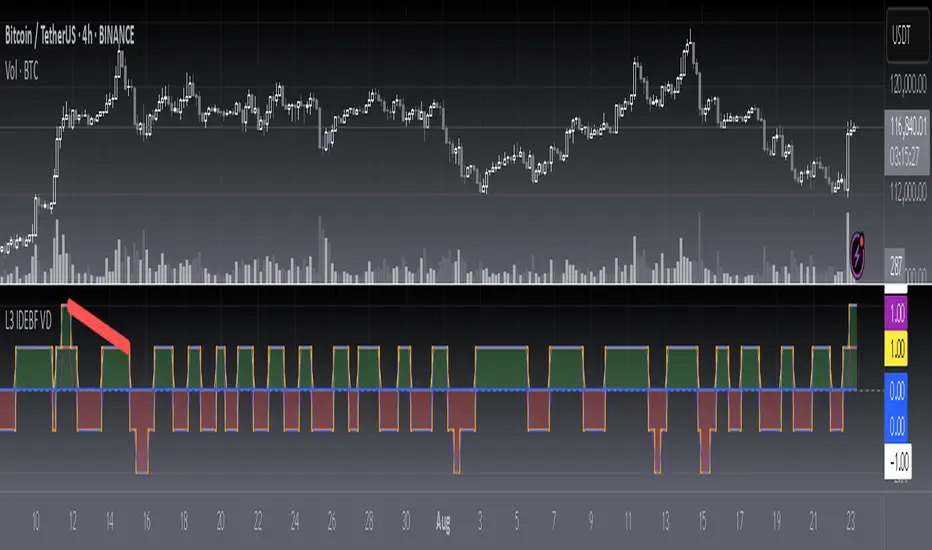
RTH Levels: VWAP + PDH/PDL + ONH/ONL + IBAlgo Index — Levels Pro (ONH/ONL • PDH/PDL • VWAP±Bands • IB • Gaps)
Purpose. A session-aware, non-repainting levels tool for intraday decision-making. Designed for futures and indices, with clean visuals, alerts, and a one-click Minimal Mode for screenshot-ready charts.
What it plots
• PDH/PDL (RTH-only) – Prior Regular Trading Hours high/low, computed intraday and frozen at the RTH close (no 24h mix-ups, no repainting).
• ONH/ONL – Prior Overnight high/low, held throughout RTH.
• RTH VWAP with ±σ bands – Volume-weighted variance, reset each RTH.
• Initial Balance (IB) – First N minutes of RTH, plus 1.5× / 2.0× extensions after IB completes.
• Today’s RTH Open & Prior RTH Close – With gap detection and “gap filled” alert.
• Killzone shading – NY Open (09:30–10:30 ET) and Lunch (11:15–13:30 ET).
• Values panel (top-right) – Each level with live distance in points & ticks.
• Right-edge level tags – With anti-overlap (stagger + vertical jitter).
• Price-scale tags – Native trackprice markers that always “stick” to the axis.
⸻
New in v6.4
• Minimal Mode: one click for a clean look (thinner lines, VWAP bands/IB extensions hidden, on-chart right-edge labels off; price-scale tags remain).
• Theme presets: Dark Hi-Contrast / Light Minimal / Futures Classic / Muted Dark.
• Anti-overlap controls: horizontal staggering, vertical jitter, and baseline offset to keep tags readable even when levels cluster.
⸻
Quick start (2 minutes)
1. Add to chart → keep defaults.
2. Sessions (ET):
• RTH Session default: 09:30–16:00 (US equities cash hours).
• Overnight Session default: 18:00–09:29.
Adjust for your market if you use different “day” hours (e.g., many use 08:20–13:30 ET for COMEX Gold).
3. Theme & Minimal Mode: pick a Theme Preset; enable Minimal Mode for screenshots.
4. Visibility: toggle PD/ON/VWAP/IB/References/Panel to taste.
5. Right-edge labels: turn Show Right-Edge Labels on. If they crowd, tune:
• Anti-overlap: min separation (ticks)
• Horizontal offset per tag (bars)
• Vertical jitter per step (ticks)
• Right-edge baseline offset (bars)
6. Alerts: open Add alert → Condition: and pick the events you want.
⸻
How levels are computed (no repainting)
• PDH/PDL: Intraday H/L are accumulated only while in RTH and saved at RTH close for “yesterday’s” values.
• ONH/ONL: Accumulated across the defined Overnight window and then held during RTH.
• RTH VWAP & ±σ: Volume-weighted mean and standard deviation, reset at the RTH open.
• IB: First N minutes of RTH (default 60). Extensions (1.5×/2.0×) appear after IB completes.
• Gaps: Today’s RTH open vs prior RTH close; “Gap Filled” triggers when price trades back to prior close.
⸻
Practical playbooks (how to trade around the levels)
1) PDH/PDL interactions
• Rejection: Price taps PDH/PDL then closes back inside → mean-reversion toward VWAP/IB.
• Acceptance: Close/hold beyond PDH/PDL with momentum → continuation to next HTF/IB target.
• Alert: PD Touch/Break.
2) ONH/ONL “taken”
• Often one ON extreme is taken during RTH. ONH Taken / ONL Taken → check if it’s a clean break or sweep & reclaim.
• Sweep + reclaim near VWAP can fuel rotations through the ON range.
3) VWAP ±σ framework
• Balanced: First tag of ±1σ often reverts toward VWAP.
• Trend: Persistent trade beyond ±1σ + IB break → target ±2σ/±3σ.
• Alerts: VWAP Cross and VWAP Reject (cross then immediate fail back).
4) IB breaks
• After IB completes, a clean IB break commonly targets 1.5× and sometimes 2.0×.
• Quick return inside IB = possible fade back to the opposite IB edge/VWAP.
• Alerts: IB Break Up / Down.
5) Gaps
• Gap-and-go: Opening drive away from prior close + VWAP support → trend until IB completion.
• Gap-fill: Weak open and VWAP overhead/underfoot → trade toward prior close; manage on Gap Filled alert.
Pro tip: Stack confluences (e.g., ONL sweep + VWAP reclaim + IB hold) and respect your execution rules (e.g., require a 5-minute close in direction, or your order-flow confirmation).
⸻
Inputs you’ll actually touch
• Sessions (ET): Session Timezone, RTH Session, Overnight Session.
• Visibility: toggles for PD/ON/VWAP/IB/Ref/Panel.
• VWAP bands: set σ multipliers (±1/±2/±3).
• IB: duration (minutes) and extension multipliers (1.5× / 2.0×).
• Style & Theme: Theme Preset, Main Line Width, Trackprice, Minimal Mode, and anti-overlap controls.
⸻
Alerts included
• PD Touch/Break — High ≥ PDH or Low ≤ PDL
• ONH Taken / ONL Taken — First in-RTH take of ONH/ONL
• VWAP Cross — Close crosses VWAP
• VWAP Reject — Cross then immediate fail back
• IB Break Up / Down — Break of IB High/Low after IB completes
• Gap Filled — Price trades back to prior RTH close
Setup: Add alert → Condition: Algo Index — Levels Pro → choose event → message → Notify on app/email.
⸻
Panel guide
The top-right panel shows each level plus live distance from last price:
LevelValue (Δpoints | Δticks)
Coloring: green if level is below current price, red if above.
⸻
Styling & screenshot tips
• Use Theme Preset that matches your chart.
• For dark charts, “Dark Hi-Contrast” with Main Line Width = 3 works well.
• Enable Trackprice for crisp axis tags that always stick to the right edge.
• Turn on Minimal Mode for cleaner screenshots (no VWAP bands or IB extensions, on-chart tags off; price-scale tags remain).
• If tags crowd, increase min separation (ticks) to 30–60 and horizontal offset to 3–5; add vertical jitter (4–12 ticks) and/or push tags farther right with baseline offset (bars).
⸻
Behavior & limitations
• Levels are computed incrementally; tables refresh on the last bar for efficiency.
• Right-edge labels are placed at bar_index + offset and do not track extra right-margin scrolling (TradingView limitation). The price-scale tags (from trackprice) do track the axis.
• “RTH” is what you define in inputs. If your market uses different day hours, change the session strings so PDH/PDL reflect your definition of “yesterday’s session.”
⸻
FAQ
Q: My PDH/PDL don’t match the daily chart.
A: By design this uses RTH-only highs/lows, not 24h daily bars. Adjust sessions if you want a different definition.
Q: Right-edge tags overlap or don’t sit at the far right.
A: Increase min separation / horizontal offset / vertical jitter and/or push tags farther with baseline offset. If you want markers that always hug the axis, rely on Trackprice.
Q: Can I change killzones?
A: Yes—edit the session strings in settings or request a version with user inputs for custom windows.
⸻
Disclaimer
Educational use only. This is not financial advice. Always apply your own risk management and confirmation rules.
⸻
Enjoy it? Please ⭐ the script and share screenshots using Minimal Mode + a Theme Preset that fits your style.

Estrategia de NY ORB por CPThis strategy marks the New York market opening range during the first 15 minutes and confirms a buy or sell entry once the price returns and retests that range. It’s designed to capture trades of 60 points or more after the range has been retested. I suggest complementing the strategy with an indicator that highlights FVGs (Fair Value Gaps) or order blocks to better understand what price is doing and where it’s heading.
esta estrategia te marca el rango de apertura del mercado de ny de los primeros 15 minutos y te confirma entrada en venta o compra una vez que el precio regrese y retestee el rango. esta diseñada para tener trades de 60 puntos o mas una vez que el rango sea retesteado. sugiero acompañar la estrategia con algun indicador que marque fvg o order blocks para tener una mejor de lo que el precio esta haciendo y hacia donde se dirige.

SMI Base-Trigger Bullish Re-acceleration (Higher High)Description
What it does
This indicator highlights a two-step bullish pattern using Stochastic Momentum Index (SMI) plus an ATR distance filter:
1. Base (orange) – Marks a momentum “reset.” A base prints when SMI %K crosses up through %D while %K is below the Base level (default -70). The base stores the base price and starts a waiting window.
2. Trigger (green) – Confirms momentum and price strength. A trigger prints only if, before the timeout window ends:
• SMI %K crosses up through %D again,
• %K is above the Trigger level (default -60),
• Close > Base Price, and
• Price has advanced at least Min ATR multiple (default 1.0× the 14-period ATR) above the base price.
A dashed green line connects the base to the trigger.
Why it’s useful
It seeks a bullish divergence / reacceleration: momentum recovers from deeply negative territory, then price reclaims and exceeds the base by a volatility-aware margin. This helps filter out weak “oversold bounces.”
Signals
• Base ▲ (orange): Potential setup begins.
• Trigger ▲ (green): Confirmation—momentum and price agree.
Inputs (key ones)
• %K Length / EMA Smoothing / %D Length: SMI construction.
• Base when %K < (default -70): depth required for a valid reset.
• Trigger when %K > (default -60): strength required on confirmation.
• Base timeout (days) (default 100): maximum look-ahead window.
• ATR Length (default 14) and Min ATR multiple (default 1.0): price must exceed the base by this ATR-scaled distance.
How traders use it (example rules)
• Entry: On the Trigger.
• Risk: A common approach is a stop somewhere between the base price and a multiple of ATR below trigger; or use your system’s volatility stop.
• Exits: Your choice—trend MA cross, fixed R multiple, or structure-based levels.
Notes & tips
• Works best on liquid symbols and mid-to-higher timeframes (reduce noise).
• Increase Min ATR multiple to demand stronger price confirmation; tighten or widen Base/Trigger levels to fit your market.
• This script plots signals only; convert to a strategy to backtest entries/exits.

Bullish Divergence SMI Base & Trigger with ATR FilterDescription:
A bullish divergence indicator combining the Stochastic Momentum Index (SMI) and Average True Range (ATR) to pinpoint high-probability entries:
1. Base Arrow (Orange ▲):
• Marks every SMI %K / %D bullish crossover where %K < –70 (deep oversold)—the first half of the divergence setup.
• Each new qualifying crossover replaces the previous base, continuously “arming” the divergence signal.
• Configurable SMI lookbacks, oversold threshold, and a base timeout (default 100 days) to clear stale bases.
2. Trigger Arrow (Green ▲):
• Completes the bullish divergence: fires on the next SMI bullish crossover where %K > –60 and price has dropped below the base arrow’s close by at least N × ATR (default 1 × 14-day ATR).
• A dashed green line links the base and trigger to visually confirm the divergence.
• Resets after triggering, ready for a new divergence cycle.
Inputs:
• SMI %K Length, EMA Smoothing, %D Length
• Oversold Base Level (–70), Trigger Level (–60)
• ATR Length (14), ATR Multiplier (1.0)
• Base Timeout (100 days)
Ideal for any market, this study highlights genuine bullish divergences—oversold momentum crossovers that coincide with significant price reactions—before entering long trades.

ATR%指標概要 / Overview
ATR Percentage (MTF):把 ATR 轉為百分比(ATR%)或保留為絕對值,並在該「波動序列」上套用布林帶。支援多週期(MTF)計算:例如在 5 分圖顯示 4H / D1 的 ATR%。內建白色點狀水平線作為固定門檻(預設 1%)。
ATR Percentage (MTF): Converts ATR to a percentage of price (ATR%) or keeps it as absolute ATR, then applies Bollinger Bands on this volatility series. Supports multi-timeframe (MTF) calculation (e.g., show 4H/D1 ATR% on a 5-min chart). Includes a configurable white dotted horizontal threshold line (default 1%).
⸻
設計目的 / Purpose
• 以 ATR% 衡量相對波動,利於跨品種比較。
Use ATR% for relative volatility to compare across markets.
• 以 布林帶 標示「高/低波動區」,觀察擴張與壓縮。
Use Bollinger Bands on volatility to highlight expansion/squeeze.
• 提供 固定閾值(1%) 作為策略濾網或告警門檻。
Provide a fixed threshold (1%) for filters/alerts.
• 以 MTF 方式,讓低週期策略用高週期波動做濾網。
MTF lets lower-TF strategies filter by higher-TF volatility.
⸻
參數說明 / Inputs
• Use ATR as % of Close:切換 ATR(絕對值)/ ATR%(建議)。
Toggle between absolute ATR and ATR% (recommended).
• ATR Periods:ATR 計算長度(預設 22)。
ATR lookback (default 22).
• Show Bollinger Bands / BB Periods / StdDev:布林帶開關、長度與倍數(預設 20 / 2)。
Bollinger Bands on/off, length, and deviation (default 20 / 2).
• Source Timeframe:計算用週期(如 60、240、D、W;留空/Chart = 跟隨圖表)。
Timeframe used for calculations (e.g., 60, 240, D, W; empty/“Chart” = current).
• Threshold Line (%):白色點線門檻,預設 1.0(即 1%)。
White dotted threshold line, default 1.0 (1%).
提醒:當 非 ATR% 模式時,Threshold 值代表「價格單位」而非百分比。
Note: In non-ATR% mode, the threshold is in price units, not percent.
⸻
訊號解讀 / How to Read
• ATR% > 上軌:波動顯著擴張(趨勢啟動或加速常見)。
ATR% above upper band: significant expansion; often trend ignition/acceleration.
• ATR% < 下軌:波動明顯壓縮(常見於突破前)。
ATR% below lower band: volatility squeeze; often precedes breakouts.
• ATR% 穿越 Threshold(1%):達到固定波動標準,可作策略開關或風控分水嶺。
ATR% crossing the 1% threshold: fixed volatility bar for filters/risk gates.
⸻
內建告警 / Built-in Alerts
• Volatility Breakout (MTF):ATR/ATR% 向上穿越上軌。
Triggers when ATR/ATR% crosses above the upper band.
• Volatility Squeeze (MTF):ATR/ATR% 向下穿越下軌。
Triggers when ATR/ATR% crosses below the lower band.
⸻
使用建議 / Suggested Uses
• 當沖濾網:於 1–5 分圖選擇 4H / D1 作為 Source Timeframe;僅在 ATR% > 1% 且位於中線以上時允許趨勢進場。
Intraday filter: on 1–5m charts, set 4H/D1 as source TF; allow trend entries only when ATR% > 1% and above the midline.
• 突破前偵測:ATR% 長時間貼近下軌 → 留意可能的波動擴張。
Pre-breakout scan: prolonged ATR% near lower band can foreshadow expansion.
• 跨品種比較:用 ATR% 統一指數、外匯、商品的波動刻度。
Cross-asset comparison: ATR% normalizes volatility across indices/FX/commodities.
⸻
已知限制 / Notes
• MTF 對齊:使用 request.security() 對映高週期資料到當前圖表;在歷史回補與即時邊界棒可能略有差異。
MTF alignment: request.security() maps higher-TF data; boundary bars may differ slightly between historical and realtime.
• 百分比分母:ATR% 的分母為同一週期的 close;若需更平滑可改 ATR / SMA(close, N) × 100。
Denominator: ATR% uses same-TF close; for smoother values consider ATR / SMA(close, N) × 100.
• 風險聲明:僅供研究/教育用途,非投資建議,請自行控管風險。
Disclaimer: For research/education only. Not investment advice.
⸻
版本與更新 / Version & Updates
• v1.0:ATR/ATR% + BB(MTF)、1% 白色點線、兩組告警。
v1.0: ATR/ATR% + BB (MTF), 1% white dotted line, two alert conditions.

Mutanabby_AI __ OSC+ST+SQZMOMMutanabby_AI OSC+ST+SQZMOM: Multi-Component Trading Analysis Tool
Overview
The Mutanabby_AI OSC+ST+SQZMOM indicator combines three proven technical analysis components into a unified trading system, providing comprehensive market analysis through integrated oscillator signals, trend identification, and volatility assessment.
Core Components
Wave Trend Oscillator (OSC): Identifies overbought and oversold market conditions using exponential moving average calculations. Key threshold levels include overbought zones at 60 and 53, with oversold areas marked at -60 and -53. Crossover signals between the two oscillator lines generate entry opportunities, displayed as colored circles on the chart for easy identification.
Supertrend Indicator (ST): Determines overall market direction using Average True Range calculations with a 2.5 factor and 10-period ATR configuration. Green lines indicate confirmed uptrends while red lines signal downtrend conditions. The indicator automatically adapts to market volatility changes, providing reliable trend identification across different market environments.
Squeeze Momentum (SQZMOM): Compares Bollinger Bands with Keltner Channels to identify consolidation periods and potential breakout scenarios. Black squares indicate squeeze conditions representing low volatility periods, green triangles signal confirmed upward breakouts, and red triangles mark downward breakout confirmations.
Signal Generation Logic
Long Entry Conditions:
Green triangles from Squeeze Momentum component
Supertrend line transitioning to green
Bullish crossovers in Wave Trend Oscillator from oversold territory
Short Entry Conditions:
Red triangles from Squeeze Momentum component
Supertrend line transitioning to red
Bearish crossovers in Wave Trend Oscillator from overbought territory
Automated Risk Management
The indicator incorporates comprehensive risk management through ATR-based calculations. Stop losses are automatically positioned at 3x ATR distance from entry points, while three progressive take profit targets are established at 1x, 2x, and 3x ATR multiples respectively. All risk management levels are clearly displayed on the chart using colored lines and informative labels.
When trend direction changes, the system automatically clears previous risk levels and generates new calculations, ensuring all risk parameters remain current and relevant to existing market conditions.
Alert and Notification System
Comprehensive alert framework includes trend change notifications with complete trade setup details, squeeze release alerts for breakout opportunity identification, and trend weakness warnings for active position management. Alert messages contain specific trading pair information, timeframe specifications, and all relevant entry and exit level data.
Implementation Guidelines
Timeframe Selection: Higher timeframes including 4-hour and daily charts provide the most reliable signals for position trading strategies. One-hour charts demonstrate good performance for day trading applications, while 15-30 minute timeframes enable scalping approaches with enhanced risk management requirements.
Risk Management Integration: Limit individual trade risk to 1-2% of total capital using the automatically calculated stop loss levels for precise position sizing. Implement systematic profit-taking at each target level while adjusting stop loss positions to protect accumulated gains.
Market Volatility Adaptation: The indicator's ATR-based calculations automatically adjust to changing market volatility conditions. During high volatility periods, risk management levels appropriately widen, while low volatility conditions result in tighter risk parameters.
Optimization Techniques
Combine indicator signals with fundamental support and resistance level analysis for enhanced signal validation. Monitor volume patterns to confirm breakout strength, particularly when Squeeze Momentum signals develop. Maintain awareness of scheduled economic events that may influence market behavior independent of technical indicator signals.
The multi-component design provides internal signal confirmation through multiple alignment requirements, significantly reducing false signal occurrence while maintaining reasonable trade frequency for active trading strategies.
Technical Specifications
The Wave Trend Oscillator utilizes customizable channel length (default 10) and average length (default 21) parameters for optimal market sensitivity. Supertrend calculations employ ATR period of 10 with factor multiplier of 2.5 for balanced signal quality. Squeeze Momentum analysis uses Bollinger Band length of 20 periods with 2.0 multiplication factor, combined with Keltner Channel length of 20 periods and 1.5 multiplication factor.
Conclusion
The Mutanabby_AI OSC+ST+SQZMOM indicator provides a systematic approach to technical market analysis through the integration of proven oscillator, trend, and momentum components. Success requires thorough understanding of each element's functionality and disciplined implementation of proper risk management principles.
Practice with demo trading accounts before live implementation to develop familiarity with signal interpretation and trade management procedures. The indicator's systematic approach effectively reduces emotional decision-making while providing clear, objective guidelines for trade entry, management, and exit strategies across various market conditions.

Drawdown Distribution Analysis (DDA) ACADEMIC FOUNDATION AND RESEARCH BACKGROUND
The Drawdown Distribution Analysis indicator implements quantitative risk management principles, drawing upon decades of academic research in portfolio theory, behavioral finance, and statistical risk modeling. This tool provides risk assessment capabilities for traders and portfolio managers seeking to understand their current position within historical drawdown patterns.
The theoretical foundation of this indicator rests on modern portfolio theory as established by Markowitz (1952), who introduced the fundamental concepts of risk-return optimization that continue to underpin contemporary portfolio management. Sharpe (1966) later expanded this framework by developing risk-adjusted performance measures, most notably the Sharpe ratio, which remains a cornerstone of performance evaluation in financial markets.
The specific focus on drawdown analysis builds upon the work of Chekhlov, Uryasev and Zabarankin (2005), who provided the mathematical framework for incorporating drawdown measures into portfolio optimization. Their research demonstrated that traditional mean-variance optimization often fails to capture the full risk profile of investment strategies, particularly regarding sequential losses. More recent work by Goldberg and Mahmoud (2017) has brought these theoretical concepts into practical application within institutional risk management frameworks.
Value at Risk methodology, as comprehensively outlined by Jorion (2007), provides the statistical foundation for the risk measurement components of this indicator. The coherent risk measures framework developed by Artzner et al. (1999) ensures that the risk metrics employed satisfy the mathematical properties required for sound risk management decisions. Additionally, the focus on downside risk follows the framework established by Sortino and Price (1994), while the drawdown-adjusted performance measures implement concepts introduced by Young (1991).
MATHEMATICAL METHODOLOGY
The core calculation methodology centers on a peak-tracking algorithm that continuously monitors the maximum price level achieved and calculates the percentage decline from this peak. The drawdown at any time t is defined as DD(t) = (P(t) - Peak(t)) / Peak(t) × 100, where P(t) represents the asset price at time t and Peak(t) represents the running maximum price observed up to time t.
Statistical distribution analysis forms the analytical backbone of the indicator. The system calculates key percentiles using the ta.percentile_nearest_rank() function to establish the 5th, 10th, 25th, 50th, 75th, 90th, and 95th percentiles of the historical drawdown distribution. This approach provides a complete picture of how the current drawdown compares to historical patterns.
Statistical significance assessment employs standard deviation bands at one, two, and three standard deviations from the mean, following the conventional approach where the upper band equals μ + nσ and the lower band equals μ - nσ. The Z-score calculation, defined as Z = (DD - μ) / σ, enables the identification of statistically extreme events, with thresholds set at |Z| > 2.5 for extreme drawdowns and |Z| > 3.0 for severe drawdowns, corresponding to confidence levels exceeding 99.4% and 99.7% respectively.
ADVANCED RISK METRICS
The indicator incorporates several risk-adjusted performance measures that extend beyond basic drawdown analysis. The Sharpe ratio calculation follows the standard formula Sharpe = (R - Rf) / σ, where R represents the annualized return, Rf represents the risk-free rate, and σ represents the annualized volatility. The system supports dynamic sourcing of the risk-free rate from the US 10-year Treasury yield or allows for manual specification.
The Sortino ratio addresses the limitation of the Sharpe ratio by focusing exclusively on downside risk, calculated as Sortino = (R - Rf) / σd, where σd represents the downside deviation computed using only negative returns. This measure provides a more accurate assessment of risk-adjusted performance for strategies that exhibit asymmetric return distributions.
The Calmar ratio, defined as Annual Return divided by the absolute value of Maximum Drawdown, offers a direct measure of return per unit of drawdown risk. This metric proves particularly valuable for comparing strategies or assets with different risk profiles, as it directly relates performance to the maximum historical loss experienced.
Value at Risk calculations provide quantitative estimates of potential losses at specified confidence levels. The 95% VaR corresponds to the 5th percentile of the drawdown distribution, while the 99% VaR corresponds to the 1st percentile. Conditional VaR, also known as Expected Shortfall, estimates the average loss in the worst 5% of scenarios, providing insight into tail risk that standard VaR measures may not capture.
To enable fair comparison across assets with different volatility characteristics, the indicator calculates volatility-adjusted drawdowns using the formula Adjusted DD = Raw DD / (Volatility / 20%). This normalization allows for meaningful comparison between high-volatility assets like cryptocurrencies and lower-volatility instruments like government bonds.
The Risk Efficiency Score represents a composite measure ranging from 0 to 100 that combines the Sharpe ratio and current percentile rank to provide a single metric for quick asset assessment. Higher scores indicate superior risk-adjusted performance relative to historical patterns.
COLOR SCHEMES AND VISUALIZATION
The indicator implements eight distinct color themes designed to accommodate different analytical preferences and market contexts. The EdgeTools theme employs a corporate blue palette that matches the design system used throughout the edgetools.org platform, ensuring visual consistency across analytical tools.
The Gold theme specifically targets precious metals analysis with warm tones that complement gold chart analysis, while the Quant theme provides a grayscale scheme suitable for analytical environments that prioritize clarity over aesthetic appeal. The Behavioral theme incorporates psychology-based color coding, using green to represent greed-driven market conditions and red to indicate fear-driven environments.
Additional themes include Ocean, Fire, Matrix, and Arctic schemes, each designed for specific market conditions or user preferences. All themes function effectively with both dark and light mode trading platforms, ensuring accessibility across different user interface configurations.
PRACTICAL APPLICATIONS
Asset allocation and portfolio construction represent primary use cases for this analytical framework. When comparing multiple assets such as Bitcoin, gold, and the S&P 500, traders can examine Risk Efficiency Scores to identify instruments offering superior risk-adjusted performance. The 95% VaR provides worst-case scenario comparisons, while volatility-adjusted drawdowns enable fair comparison despite varying volatility profiles.
The practical decision framework suggests that assets with Risk Efficiency Scores above 70 may be suitable for aggressive portfolio allocations, scores between 40 and 70 indicate moderate allocation potential, and scores below 40 suggest defensive positioning or avoidance. These thresholds should be adjusted based on individual risk tolerance and market conditions.
Risk management and position sizing applications utilize the current percentile rank to guide allocation decisions. When the current drawdown ranks above the 75th percentile of historical data, indicating that current conditions are better than 75% of historical periods, position increases may be warranted. Conversely, when percentile rankings fall below the 25th percentile, indicating elevated risk conditions, position reductions become advisable.
Institutional portfolio monitoring applications include hedge fund risk dashboard implementations where multiple strategies can be monitored simultaneously. Sharpe ratio tracking identifies deteriorating risk-adjusted performance across strategies, VaR monitoring ensures portfolios remain within established risk limits, and drawdown duration tracking provides valuable information for investor reporting requirements.
Market timing applications combine the statistical analysis with trend identification techniques. Strong buy signals may emerge when risk levels register as "Low" in conjunction with established uptrends, while extreme risk levels combined with downtrends may indicate exit or hedging opportunities. Z-scores exceeding 3.0 often signal statistically oversold conditions that may precede trend reversals.
STATISTICAL SIGNIFICANCE AND VALIDATION
The indicator provides 95% confidence intervals around current drawdown levels using the standard formula CI = μ ± 1.96σ. This statistical framework enables users to assess whether current conditions fall within normal market variation or represent statistically significant departures from historical patterns.
Risk level classification employs a dynamic assessment system based on percentile ranking within the historical distribution. Low risk designation applies when current drawdowns perform better than 50% of historical data, moderate risk encompasses the 25th to 50th percentile range, high risk covers the 10th to 25th percentile range, and extreme risk applies to the worst 10% of historical drawdowns.
Sample size considerations play a crucial role in statistical reliability. For daily data, the system requires a minimum of 252 trading days (approximately one year) but performs better with 500 or more observations. Weekly data analysis benefits from at least 104 weeks (two years) of history, while monthly data requires a minimum of 60 months (five years) for reliable statistical inference.
IMPLEMENTATION BEST PRACTICES
Parameter optimization should consider the specific characteristics of different asset classes. Equity analysis typically benefits from 500-day lookback periods with 21-day smoothing, while cryptocurrency analysis may employ 365-day lookback periods with 14-day smoothing to account for higher volatility patterns. Fixed income analysis often requires longer lookback periods of 756 days with 34-day smoothing to capture the lower volatility environment.
Multi-timeframe analysis provides hierarchical risk assessment capabilities. Daily timeframe analysis supports tactical risk management decisions, weekly analysis informs strategic positioning choices, and monthly analysis guides long-term allocation decisions. This hierarchical approach ensures that risk assessment occurs at appropriate temporal scales for different investment objectives.
Integration with complementary indicators enhances the analytical framework. Trend indicators such as RSI and moving averages provide directional bias context, volume analysis helps confirm the severity of drawdown conditions, and volatility measures like VIX or ATR assist in market regime identification.
ALERT SYSTEM AND AUTOMATION
The automated alert system monitors five distinct categories of risk events. Risk level changes trigger notifications when drawdowns move between risk categories, enabling proactive risk management responses. Statistical significance alerts activate when Z-scores exceed established threshold levels of 2.5 or 3.0 standard deviations.
New maximum drawdown alerts notify users when historical maximum levels are exceeded, indicating entry into uncharted risk territory. Poor risk efficiency alerts trigger when the composite risk efficiency score falls below 30, suggesting deteriorating risk-adjusted performance. Sharpe ratio decline alerts activate when risk-adjusted performance turns negative, indicating that returns no longer compensate for the risk undertaken.
TRADING STRATEGIES
Conservative risk parity strategies can be implemented by monitoring Risk Efficiency Scores across a diversified asset portfolio. Monthly rebalancing maintains equal risk contribution from each asset, with allocation reductions triggered when risk levels reach "High" status and complete exits executed when "Extreme" risk levels emerge. This approach typically results in lower overall portfolio volatility, improved risk-adjusted returns, and reduced maximum drawdown periods.
Tactical asset rotation strategies compare Risk Efficiency Scores across different asset classes to guide allocation decisions. Assets with scores exceeding 60 receive overweight allocations, while assets scoring below 40 receive underweight positions. Percentile rankings provide timing guidance for allocation adjustments, creating a systematic approach to asset allocation that responds to changing risk-return profiles.
Market timing strategies with statistical edges can be constructed by entering positions when Z-scores fall below -2.5, indicating statistically oversold conditions, and scaling out when Z-scores exceed 2.5, suggesting overbought conditions. The 95% VaR serves as a stop-loss reference point, while trend confirmation indicators provide additional validation for position entry and exit decisions.
LIMITATIONS AND CONSIDERATIONS
Several statistical limitations affect the interpretation and application of these risk measures. Historical bias represents a fundamental challenge, as past drawdown patterns may not accurately predict future risk characteristics, particularly during structural market changes or regime shifts. Sample dependence means that results can be sensitive to the selected lookback period, with shorter periods providing more responsive but potentially less stable estimates.
Market regime changes can significantly alter the statistical parameters underlying the analysis. During periods of structural market evolution, historical distributions may provide poor guidance for future expectations. Additionally, many financial assets exhibit return distributions with fat tails that deviate from normal distribution assumptions, potentially leading to underestimation of extreme event probabilities.
Practical limitations include execution risk, where theoretical signals may not translate directly into actual trading results due to factors such as slippage, timing delays, and market impact. Liquidity constraints mean that risk metrics assume perfect liquidity, which may not hold during stressed market conditions when risk management becomes most critical.
Transaction costs are not incorporated into risk-adjusted return calculations, potentially overstating the attractiveness of strategies that require frequent trading. Behavioral factors represent another limitation, as human psychology may override statistical signals, particularly during periods of extreme market stress when disciplined risk management becomes most challenging.
TECHNICAL IMPLEMENTATION
Performance optimization ensures reliable operation across different market conditions and timeframes. All technical analysis functions are extracted from conditional statements to maintain Pine Script compliance and ensure consistent execution. Memory efficiency is achieved through optimized variable scoping and array usage, while computational speed benefits from vectorized calculations where possible.
Data quality requirements include clean price data without gaps or errors that could distort distribution analysis. Sufficient historical data is essential, with a minimum of 100 bars required and 500 or more preferred for reliable statistical inference. Time alignment across related assets ensures meaningful comparison when conducting multi-asset analysis.
The configuration parameters are organized into logical groups to enhance usability. Core settings include the Distribution Analysis Period (100-2000 bars), Drawdown Smoothing Period (1-50 bars), and Price Source selection. Advanced metrics settings control risk-free rate sourcing, either from live market data or fixed rate specification, along with toggles for various risk-adjusted metric calculations.
Display options provide flexibility in visual presentation, including color theme selection from eight available schemes, automatic dark mode optimization, and control over table display, position lines, percentile bands, and standard deviation overlays. These options ensure that the indicator can be adapted to different analytical workflows and visual preferences.
CONCLUSION
The Drawdown Distribution Analysis indicator provides risk management tools for traders seeking to understand their current position within historical risk patterns. By combining established statistical methodology with practical usability features, the tool enables evidence-based risk assessment and portfolio optimization decisions.
The implementation draws upon established academic research while providing practical features that address real-world trading requirements. Dynamic risk-free rate integration ensures accurate risk-adjusted performance calculations, while multiple color schemes accommodate different analytical preferences and use cases.
Academic compliance is maintained through transparent methodology and acknowledgment of limitations. The tool implements peer-reviewed statistical techniques while clearly communicating the constraints and assumptions underlying the analysis. This approach ensures that users can make informed decisions about the appropriate application of the risk assessment framework within their broader trading and investment processes.
BIBLIOGRAPHY
Artzner, P., Delbaen, F., Eber, J.M. and Heath, D. (1999) 'Coherent Measures of Risk', Mathematical Finance, 9(3), pp. 203-228.
Chekhlov, A., Uryasev, S. and Zabarankin, M. (2005) 'Drawdown Measure in Portfolio Optimization', International Journal of Theoretical and Applied Finance, 8(1), pp. 13-58.
Goldberg, L.R. and Mahmoud, O. (2017) 'Drawdown: From Practice to Theory and Back Again', Journal of Risk Management in Financial Institutions, 10(2), pp. 140-152.
Jorion, P. (2007) Value at Risk: The New Benchmark for Managing Financial Risk. 3rd edn. New York: McGraw-Hill.
Markowitz, H. (1952) 'Portfolio Selection', Journal of Finance, 7(1), pp. 77-91.
Sharpe, W.F. (1966) 'Mutual Fund Performance', Journal of Business, 39(1), pp. 119-138.
Sortino, F.A. and Price, L.N. (1994) 'Performance Measurement in a Downside Risk Framework', Journal of Investing, 3(3), pp. 59-64.
Young, T.W. (1991) 'Calmar Ratio: A Smoother Tool', Futures, 20(1), pp. 40-42.

WT_CROSS Dip Buy Signal(ozkan)This script identifies potential buy opportunities based on WaveTrend (WT_CROSS) momentum crossing below the -60 level — often indicating oversold conditions.
Additional filters include price being above the Kaufman Adaptive Moving Average (KAMA) and volume below the 5-period average, which helps isolate pullbacks within an uptrend.
Buy Signal Conditions:
WT1 < -60
Price > KAMA
Volume < 5-period SMA of volume
Purpose:
To capture early entries at possible local bottoms during bullish trends while avoiding high-volume breakdown traps.
🔔 You can also set an alert based on this condition.
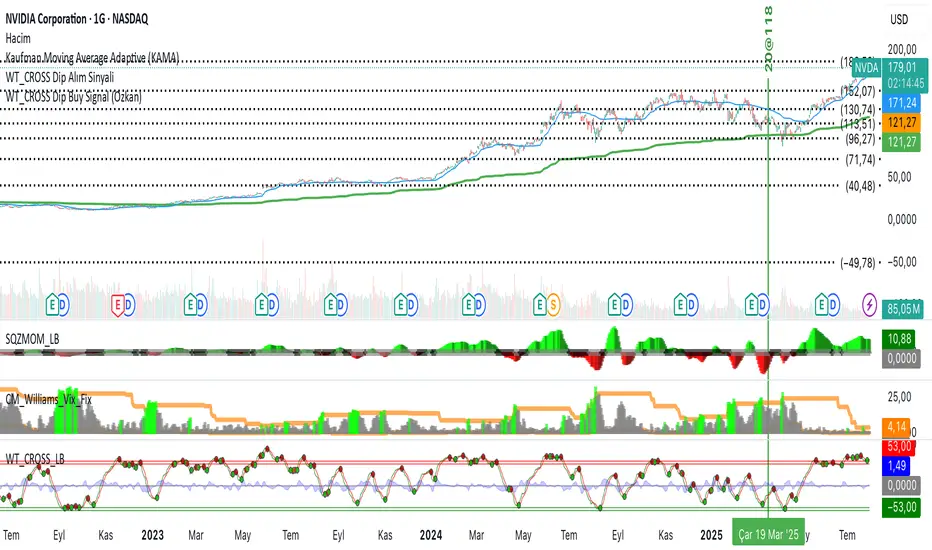
RSI SMA 7 Signal Strategy (No 50 Level)Script uses SMA 7 Perio and 14 Period RSI
If SMA crosses 40 RSI level from below consider it a buy zone or buy signal, if SMA crosses from below 60 RSI level, then super bullish, IF SMA crosses 60 RSI level from above its a profit taking time and Sell zone, if SMA crosses 40 level from above then super bearish sell signal.