Bollinger Bands with momentum SMA'sA useful tool to look for add on opportunities. The settiing are such that 4Hr shows a Bollinger band for the daily TF. That's the settings to get a higher time frame picture but with a lower time frame focus
在腳本中搜尋"弘历投教boll指标代码分析"

Bollinger Bands Width TresholdsBasic Bollinger Bands Bandwidth. I added dashed lines to indicate the 6%/9% treshold where it's likely to squeeze.

Bollinger Bands Strategy (MA type)The types of moving averages that Mr. Kıvanç Özbilgiç uses in his indicators and especially the "MACD Reloaded" and "SuperTrended Moving Averages" indicators gave me an idea.
Better results can be obtained in different time frames by increasing the range of Moving averages used in Bollinger Bands.
It is a trial and educational work only.

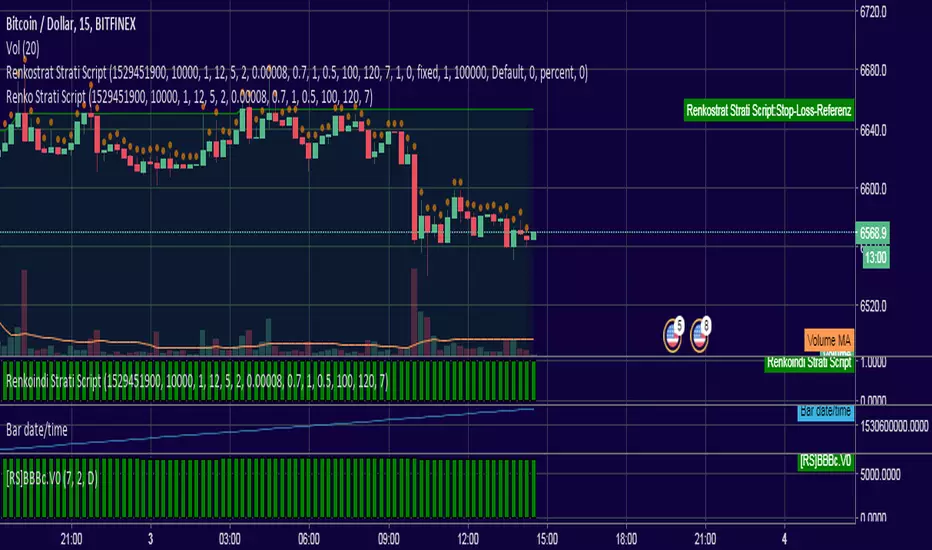
Bollinger Bands Strategy with StopLossThis is the default Bollinger Bands Strategy with a small change to support Stop Loss.
The default built-int BBS does not support Stop Loss and using it may cause large losses, specially in margin trading.
Added inputs:
Source
Stop Loss Percentage
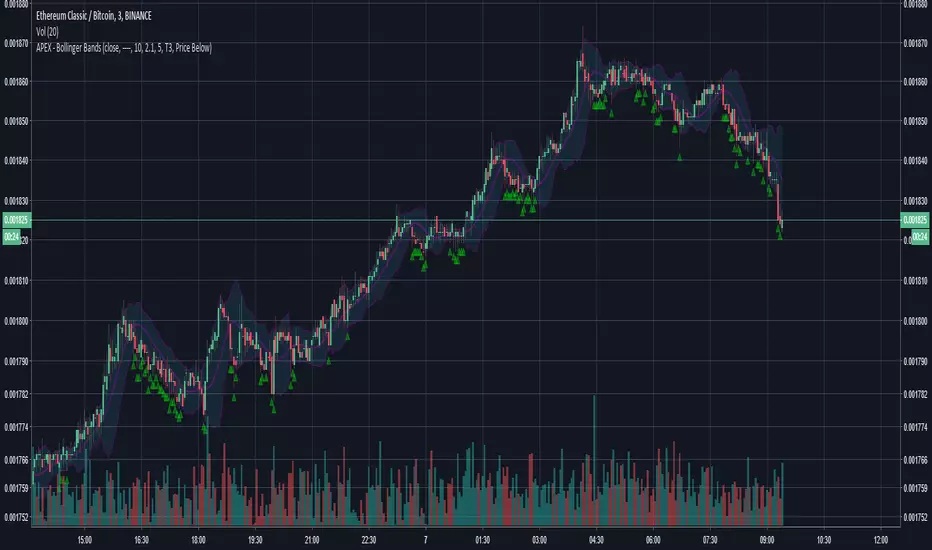
Bollinger band & Volume based strategy V2this script is upgraded version of previous one the major change is deleted script which find a highest price after entry the last of strategy is same.
If current volume is above daily average volume, and three bollinger band`s Standard Deviation, 1 and 1.5 and 2 if the current lowest price is bigger then 1 stdev and current closed is bigger then 1.5 stdev and the last,highest price is above 2.0 stdev, it defined current market is bullish and had momentum.
and the Short will entered when ma60 and ma120 is undercrossed it work as prevent current price is way lower then entry price.
**this script is working in 15min Only in BTC market or USDT**
** basic equity setting is 500$, set your own**
**if you will use this in real-trade,plz comment the result to me**
Ps: i wanna know why my script is only working well in 15 min tick, anyone who has similar phenomenon or if you had a answer about it, please comment me.

Bollinger Bands Ultra [DM]Greetings Colleagues
I share here the classic Bollinger Bands indicator
From the Alma series that I am sharing, this is the third.
Fibonacci levels have been added to the bands to the delight of those who use this technique.
The moving average has also been replaced by an Arnaud legoux moving average
- Available settings:
1. MA length, deviation and offset
2. Individual settings for the MA "basis" (offset and sigma)
3. Activate or deactivate recurring alerts at the crossing of the mean and the ends of the bands
4. Color shift of the Moving average "basis"
5. Color change of the body of the bands
6. Bar color change
If you like them, I encourage you to share the most suitable settings you found for this variant.

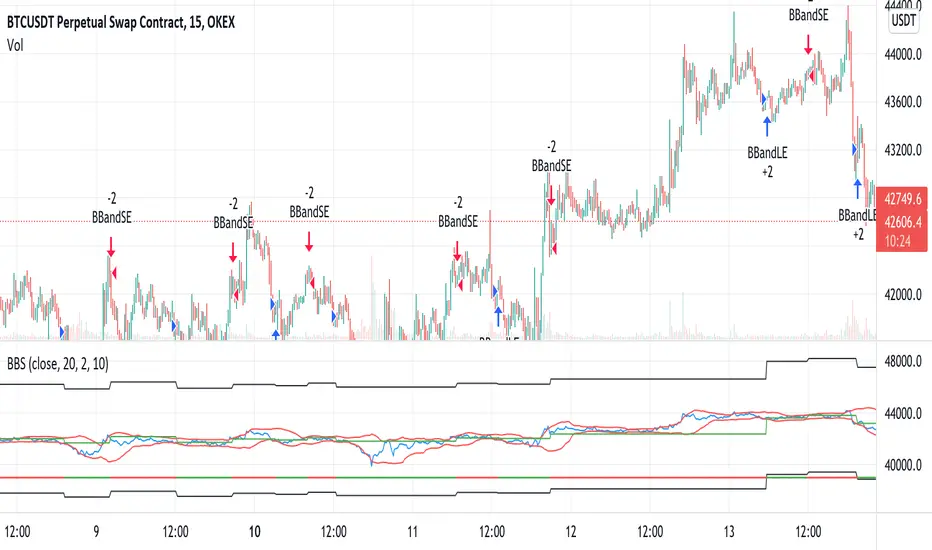
Bollinger Bands SRThis simple script base on Bollinger Bands to defined Support and Resistance and marked Bar False broken SR by Reversal Arrow. Detail of rule as below:
================================================
1.Defined Support and Resistance
1.1.Support
+ Key bar:
- Open Price lower than BB lower band, Close Price higher than BB lower band
+ Support Zone:
- Bottom Zone place at Low Price of Key bar
- Top Zone place at Median Price (HL2) of Key bar
1.2.Resistance
+ Key bar:
- Open Price higher than BB upper band, Close Price lower than BB upper band
+ Resistance Zone:
- Bottom Zone place at Median Price (HL2) of Key bar
- Top Zone place at High Price of Key bar
1.3.Median Line
+ Median Line place at half of Range limit by Support and Resistance
================================================
2.Defined False Break
2.1.Defined Bull Trap
+ High Price higher than Top of Resistance Zone
+ Close Price lower than Top of Resistance Zone
+ Open Price higher than Bottom of Resistance Zone
+ Bar Direction is downward
+ Body of current Bar greater than Body of previous bar
2.2.Defined Bear Trap
+ Low Price lower than Bottom of Support Zone
+ Close Price higher than Bottom of Support Zone
+ Open Price lower than Top of Support Zone
+ Bar Direction is upward
+ Body of current Bar greater than Body of previous bar
================================================
3.Defined Reversal Arrow and Alert
+ Arrow Down when Bull Trap appear
+ Arrow Up when Bear Trap appear
+ Alert when Reversal Arrow appear
================================================
4.Trading
4.1.Long Position
+ Consider open positon when Arrow Up appear
+ Stoploss place at Low Price of Arrow Bar
+ Take profit at Resistance Zone
+ Consider Exit Position when:
- Price moving above Median Line and has Bearish Reversal Pattern
4.2.Short Position
+ Consider open positon when Arrow Down appear
+ Stoploss place at High Price of Arrow Bar
+ Take profit at Support Zone
+ Consider Exit Position when:
- Price moving below Median Line and has Bullish Reversal Pattern

Bollinger Bands - 22MADescription:
This indicator uses Bollinger Bands with a set of 22 different moving averages as a center MA plus a custom signal generation and performance measurement modules.

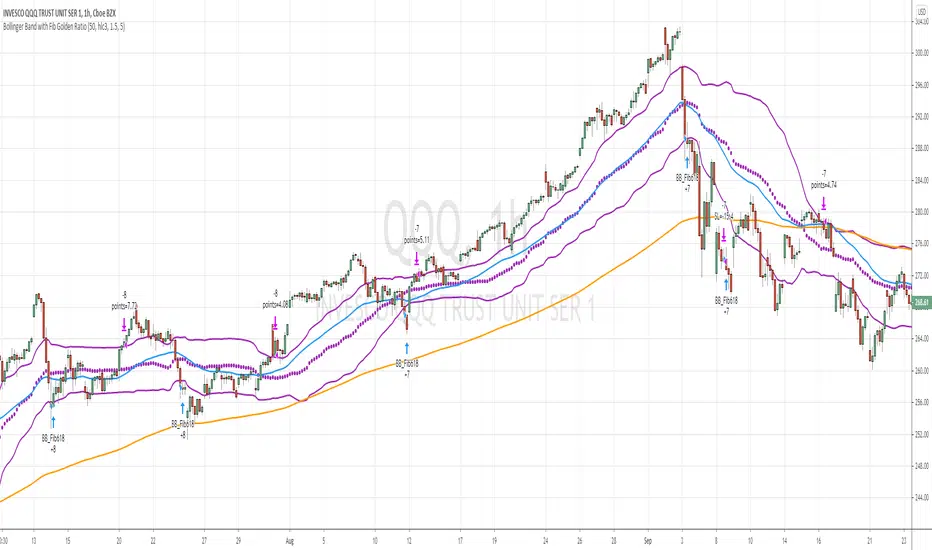
Bollinger Band with Fib Golden Ratio (0.618)This startegy uses Fib level (0.618) of Bollinger Band for long entry. I find this is the only strategy which gives similar results on the different time frames. I have tested QQQ for 1H, 2H , 3H and 4H charts , all showed over 70% winning rate.
BB settings 50 , mult 1.5 (or you can use 2.5 or 3 )
Note: for the basis I have used VWMA instead of SMA .
BUY
=========
ema 50 is above ema 200
when the price close or low touches BB50(Fib0.615) lower band
Exit
=========
when the price crossover BB50(Fib0.615) upper band
Stop Loss
=========
Stop oss set to 5% , configurable
Strategy works similar to mean reversion style. When it touches the lower bans (which 0.615 level of the BB50) , it bounces from there.
Warning
=========
This strategy is for educational purposes only. Please do your own reserach for trading decissions.

Bollinger Bands BreakoutThis indicator applies Bollinger Bands to a line* that represents the difference in closing prices to produce buy & sell signals.
*Equation of line = close - previous close
Enjoy, and hit the follow button to get easy access to my latest indicators!

Multi Bollinger BandsBollinger Bands across multiple configurable time frames (Default - 1H, 2H, 4H, 1D)
You can show / hide individual bands from the settings

Bollinger levelesSimilar to VRSI level script , only this time I use bolliger
plus add similar to a fib system to it
the cross up or down of high and low are optional if you want to see as L=low.h = high
so it a bollinger just it look different:)

Bollinger Breakout IndicatorA script to find breakouts/bullish movement in alt coins.This script builds up on the awesome bollinger indicator and analyzes the breakouts

Bollinger Bands T3/SMA/EMAModify the collor of the scandlestick to the trend using as core the Bollinger

Bollinger Bands Width Expansion IdentifierFind out if the Bollinger Band Width has rapidly expanded compared to the N number of previous periods.
I've written a function: 'bbw_expansion' that performs this check so that it can be incorporated in other projects of mine.
Example: bbw_expansion(bbw, 5, 1.2) will return 'true' if 'bbw' is 20% greater (or more) compared to the last 5 bbw periods.
The function returns: 'true' or 'false'

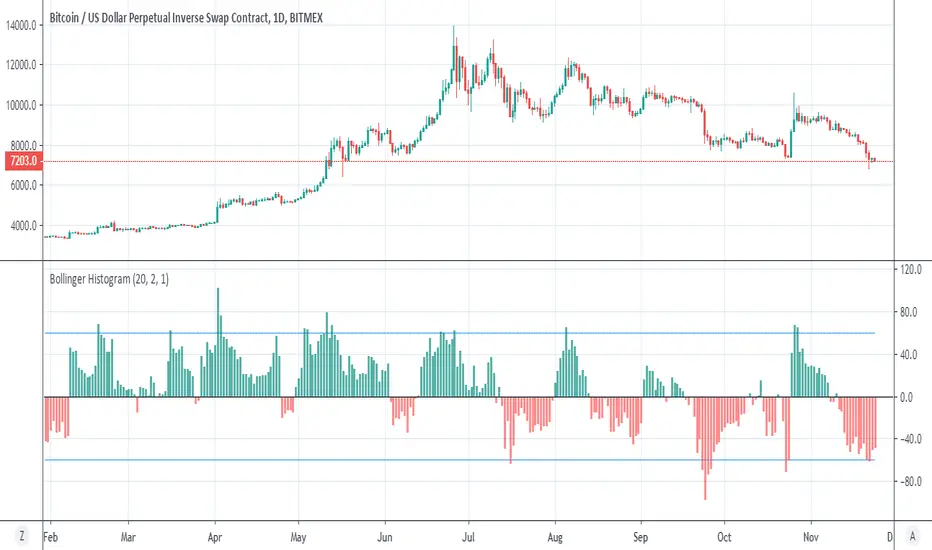
Bollinger HistogramIn the same way that I make the donchian histogram , we can make a histogram for bollinger
above zero =buy , green color
bellow zero =sell. red color
try to play with setting to get optimal results
Bollinger MTFSo this is a Bollinger resistance and support map, I just convert it to v4 and add info for current upper and lower levels
The length is 60 (instead of regular 20) and we make it to be MTF
Ok , so how this system work
we choose TF and I normaly use 3x or 4X of the MTF (you can choose your own)
then we need to decide if we want to long or short
if we go long then the buy point will be the lower value and TP will be TP in green -
If we go short then our entry value will be upper and TP (take profit) will be in red
so one can put few tweeks and make this system to be more automatic , but I just show this as a easy concept for trade system
the main issue in such system is properly to decide when to go short or when to go long
that why you need to add other indicators in order to make this call and make this system effective

Bollinger BandwidthThe bandwidth is the difference (gap) between the upper band and the lower band.
This Bandwidth indicator takes the current Width of the Bollinger Bands and compares it to the Maximum and Minimum Width of the Bands over N periods
If the calculated percentage is less than or equal to X Percent (which we will specify), then the histogram shows yellow. If the calculated percentage is greater than the X Percent, then the histogram shows Red.
This works out well to quickly see if the currency pair is ranging (Yellow) and if it has broken out of range (Red)
To have a valid trade, the bandwidth indicator must be Yellow which means prices are contained within a tight range. This give us the opportunity to be able to trade inside the band picking top and bottom of the range with the help of the Stochastic indicator.