OPEN-SOURCE SCRIPT
K's Volatility Bands
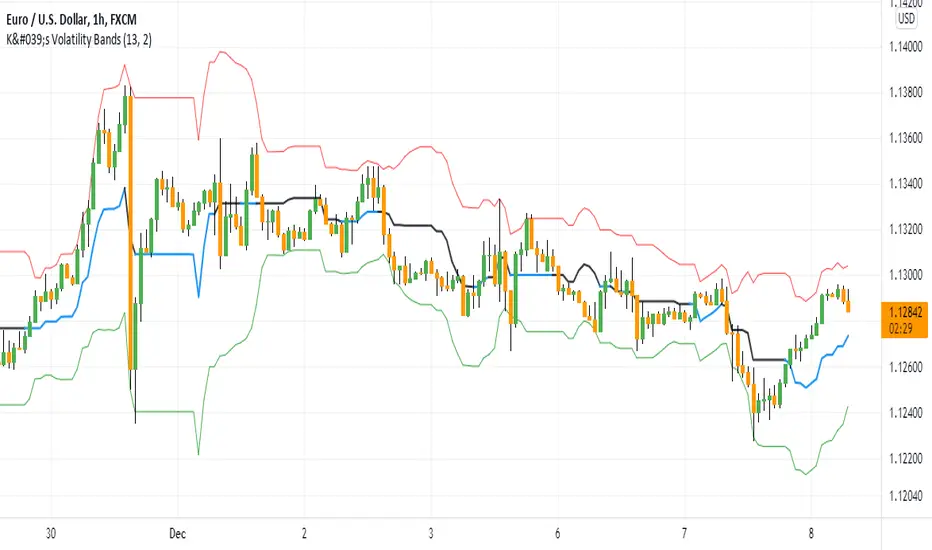
Volatility bands come in all shapes and forms contrary to what is believed. Bollinger bands remain the principal indicator in the volatility bands family. K's Volatility bands is an attempt at optimizing the original bands. Below is the method of calculation:
* We must first start by calculating a rolling measure based on the average between the highest high and the lowest low in the last specified lookback window. This will give us a type of moving average that tracks the market price. The specificity here is that when the market does not make higher highs nor lower lows, the line will be flat. A flat line can also be thought of as a magnet of the price as the ranging property could hint to a further sideways movement.
* The K’s volatility bands assume the worst with volatility and thus will take the maximum volatility for a given lookback period. Unlike the Bollinger bands which will take the latest volatility calculation every single step of time, K’s volatility bands will suppose that we must be protected by the maximum of volatility for that period which will give us from time to time stable support and resistance levels.
Therefore, the difference between the Bollinger bands and K's volatility bands are as follows:
* Bollinger Bands' formula calculates a simple moving average on the closing prices while K's volatility bands' formula calculates the average of the highest highs and the lowest lows.
* Bollinger Bands' formula calculates a simple standard deviation on the closing prices while K's volatility bands' formula calculates the highest standard deviation for the lookback period.
Applying the bands is similar to applying any other volatility bands. We can list the typical strategies below:
* The range play strategy: This is the usual reversal strategy where we buy whenever the price hits the lower band and sell short whenever it hits the upper band.
* The band re-entry strategy: This strategy awaits the confirmation that the price has recognized the band and has shaped a reaction around it and has reintegrated the whole envelope. It may be slightly lagging in nature but it may filter out bad trades.
* Following the trend strategy: This is a controversial strategy that is the opposite of the first one. It assumes that whenever the upper band is surpassed, a buy signal is generated and whenever the lower band is broken, a sell signal is generated.
* Combination with other indicators: The bands can be combined with other technical indicators such as the RSI in order to have more confirmation. This is however no guarantee that the signals will improve in quality.
* Specific strategy on K’s volatility bands: This one is similar to the first range play strategy but it adds the extra filter where the trade has a higher conviction if the median line is flat. The reason for this is that a flat line means that no higher highs nor lower lows have been made and therefore, we may be in a sideways market which is a fertile ground for mean-reversion strategies.
開源腳本
本著TradingView的真正精神,此腳本的創建者將其開源,以便交易者可以查看和驗證其功能。向作者致敬!雖然您可以免費使用它,但請記住,重新發佈程式碼必須遵守我們的網站規則。
免責聲明
這些資訊和出版物並不意味著也不構成TradingView提供或認可的金融、投資、交易或其他類型的意見或建議。請在使用條款閱讀更多資訊。
開源腳本
本著TradingView的真正精神,此腳本的創建者將其開源,以便交易者可以查看和驗證其功能。向作者致敬!雖然您可以免費使用它,但請記住,重新發佈程式碼必須遵守我們的網站規則。
免責聲明
這些資訊和出版物並不意味著也不構成TradingView提供或認可的金融、投資、交易或其他類型的意見或建議。請在使用條款閱讀更多資訊。