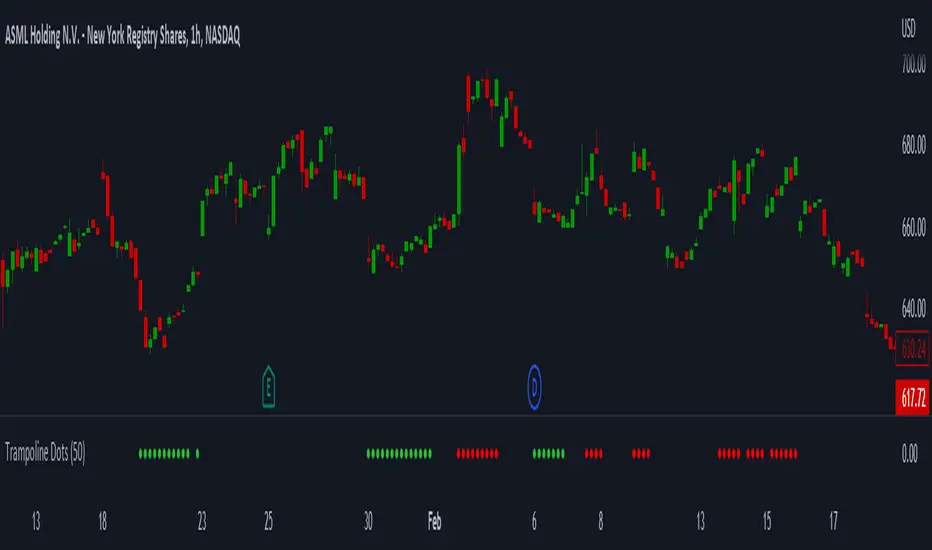
Trampoline DotsTrampoline Dots (Price Divergence)
Higher Time Frame Price Divergence:
Trampoline Dots serve as a "quick bounce" tool. These little dots will trigger whenever the higher aggregation MACD is above / below zero and the price is below / above the 50 period simple moving average. When these criteria are met, the price is usually under pressure of strong divergence, more often than not price will sharply reverse into the trend direction usually within the next few bars.
The Use of The Trampoline Dots:
This indicator can serve multiple ways. Obviously the main use case is the price divergence. These "dots" will not give you any precise & exact entry. But rather a zone of possible incoming reversal. There is no timing to it. All these dots will do is warn you about potential sharp reversal in the upcoming bars. It can be used by itself alone for sure, but the best way to utilize the dots is to use them in combination of other trend or momentum studies. The best signals are the ones that are within the larger time frame trend. Another great thing is that the visuals are really straight-forward and simple. It is either green dot or a red dot. Nothing more, nothing less. Also since the indicator is pretty small, it can be easily layered onto other studies as well which can create an additional confirmation for different patterns or setups.
Which Time Frame Are Reliable?
This indicator works on any time frame. But the most "stable" one is the daily & hourly time frame. My personal favorite is the hourly since these divergences can produce amazing entries in the daily trends (which are usually hidden on the daily chart). In the most aggresive trends, I like to see the green dots triggering around the 8 EMA and 13 EMA. Daily chart can show the daily and weekly (big divergences) that can take multiple days & weeks to resolve.
Hope it helps.
在腳本中搜尋"手机同花顺macd指标超出框架"
Super 8 - 30M BTCWelcome to Super 8, the ultimate automatic trading script for Pine!
This bad boy is designed to go both long and short, and it's equipped with all the tools you need to maximize your profits. Whether you're looking to take profit, set a trailing stop, or protect yourself with a stop loss, Super 8 has you covered.
But that's not all! Super 8 is also loaded with 8 powerful indicators to help you make informed decisions. We've got the EMA, ADX, SAR, MACD, VOLUME, BOLLINGER BANDS, DONCHIAN, and ATR all working together to give you the best possible trading experience.
And if you want to take it to the next level, Super 8 also has a feature that lets you use stepped entries in normal mode or incremental 1,2,3,... to improve your average price. Plus, if you're using trailing stop, you can activate the Backtest precision to use lower timeframes.
But what's in a name? Super 8 is called that because it's just that... super! It's tailored specifically for the OKX:BTCUSDT.P pair, so you know you're getting the best possible results. it's highly adjustable and can be used with any other pair. So no matter what market you're trading in, Super 8 has got you covered.
So if you want to level up your trading game, give Super 8 a try. You won't be disappointed.
Certain Risks of Live Algorithmic Trading:
Backtesting Cannot Assure Actual Results.
The relevant market might fail or behave unexpectedly.
Your broker may experience failures in its infrastructure, fail to execute your orders in a correct or timely fashion or reject your orders.
The system you use for generating trading orders, communicating those orders to your broker, and receiving queries and trading results from your broker may fail.
Time lag at various point in live trading might cause unexpected behavior.
The systems of third parties in addition to those of the provider from which we obtain various services, your broker, and the applicable securities market may fail or malfunction.

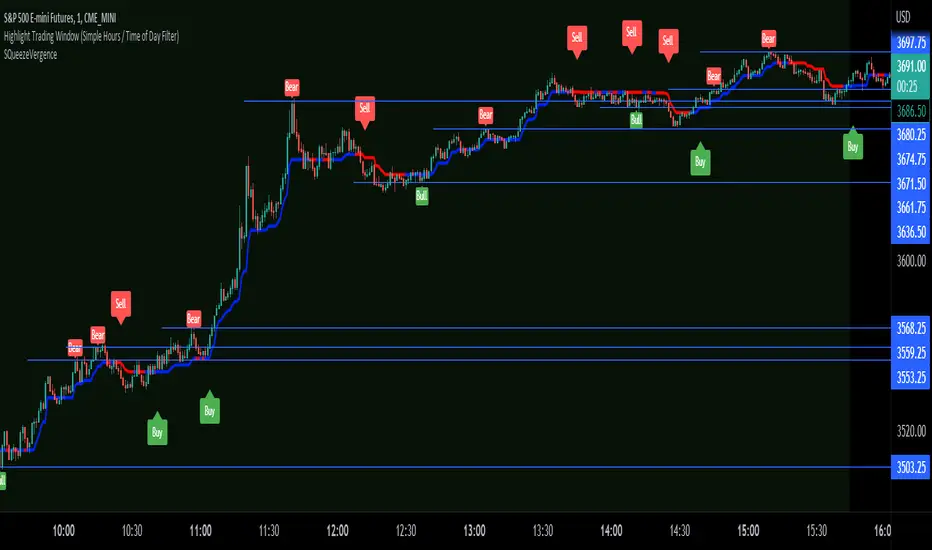
SQueezeVergenceThis is my SQueezeVergence indicator. It fires Buy and Sell signals based on squeeze momentum and trend. **It also creates Bull and Bear signals based on MACD divergence which should only be used as areas of support and resistance being as these signals repaint based on a 5 candle look back of pivots.** All settings are editable for better use. The default settings are what I use on the 1 Minute chart of ES to scalp. This is a simple indicator to help me get alerts on when I need to scalp. The divergence signals work well for areas of significance. I like to watch for breaks of these levels along with support and resistance. I hope this helps.

Swing High/Low Indicator w/ MACD and HTF EMA'sSwing High/Low Indicator w/ MACD and EMA Confirmations by KaizenTraderB
I designed this indicator to be used with a market structure break strategy.
It labels swing highs and lows that are confirmed by the MACD.
It also displays a higher timeframe Fast and Slow EMA to determine directional bias.
Also provides alerts that signal Swing Low breaks in downtrends and Swing High Breaks in uptrends.
It draws a horizontal line on the last Swing High and Low.
Display this indicator on your entry timeframe and choose your Higher Timeframe in settings.
You can also change lookback period for Swing Highs and Lows and EMA's.
When I use this I am looking for the Swing High/Low break in direction of HTF Trend
Then look for pullback between price level of break and areas of liquidity (wicks, order blocks, price congestion) for entry in direction of EMA trend.

Price Acceleration Convergence Divergence V2This is a fork of the previous PACD indicator i made by working out the RSI another two times. it works the exact same but is more leading in trend reversals and divergences.
this indicator plots 4x the RSI of the RSI of the price using the derivatives of RSI. Data is plotted just like the MACD.
points 5 and -5 are very strong support/resistance points and should be very important points to take note of.
use this indicator like the MACD essentially with the assistance of a 4x RSI momentum. enjoy

Sonic R + Linear Reg + Kumo Cloud + Barcolor MACDSoni R with Linear Reg + Kumo CLoud + Barclolor MACD:
Buy or Sell signal, stoploss and take profit with 3:1 RR don't close when appear signal close.
When barcolor is red, don't buy, and when it is green, don't sell.
Enjoy, and goodluck!
Sr for bad english.

RSI Convergence DivergenceRSI based oscillator inspired by the MACD.
Indicator that consists of two RSI calibrated at different lengths to take advantage of their convergence, divergence, overall direction, overall strength and several other metrics to extract signals from the price action.
This indicator includes:
- Fast RSI
- Slow RSI
- Signal line to identify convergence/divergence
- Simple moving average applied to the average of the two RSI
- DEMA applied to the average of the two RSI
- An average moving average of the SMA and DEMA
Some of the applications of this indicator:
- Simple convergence/divergence signaled by the moving average going above or below zero.
- Crossover between SMA and DEMA
- Combination of convergence/divergence and one of the 3 MAs reaching overbought or oversold threshold
- Average moving average going above or below 50
The combinations of different conditions are countless and limited only by the imagination of the user.
The visualization inputs, besides allowing to choose the candle coloring, give the user the ability to keep the chart clean and only see the signals he is interested into.

Momentum-based ZigZag (incl. QQE) NON-REPAINTINGI spent a lot of time searching for the best ZigZag indicator. Difficulty with all of them is that they are always betting on some pre-defined rules which identify or confirm pivot points. Usually it is time factor - pivot point gets confirmed after a particular number of candles. This methodology is probably the best when market is moving relatively slow, but when price starts chopping up and down, there is no way the ZigZag follows accurately. On the other hand if you set it too tight (for example pivot confirmation after only 2 or even 1 candle), you will get hundreds of zigzag lines and they will tell you nothing.
My point of view is to follow the market. If it has reversed, then it has reversed, and there is no need to wait pre-defined number of candles for the confirmation. Such reversals will always be visible on momentum indicators, such as the most popular MACD. But a single-line moving average can be also good enough to notice reversals. Or my favourite one - QQE, which I borrowed (and improved) from JustUncleL, who borrowed it from Glaz, who borrowed it from... I don't even know where Quantitative Qualitative Estimation originates from. Thanks to all these guys for their input and code.
So whichever momentum indicator you choose - yes, there is a pick-your-poison-type selector as in in-famous Moving Average indicators - once it reverses, a highest (or lowest) point from the impulse is caught and ZigZag gets printed.
One thing I need to emphasize. This indicator DOES NOT REPAINT. It might look like the lines are a bit delayed, especially when compared to all the other ZigZag indicators on TradingView, but they are actually TRUE. There is a value in this - my indicator prints pivot points and Zigzag exactly on the moment they have been noticed, not earlier faking to be faster than they could be.
As a bonus, the indicator marks which impulse had strength in it. It is very nice to see a progressing impulse, but without force - a very likely that reversal on a bigger move is happening.
I'm about to publish some more scripts based on this ZigZag algo, so follow me on TradingView to get notified.
Enjoy!

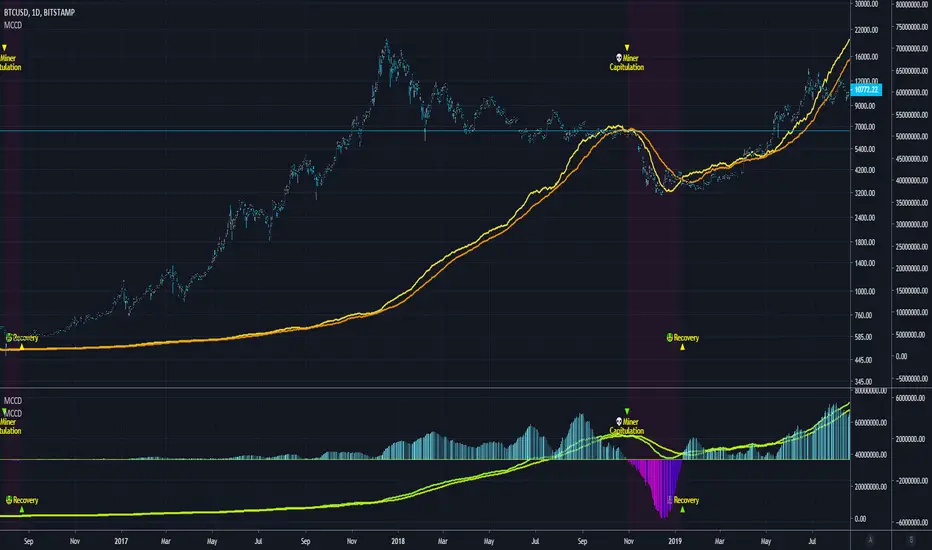
Blockchain Fundamentals - MCCD - Miner Capitulation Conv/Div🔗Blockchain Fundamentals - MCCD - Miner Capitulation & Convergence Divergence
(a.k.a. Hash Ribbons)
Intro
Miner Capitulation has been talked about alot recently in the news and on twitter. I wanted to join the in fun and add my own spin on things.
Description
This shows the 30 (yellow) and 60 (orange) day moving average of the hash rate of bitcoin. I added an option to show the convergence/divergence of the two moving averages in a visual manner similar to the MACD.
I also added the ability to select both the length and type of MA used in the calculation of the capitulation so you can experiment.
Other additions include bar coloration by trade state, and background highlighting of capitulation periods.
Editable Capitulation/Recovery plots will show clearly when the crosses happen.
The way to replicate my display is to add the indicator twice below the chart and combine in the same pane. First indicator displays the averages by default. The second one you enable convergence/divergence display option and uncheck the rest.
Last I add the indicator one more time and dragged it on chart. Do not combine the scales into one, of else it will ruin the scale (you want them separate scales). Its just showing you possibilities, use whatever works for you!
👍 We hope you enjoyed this indicator and find it useful! We post free crypto analysis, strategies and indicators regularly. This is our 73rd script on Tradingview!
💬Check my Signature for other information
Combined Fractal + MACD + Volume Alerts - Buy/SellOverview
This TradingView indicator is designed to save traders hours of manual analysis by automatically combining three powerful market signals into a single alert system:
Williams Fractals – identifies local highs and lows in the price structure.
MACD Crosses – confirms momentum direction and potential trend changes.
Volume Spike Detection – ensures signals occur with meaningful market participation.
The indicator will generate buy and sell alerts only when all three conditions align (or within a short configurable window), allowing traders to focus on high-probability setups without monitoring multiple charts and indicators manually.
Key Features
✅ Combined Alerts – Only triggers when Fractal, MACD, and Volume conditions are met.
✅ Early Alerts – Alerts fire as soon as the conditions occur, giving traders a head start for preparation and analysis.
✅ Optional Visuals – Plots buy/sell markers for testing and strategy verification; can be disabled for a cleaner chart.
✅ Flexible Settings – Users can adjust MACD parameters, volume multipliers, and Fractal ranges to suit their trading style.
✅ Timeframe Agnostic – Works on all timeframes; best on intraday and swing-trading charts.
✅ Non-Repainting Alerts – Ensures reliable signals without misleading historical adjustments.
How It Works
Fractals (Price Structure)
The indicator detects local highs and lows (Williams Fractals) over a configurable range of bars.
Fractals act as a support/resistance or trend turning point filter.
MACD (Momentum Confirmation)
Signals are validated with MACD line and Signal line crosses.
Optional conditions: only alert when MACD crosses above zero for a bullish trend or below zero for a bearish trend.
Volume (Participation Check)
The indicator ensures that any signal occurs with above-average volume, filtering weak or low-confidence signals.
Volume threshold is configurable via a multiplier relative to the average over a selected period.
Combined Logic
Buy Alert: Triggered when a bullish Fractal is formed and MACD crosses up and volume spike occurs.
Sell Alert: Triggered when a bearish Fractal is formed and MACD crosses down and volume spike occurs.
Optionally, the conditions can fire within 3 candles of each other, giving some flexibility for real-market timing.
Benefits for Traders
Saves Time: No need to manually watch multiple indicators.
High-Probability Alerts: Combines trend, structure, and volume for robust signals.
Customizable: Adapt to your trading style, instrument, or timeframe.
Testing & Validation: Optional visuals allow backtesting before relying solely on alerts.
Alerts Anywhere: Works on all tickers and chart timeframes supported by TradingView.
How to Use
Apply the indicator to your TradingView chart.
Configure settings:
Fractal Left/Right range (default: 2 bars).
MACD Fast/Slow/Signal lengths.
Volume multiplier to define “spike.”
Optional: enable/disable visuals for testing.
Set up TradingView alerts using the indicator’s prebuilt alert conditions.
Use the alerts as early heads-up for potential trades; validate with your strategy rules or confluences.
Tips for Traders
Start with defaults: Test on a few symbols and intraday charts first.
Adjust volume multiplier: Avoid too many alerts on low-volume symbols.
Backtest visually: Enable markers to verify signals against historical price action.
Combine with your workflow: Use alerts to prioritize charts rather than trade blindly.
Conclusion
This Combined Fractal + MACD + Volume Alerts Indicator is ideal for traders who want to automate the detection of high-probability setups while maintaining flexibility and control. It streamlines decision-making by combining price structure, momentum, and market participation into a single, actionable alert system.
Whether you are a day trader, swing trader, or part-time trader, this indicator saves time, reduces noise, and helps focus on the most promising trading opportunities.

Smart MACD Volume Trader# Smart MACD Volume Trader
## Overview
Smart MACD Volume Trader is an enhanced momentum indicator that combines the classic MACD (Moving Average Convergence Divergence) oscillator with an intelligent high-volume filter. This combination significantly reduces false signals by ensuring that trading signals are only generated when price momentum is confirmed by substantial volume activity.
The indicator supports over 24 different instruments including major and exotic forex pairs, precious metals (gold and silver), energy commodities (crude oil, natural gas), and industrial metals (copper). For forex and commodity traders, the indicator automatically maps to CME and COMEX futures contracts to provide accurate institutional-grade volume data.
## Originality and Core Concept
Traditional MACD indicators generate signals based solely on price momentum, which can result in numerous false signals during low-activity periods or ranging markets. This indicator addresses this critical weakness by introducing a volume confirmation layer with automatic institutional volume integration.
**What makes this approach original:**
- Signals are triggered only when MACD crossovers coincide with elevated volume activity
- Implements a lookback mechanism to detect volume spikes within recent bars
- Automatically detects and maps 24+ forex pairs and commodities to their corresponding CME and COMEX futures contracts
- Provides real institutional volume data for forex pairs where spot volume is unreliable
- Combines two independent market dimensions (price momentum and volume) into a single, actionable signal
- Includes intelligent asset detection that works across multiple exchanges and ticker formats
**The underlying principle:** Volume validates price movement. When institutional money enters the market, it creates volume signatures. By requiring high volume confirmation and using actual institutional volume data from futures markets, this indicator filters out weak price movements and focuses on trades backed by genuine market participation. The automatic futures mapping ensures that forex and commodity traders always have access to the most accurate volume data available, without manual configuration.
## How It Works
### MACD Component
The indicator calculates MACD using standard methodology:
1. **Fast EMA (default: 12 periods)** - Tracks short-term price momentum
2. **Slow EMA (default: 26 periods)** - Tracks longer-term price momentum
3. **MACD Line** - Difference between Fast EMA and Slow EMA
4. **Signal Line (default: 9-period SMA)** - Smoothed average of MACD line
**Crossover signals:**
- **Bullish:** MACD line crosses above Signal line (momentum turning positive)
- **Bearish:** MACD line crosses below Signal line (momentum turning negative)
### Volume Filter Component
The volume filter adds an essential confirmation layer:
1. **Volume Moving Average** - Calculates exponential MA of volume (default: 20 periods)
2. **High Volume Threshold** - Multiplies MA by ratio (default: 2.0x or 200%)
3. **Volume Detection** - Identifies bars where current volume exceeds threshold
4. **Lookback Period** - Checks if high volume occurred in recent bars (default: 5 bars)
**Signal logic:**
- Buy/Sell signals only trigger when BOTH conditions are met:
- MACD crossover/crossunder occurs
- High volume detected within lookback period
### Automatic CME Futures Integration
For forex traders, spot FX volume data can be unreliable or non-existent. This indicator solves this problem by automatically detecting forex pairs and mapping them to corresponding CME futures contracts with real institutional volume data.
**Supported Major Forex Pairs (7):**
- EURUSD → CME:6E1! (Euro FX Futures)
- GBPUSD → CME:6B1! (British Pound Futures)
- AUDUSD → CME:6A1! (Australian Dollar Futures)
- USDJPY → CME:6J1! (Japanese Yen Futures)
- USDCAD → CME:6C1! (Canadian Dollar Futures)
- USDCHF → CME:6S1! (Swiss Franc Futures)
- NZDUSD → CME:6N1! (New Zealand Dollar Futures)
**Supported Exotic Forex Pairs (4):**
- USDMXN → CME:6M1! (Mexican Peso Futures)
- USDRUB → CME:6R1! (Russian Ruble Futures)
- USDBRL → CME:6L1! (Brazilian Real Futures)
- USDZAR → CME:6Z1! (South African Rand Futures)
**Supported Cross Pairs (6):**
- EURJPY → CME:6E1! (Uses Euro Futures)
- GBPJPY → CME:6B1! (Uses British Pound Futures)
- EURGBP → CME:6E1! (Uses Euro Futures)
- AUDJPY → CME:6A1! (Uses Australian Dollar Futures)
- EURAUD → CME:6E1! (Uses Euro Futures)
- GBPAUD → CME:6B1! (Uses British Pound Futures)
**Supported Precious Metals (2):**
- Gold (XAUUSD, GOLD) → COMEX:GC1! (Gold Futures)
- Silver (XAGUSD, SILVER) → COMEX:SI1! (Silver Futures)
**Supported Energy Commodities (3):**
- WTI Crude Oil (USOIL, WTIUSD) → NYMEX:CL1! (Crude Oil Futures)
- Brent Oil (UKOIL) → NYMEX:BZ1! (Brent Crude Futures)
- Natural Gas (NATGAS) → NYMEX:NG1! (Natural Gas Futures)
**Supported Industrial Metals (1):**
- Copper (COPPER) → COMEX:HG1! (Copper Futures)
**How the automatic detection works:**
The indicator intelligently identifies the asset type by analyzing:
1. Exchange name (FX, OANDA, TVC, COMEX, NYMEX, etc.)
2. Currency pair pattern (6-letter codes like EURUSD, GBPUSD)
3. Commodity identifiers (XAU for gold, XAG for silver, OIL for crude)
When a supported instrument is detected, the indicator automatically switches to the corresponding futures contract for volume analysis. For stocks, cryptocurrencies, and other assets, the indicator uses the native volume data from the current chart.
**Visual feedback:**
An information table appears in the top-right corner of the MACD pane showing:
- Current chart symbol
- Exchange name
- Currency pair or asset name
- Volume source being used (highlighted in orange for futures, yellow for native volume)
- Current high volume status
This provides complete transparency about which data source the indicator is using for its volume analysis.
## How to Use
### Basic Setup
1. Add the indicator to your chart
2. The indicator displays in a separate pane (MACD) and overlay (signals/volume bars)
3. Default settings work well for most assets, but can be customized
### Signal Interpretation
### Visual Signals
**Visual Signals:**
- **Green "BUY" label** - Bullish MACD crossover confirmed by high volume
- **Red "SELL" label** - Bearish MACD crossunder confirmed by high volume
- **Green/Red candles** - Highlight bars with volume exceeding the threshold
- **Light green/red background** - Emphasizes signal bars on the chart
**Information Table:**
A detailed information table appears in the top-right corner of the MACD pane, providing real-time transparency about the indicator's operation:
- **Chart:** Current symbol being analyzed
- **Exchange:** The exchange or data feed being used
- **Pair:** The currency pair or asset name extracted from the ticker
- **Volume From:** The actual symbol used for volume analysis
- Orange color indicates CME or COMEX futures are being used (automatic institutional volume)
- Yellow color indicates native volume from the chart symbol is being used
- Hover tooltip shows whether automatic futures mapping is active
- **High Volume:** Current status showing YES (green) when volume exceeds threshold, NO (gray) otherwise
This table ensures complete transparency and allows you to verify that the correct volume source is being used for your analysis.
**Volume Analysis:**
- Gray histogram bars = Normal volume
- Red histogram bars = High volume (exceeds threshold)
- Green line = Volume moving average baseline
**MACD Analysis:**
- Blue line = MACD line (momentum indicator)
- Orange line = Signal line (trend confirmation)
- Gray dotted line = Zero line (bullish above, bearish below)
### Parameter Customization
**MACD Parameters:**
- Adjust Fast/Slow EMA lengths for different sensitivities
- Shorter periods = More signals, faster response
- Longer periods = Fewer signals, less noise
**Volume Parameters:**
- **Volume MA Period:** Higher values smooth volume analysis
- **High Volume Ratio:** Lower values (1.5x) = More signals; Higher values (3.0x) = Fewer, stronger signals
- **Volume Lookback Bars:** Controls how recent the volume spike must be
**Direction Filters:**
- **Only Buy Signals:** Enables long-only strategy mode
- **Only Sell Signals:** Enables short-only strategy mode
### Alert Configuration
The indicator includes three alert types:
1. **Buy Signal Alert** - Triggers when bullish signal appears
2. **Sell Signal Alert** - Triggers when bearish signal appears
3. **High Volume Alert** - Triggers when volume exceeds threshold
To set up alerts:
1. Click the indicator name → "Add alert on Smart MACD Volume Trader"
2. Select desired alert condition
3. Configure notification method (popup, email, webhook, etc.)
## Trading Strategy Guidelines
### Best Practices
**Recommended markets:**
- Liquid stocks (large-cap, high daily volume)
- Major forex pairs (EURUSD, GBPUSD, USDJPY, AUDUSD, USDCAD, USDCHF, NZDUSD)
- Exotic forex pairs (USDMXN, USDRUB, USDBRL, USDZAR)
- Cross pairs (EURJPY, GBPJPY, EURGBP, AUDJPY, EURAUD, GBPAUD)
- Precious metals (Gold, Silver with automatic COMEX futures mapping)
- Energy commodities (Crude Oil, Natural Gas with automatic NYMEX futures mapping)
- Industrial metals (Copper with automatic COMEX futures mapping)
- Major cryptocurrency pairs
- Index futures and ETFs
**Timeframe recommendations:**
- **Day trading:** 5-minute to 15-minute charts
- **Swing trading:** 1-hour to 4-hour charts
- **Position trading:** Daily charts
**Risk management:**
- Use signals as entry confirmation, not standalone strategy
- Combine with support/resistance levels
- Consider overall market trend direction
- Always use stop-loss orders
### Strategy Examples
**Trend Following Strategy:**
1. Identify overall trend using higher timeframe (e.g., daily chart)
2. Trade only in trend direction
3. Use "Only Buy" filter in uptrends, "Only Sell" in downtrends
4. Enter on signal, exit on opposite signal or at resistance/support
**Volume Breakout Strategy:**
1. Wait for consolidation period (low volume, tight MACD range)
2. Enter when signal appears with high volume (confirms breakout)
3. Target previous swing highs/lows
4. Stop loss below/above recent consolidation
**Forex Scalping Strategy (with automatic CME futures):**
1. The indicator automatically detects forex pairs and uses CME futures volume
2. Trade during active sessions only (use session filter)
3. Focus on quick profits (10-20 pips)
4. Exit at opposite signal or profit target
**Commodities Trading Strategy (Gold, Silver, Oil):**
1. The indicator automatically maps to COMEX and NYMEX futures contracts
2. Trade during high-liquidity sessions (overlap of major markets)
3. Use the high volume confirmation to identify institutional entry points
4. Combine with key support and resistance levels for entries
5. Monitor the information table to confirm futures volume is being used (orange color)
6. Exit on opposite MACD signal or at predefined profit targets
## Why This Combination Works
### The Volume Advantage
Studies consistently show that price movements accompanied by high volume are more likely to continue, while low-volume movements often reverse. This indicator leverages this principle by requiring volume confirmation.
**Key benefits:**
1. **Reduced False Signals:** Eliminates MACD whipsaws during low-volume consolidation
2. **Confirmation Bias:** Two independent indicators (price momentum + volume) agreeing
3. **Institutional Alignment:** High volume often indicates institutional participation
4. **Trend Validation:** Volume confirms that price momentum has "conviction"
### Statistical Edge
By combining two uncorrelated signals (MACD crossovers and volume spikes), the indicator creates a higher-probability setup than either signal alone. The lookback mechanism ensures signals aren't missed if volume spike slightly precedes the MACD cross.
## Supported Exchanges and Automatic Detection
The indicator includes intelligent asset detection that works across multiple exchanges and ticker formats:
**Forex Exchanges (Automatic CME Mapping):**
- FX (TradingView forex feed)
- OANDA
- FXCM
- SAXO
- FOREXCOM
- PEPPERSTONE
- EASYMARKETS
- FX_IDC
**Commodity Exchanges (Automatic COMEX/NYMEX Mapping):**
- TVC (TradingView commodity feed)
- COMEX (directly)
- NYMEX (directly)
- ICEUS
**Other Asset Classes (Native Volume):**
- Stock exchanges (NASDAQ, NYSE, AMEX, etc.)
- Cryptocurrency exchanges (BINANCE, COINBASE, KRAKEN, etc.)
- Index providers (SP, DJ, etc.)
The detection algorithm analyzes three factors:
1. Exchange prefix in the ticker symbol
2. Pattern matching for currency pairs (6-letter codes)
3. Commodity identifiers in the symbol name
This ensures accurate automatic detection regardless of which data feed or exchange you use for charting. The information table in the top-right corner always displays which volume source is being used, providing complete transparency.
## Technical Details
**Calculations:**
- MACD Fast MA: EMA(close, fastLength)
- MACD Slow MA: EMA(close, slowLength)
- MACD Line: Fast MA - Slow MA
- Signal Line: SMA(MACD Line, signalLength)
- Volume MA: Exponential MA of volume
- High Volume: Current volume >= Volume MA × Ratio
**Signal logic:**
```
Buy Signal = (MACD crosses above Signal) AND (High volume in last N bars)
Sell Signal = (MACD crosses below Signal) AND (High volume in last N bars)
```
## Parameters Reference
| Parameter | Default | Description |
|-----------|---------|-------------|
| Volume Symbol | Blank | Manual override for volume source (leave blank for automatic detection) |
| Use CME Futures | False | Legacy option (automatic detection is now built-in) |
| Alert Session | 1530-2200 | Active session time range for alerts |
| Timezone | UTC+1 | Timezone for alert sessions |
| Volume MA Period | 20 | Number of periods for volume moving average |
| High Volume Ratio | 2.0 | Volume threshold multiplier (2.0 = 200% of average) |
| Volume Lookback | 5 | Number of bars to check for high volume confirmation |
| MACD Fast Length | 12 | Fast EMA period for MACD calculation |
| MACD Slow Length | 26 | Slow EMA period for MACD calculation |
| MACD Signal Length | 9 | Signal line SMA period |
| Only Buy | False | Filter to show only bullish signals |
| Only Sell | False | Filter to show only bearish signals |
| Show Signals | True | Display buy and sell labels on chart |
## Optimization Tips
**For volatile markets (crypto, small caps):**
- Increase High Volume Ratio to 2.5-3.0
- Reduce Volume Lookback to 3-4 bars
- Consider faster MACD settings (8, 17, 9)
**For stable markets (large-cap stocks, bonds):**
- Decrease High Volume Ratio to 1.5-1.8
- Increase Volume MA Period to 30-50
- Use standard MACD settings
**For forex (with automatic CME futures):**
- The indicator automatically uses CME futures when forex pairs are detected
- Set appropriate trading session based on your timezone
- Use Volume Lookback of 5-7 bars
- Consider session-based alerts only
- Monitor the information table to verify correct futures mapping
**For commodities (Gold, Silver, Oil, Copper):**
- The indicator automatically maps to COMEX and NYMEX futures
- Increase High Volume Ratio to 2.0-2.5 for metals
- Use slightly higher Volume MA Period (25-30) for smoother analysis
- Trade during active market hours for best volume data
- The information table will show the futures contract being used (orange highlight)
## Limitations and Considerations
**What this indicator does NOT do:**
- Does not predict future price direction
- Does not guarantee profitable trades
- Does not replace proper risk management
- Does not work well in extremely low-volume conditions
**Market conditions to avoid:**
- Pre-market and after-hours sessions (low volume)
- Major news events (volatile, unpredictable volume)
- Holidays and low-liquidity periods
- Extremely low float stocks
## Conclusion
Smart MACD Volume Trader represents a significant evolution of the traditional MACD indicator by combining volume confirmation with automatic institutional volume integration. This dual-confirmation approach significantly improves signal quality by filtering out low-conviction price movements and ensuring traders work with accurate volume data.
The indicator's automatic detection and mapping system supports over 24 instruments across forex, commodities, and metals markets. By intelligently switching to CME and COMEX futures contracts when appropriate, the indicator provides forex and commodity traders with the same quality of volume data that stock traders naturally have access to.
This indicator is particularly valuable for traders who want to:
- Align their entries with institutional money flow
- Avoid getting trapped in false breakouts
- Trade forex pairs with reliable volume data
- Access accurate volume information for gold, silver, and energy commodities
- Combine momentum and volume analysis in a single, streamlined tool
Whether you are day trading stocks, swing trading forex pairs, or positioning in commodities markets, this indicator provides a robust framework for identifying high-probability momentum trades backed by genuine institutional participation. The automatic futures mapping works seamlessly across all supported instruments, requiring no manual configuration or expertise in futures markets.
---
## Support and Updates
This indicator is actively maintained and updated based on user feedback and market conditions. For questions about implementation or custom modifications, please use the comments section below.
**Disclaimer:** This indicator is for educational and informational purposes only. Past performance does not guarantee future results. Always conduct your own analysis and risk management before trading.

Squeeze Momentum MACDSqueeze Momentum MACD
🧠 Description
Squeeze Momentum MACD combines the concept of market volatility compression (the “squeeze”) from Bollinger Bands (BB) and Keltner Channels (KC) with a MACD-style momentum oscillator to reveal potential breakout phases.
The indicator first calculates:
BB Width = Upper Band − Lower Band
KC Width = Upper Band − Lower Band
Then it computes their difference:
Δ = BB Width − KC Width
When Δ > 0 → BB width is greater than KC width → volatility is expanding → potential momentum breakout.
When Δ < 0 → BB is inside KC → volatility is compressing → potential squeeze phase before expansion.
This Δ value is then processed through a MACD-style calculation:
MACD Line = EMA(fast) − EMA(slow)
Signal Line = EMA(MACD, signal length)
Histogram = MACD − Signal
The result is a visual momentum oscillator that behaves like MACD but measures volatility expansion instead of price direction.
🔹 Features:
Dynamic 4-color MACD & Signal lines (positive/negative + rising/falling)
Optional display of raw BB & KC widths
Fully adjustable parameters for BB, KC, and MACD
Works on all timeframes and instruments
🔹 Ideal For:
Detecting market squeezes and breakout momentum
Timing entries before volatility expansion
Integrating volatility and momentum into a single framework

Multi-Timeframe MACD with Color Mix (Nikko)Multi-Timeframe MACD with Color Mix (Nikko) Indicator
This documentation explains the benefits of the "Multi-Timeframe MACD with Color Mix (Nikko)" indicator for traders and provides easy-to-follow steps on how to use it. Written as of 05:06 AM +07 on Saturday, October 04, 2025, this guide focuses on helping you, as a trader, get the most out of this tool with clear, practical advice before diving into the technical details.
Benefits for Traders
1. Multi-Timeframe Insight
This indicator lets you see momentum trends across 15-minute, 1-hour, 1-day, and 1-week timeframes all on one chart. This big-picture view helps you catch both quick market moves and long-term trends without flipping between charts, saving you time and giving you a fuller understanding of the market.
2. Visual Momentum Representation
The background changes from red to green based on short-term (15m) momentum, giving you a quick, easy-to-see signal—red means bearish (prices might drop), and green means bullish (prices might rise). The histogram uses a mix of red, green, and blue colors to show the combined strength of the 1-hour, 1-day, and 1-week timeframes, helping you spot strong trends at a glance (e.g., a bright mix for strong momentum, darker for weaker).
3. Enhanced Decision-Making
The background and histogram colors work together to confirm trends across different timeframes, making it less likely you’ll act on a false signal. This helps you feel more confident when deciding when to buy, sell, or hold.
4. Proactive Alert System
You can set alerts to notify you when the percentage of bullish timeframes hits your chosen levels (e.g., below 10% for bearish, above 90% for bullish). This keeps you in the loop on big momentum shifts without needing to watch the chart all day—perfect for when you’re busy.
5. Flexibility and Efficiency
You can turn timeframes on or off, adjust settings like speed of the moving averages, and tweak transparency to fit your trading style—whether you’re a fast scalper or a patient swing trader. Everything is shown on one chart, saving you effort, and the colors make it simple to read, even if you’re new to trading.
How to Use It
Getting Started
Add the Indicator: Load the "Multi-Timeframe MACD with Color Mix (Nikko)" onto your TradingView chart using the Pine Script editor or indicator library.
Pick Your Timeframes: Turn on the timeframes that match your trading—use 15m and 1h for quick trades, or 1d and 1w for longer holds—using the enable_15m, enable_1h, enable_1d, enable_1w, and enable_background options.
Reading the Colors
Background Gradient: Watch for red to signal bearish 15m momentum and green for bullish momentum. Adjust the Background_transparency (default 75%, or 25% opacity) if the chart feels too busy—try lowering it to 50 for clearer candlesticks in fast markets.
Histogram and EMA Colors:
The histogram and its Exponential Moving Average (EMA) line show a mix of red (1-week), green (1-day), and blue (1-hour) based on how strong the momentum is in each timeframe.
Brighter colors mean stronger momentum—white (all bright) shows all timeframes are pushing up hard, while darker shades (like gray or black) mean weaker or mixed momentum.
Turn off a timeframe (e.g., enable_1h = false) to see how it changes the color mix and focus on what matters to you.
Setting Alerts
Set Your Levels: Choose a threshold_low (default 10%) and threshold_high (default 90%) based on your comfort zone or past market patterns to catch big turns.
Get Notifications: Use TradingView alerts to get pings when the market hits your set levels, so you can act without staring at the screen.
Practical Tips
Pair with Other Tools: Use it with support/resistance lines or the RSI to double-check your moves and build a solid plan.
Tweak Settings: Adjust fast_length, slow_length, and signal_smoothing to match your asset’s speed, and bump up the lookback (default 50) for steadier trends in wild markets.
Practice First: Test different timeframe combos on a demo account to find what works best for you.
Understanding the Colors (Simple Explanation)
How Colors Work
The histogram and its EMA line use a color mix based on a simple idea from color theory, like mixing paints with red, green, and blue (RGB):
Red comes from the 1-week timeframe, green from 1-day, and blue from 1-hour.
When all three timeframes show strong upward momentum, they blend into bright white—the brightest color, like a super-bright light telling you the market’s roaring up.
If some timeframes are weak or pulling down, the mix gets darker (like gray or black), warning you the momentum might not be solid.
Brighter is Better
Bright Colors = Strong Opportunity: The brighter the histogram and EMA (closer to white), the more all your chosen timeframes are in agreement that prices are rising. This is your signal to think about buying or holding, as it points to a powerful trend you can ride.
Dark Colors = Caution: A darker mix (toward black) means some timeframes are lagging or bearish, suggesting you might wait or consider selling. It’s like a dim light saying, “Hold on, check again.”
Benefit in Practice: Watching the brightness helps you jump on the best trades fast. For example, a bright white histogram on a green background is like a green traffic light—go for it! A dark gray on red is like a red light—pause and rethink. This quick color check can save you from bad moves and boost your profits when the trend is strong.
Why It Helps
These colors are your fast friend in trading. A bright histogram means all your timeframes are cheering for an uptrend, giving you the confidence to act. A dull one tells you to be careful, helping you avoid traps. It’s like having a color-coded guide to pick the hottest market moments!
Technical Details
Input Parameters
Fast Length (default: 12): Short-term moving average speed.
Slow Length (default: 26): Long-term moving average speed.
Source (default: close): Price data used.
Signal Smoothing (default: 9): Smooths the signal line.
MA Type (default: EMA): Choose EMA or SMA.
Timeframe and Scaling
Timeframes: 15m, 1h, 1d, 1w, with on/off switches.
Lookback Period (default: 50): Sets the data window for trends.
Background Transparency (default: 75%): Controls background see-through level.
MACD Calculation
Per Timeframe: Uses request.security():
MACD Line: ta.ema(src, fast_length) - ta.ema(src, slow_length).
Signal Line: ta.ema(MACD, signal_length).
Histogram: (macd - signal) / 3.0.
Background Gradient
15m Normalization: norm_value = (hist_15m - hist_15m_min) / max(hist_15m_range, 1e-10), limited to 0-1.
RGB Mix: Red drops from 255 to 0, green rises from 0 to 255, blue stays 0.
Apply: color.new(color.rgb(r_val, g_val, b_val), Background_transparency).
Histogram and EMA Colors
Color Assignment:
1h: Blue (#0000FF) if hist_1h >= 0, else black.
1d: Green (#00FF00) if hist_1d >= 0, else black.
1w: Red (#FF0000) if hist_1w >= 0, else black.
Final Color: final_color = color.rgb(min(r, 255), min(g, 255), min(b, 255)).
Plotting: Histogram and EMA use final_color; MACD (#2962FF), signal (#FF6D00).
Alerts
Bullish Percentage: bullish_pct = (bullish_count / bullish_total) * 100, counting hist >= 0.
Triggers: Below threshold_low or above threshold_high.
--------------------------------------------------------------------
Conclusion
The "Multi-Timeframe MACD with Color Mix (Nikko)" is your all-in-one tool to spot trends, confirm moves, and trade smarter with its bright, easy-to-read colors. By using it wisely, you can sharpen your market edge and trade with more confidence.
This README is tailored for traders and reflects the indicator's practical value as of 05:06 AM +07 on October 04, 2025.

Volume-Weighted RSI & Multi-Normalized MACD### Description for Publishing: Volume-Weighted RSI & Multi-Normalized MACD
**Overview**
The "Volume-Weighted RSI & Multi-Normalized MACD" indicator is a powerful and versatile tool designed for traders seeking enhanced momentum and trend analysis. Combining a volume-weighted Relative Strength Index (VW-RSI) with a customizable Moving Average Convergence Divergence (MACD) featuring multiple normalization methods, this indicator provides deep insights into market dynamics. It supports multi-timeframe (MTF) analysis and includes an optional stepped plotting mode for discrete signal visualization, making it ideal for both trend-following and mean-reversion strategies across various markets (stocks, forex, crypto, etc.).
**Key Features**
1. **Volume-Weighted RSI (VW-RSI)**:
- A modified RSI that incorporates trading volume for greater sensitivity to market activity.
- Normalized to a user-defined range (default: -50 to +50) for consistent analysis.
- Optional smoothing with multiple moving average types (SMA, EMA, WMA, VWMA, SMMA, or SMA with Bollinger Bands) to reduce noise and highlight trends.
- Overbought (+20) and oversold (-20) levels for quick reference.
2. **Multi-Normalized MACD**:
- Offers six normalization methods for MACD, allowing traders to tailor the output to their strategy:
- Normalized Volume Weighted MACD (unbounded).
- Min-Max Normalization (bounded).
- Volatility Normalization (unbounded, volatility-adjusted).
- Volatility Normalization with Min-Max (bounded).
- Hyperbolic Tangent Normalization (bounded).
- Arctangent Normalization (bounded).
- Min-Max with Smoothing (bounded).
- All bounded methods scale to the user-defined range (default: -50 to +50), ensuring comparability with VW-RSI.
- Dynamic color changes for MACD line (lime/red) and histogram (aqua/blue/red/maroon) based on momentum and signal line crosses.
3. **Stepped Plotting Mode**:
- Optional mode to plot RSI and MACD as discrete, stepped lines, reducing noise by only updating when values change significantly (configurable thresholds).
- Ideal for traders focusing on clear, actionable signal changes.
4. **Multi-Timeframe Support**:
- Configurable timeframe input (default: chart timeframe) for analyzing RSI and MACD on higher or lower timeframes, enhancing cross-timeframe strategies.
5. **Customizable Display**:
- Toggle options to show/hide MACD line, signal line, histogram, and cross dots.
- Bollinger Bands for RSI smoothing (optional) with adjustable standard deviation multiplier.
- Clear visual cues with horizontal lines for overbought/oversold levels, midline, and MACD bounds.
**Usage Instructions**
1. **Add to Chart**: Apply the indicator to any symbol (e.g., BTCUSD, SPY) on any timeframe (1H, 1D, etc.).
2. **Configure Settings**:
- **General**: Adjust `Lower Bound` (-50 default) and `Upper Bound` (+50 default) for the output range. Set `Timeframe` for MTF analysis. Enable `Stepped?` for discrete plotting.
- **RSI**: Choose `Price Source` (default: ohlc4), `RSI Length` (default: 9), and smoothing options (e.g., EMA, Bollinger Bands). Adjust `RSI Diff Threshold` for stepped mode.
- **MACD**: Select `Price Source`, `Fast Length` (9), `Slow Length` (21), `Signal Length` (9), and a normalization method (default: Volatility Min-Max). Adjust `MACD Diff Threshold` for stepped mode.
- **Display Options**: Toggle MACD components and histogram colors for clarity.
3. **Interpretation**:
- **VW-RSI**: Watch for crosses above +20 (overbought) or below -20 (oversold) for potential reversals. Use smoothed RSI or Bollinger Bands for trend confirmation.
- **MACD**: Look for MACD/Signal line crosses (dots indicate crossings) and histogram changes for momentum shifts. Bounded normalizations align with RSI for unified analysis.
- **Stepped Mode**: Focus on significant changes in RSI/MACD for clearer signals.
4. **Companion Overlay**: For visualization on the main price chart, use the companion script "VW-RSI & MACD Price Overlay" (available separately, requires this script to be published). It plots RSI and MACD as price-scaled echo lines, with toggles to show/hide and customizable scaling (high/low or ATR).
**Who Is This For?**
- **Trend Traders**: Use MACD normalizations and MTF to identify momentum shifts across timeframes.
- **Mean-Reversion Traders**: Leverage VW-RSI’s overbought/oversold signals for entry/exit points.
- **Technical Analysts**: Customize normalization and smoothing to match specific market conditions.
- **All Markets**: Works on stocks, forex, cryptocurrencies, and more, with any timeframe.
**Notes**
- Unbounded MACD normalizations (`enable_nvw`, `enable_vol`) may produce values outside -50/+50, suitable for volatility-focused strategies.
- For price chart overlay, publish this script and use its ID in the companion script’s `request.security` call.
- Adjust scaling inputs in the companion script for optimal visualization on volatile or stable assets.
**Author’s Note**
Developed by NEPOLIX, this indicator combines volume-weighted precision with flexible normalization for robust technical analysis. Feedback and suggestions are welcome to enhance future versions!

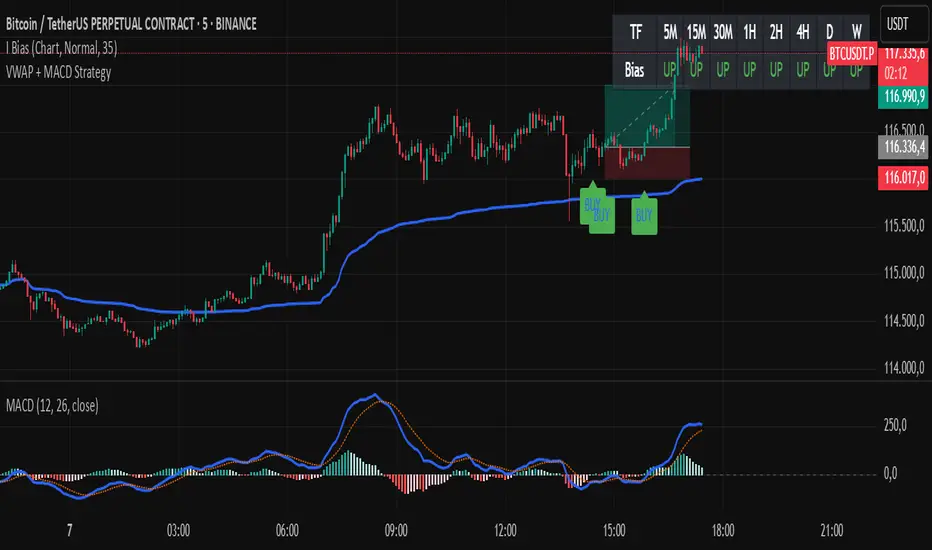
VWAP + MACD Estrategia MilloVWAP + MACD Strategy
This indicator combines the VWAP (Volume Weighted Average Price) with MACD (Moving Average Convergence Divergence) to create buy and sell signals. It helps traders identify potential market entry and exit points based on price action and momentum.
Conditions for Buy:
The price must be above the VWAP.
The MACD line crosses above the signal line (bullish crossover).
The MACD line is below the zero line.
Conditions for Sell:
The price must be below the VWAP.
The MACD line crosses below the signal line (bearish crossover).
The MACD line is above the zero line.
Features:
The VWAP line is plotted to represent the average price, weighted by volume, over a specified period.
Buy signals appear when all conditions are met for an upward price movement.
Sell signals appear when all conditions are met for a downward price movement.
MACD and Signal Line: The MACD helps to confirm momentum, while the signal line indicates possible trend reversals.
Customizable: You can modify the VWAP and MACD parameters to suit different trading strategies.
This strategy is designed for intraday traders and scalpers, aiming to catch quick movements while being aware of market momentum.
Feel free to share this description along with the code! Let me know if you need any adjustments or further explanations.