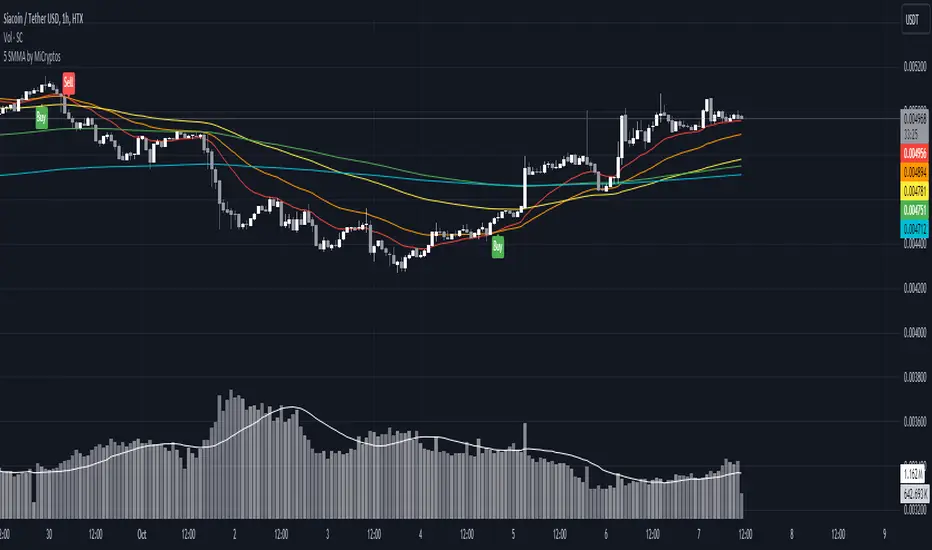
5 SMMA - by MiCryptoGives you the 5 most common SMMA for crypto in day trading:
- 10
- 21
- 50
- 100
- 200
This can be configured as you want.
Hope this can help you to get more indicators in a free plan.
在腳本中搜尋"科创50和科创100区别"
Mean AnglesThis indicator plots the trend of the angles made by the chosen means. This trend when analysed over multiple timeframes as well as different lengths can give an indication of the trend in short medium and long term.
For example, in any particular timeframe, when the 20 EMA turns a negative arctan, it signifies that on a shorter timeframe (than the current timeframe) is turning downwards in price. When 50, 100 and 200 EMA turn negative, it confirms the trend reversal. Similarly the 20 EMA will be the first one to turn "Up" or positive to indicate a possible trend reversal on the upside.
The angle of the means will oscillate between +pi/2 and -pi/2.
0 means - EMA is flat
+pi/2 means - almost vertical price rise
-pi/2 means - almost vertical price fall
Between -pi/2 and 0 means EMA is sloped downwards. Moving from -pi/2 to 0 means EMA slope is turning up. Moving from 0 to -pi/2 means EMA slope is falling down even lower and faster.
Between 0 and +pi/2 means EMA is slopped upwards. Moving from +pi/2 to 0 means EMA slope is falling down. Moving from 0 to +pi/2 means EMA slope is turning up even higher and faster.

Market breadth Percentage of stocks above MA of various indexesPercentage of stock above moving average is a common market breadth indicator. This script can show multiple lines of percentage of stock above different moving average (5,20,50,100,150,200) of different US indexes.


MTF Technical Ratings [Anan]█ OVERVIEW
This indicator is a modified version of "Technical Ratings" v5.0 available in the public library to provide a quick overview of Technical Ratings in 6 optional timeframes.
█ FEATURES
- Multi-timeframe Table.
- Display Technical Ratings for "MAs" with a percentage.
- Display Technical Ratings for "Oscillators" with a percentage.
- Display Technical Ratings for "All" with a percentage.
- Full control of displaying any row(MAs / Oscillators / All) or any column(Multi-timeframe)
- Full control of Table position and size.
- Full control of displaying any row or column.
ORIGINAL DESCRIPTION ABOUT TECHNICAL RATING v1.0
█ OVERVIEW
This indicator calculates TradingView's well-known "Strong Buy", "Buy", "Neutral", "Sell" or "Strong Sell" states using the aggregate biases of 26 different technical indicators.
█ CALCULATIONS
The indicator calculates the aggregate value of two groups of indicators: moving averages and oscillators.
The "MAs" group is comprised of 15 different components:
• Six Simple Moving Averages of periods 10, 20, 30, 50, 100 and 200
• Six Exponential Moving Averages of the same periods
• A Hull Moving Average of period 9
• A Volume-weighed Moving Average of period 20
• Ichimoku
The "Oscillators" group includes 11 components:
• RSI
• Stochastic
• CCI
• ADX
• Awesome Oscillator
• Momentum
• MACD
• Stochastic RSI
• Wiliams %R
• Bull Bear Power
• Ultimate Oscillator
The state of each group's components is evaluated to a +1/0/-1 value corresponding to its bull/neutral/bear bias. The resulting value for each of the two groups are then averaged to produce the overall value for the indicator, which oscillates between +1 and -1. The complete conditions used in the calculations are documented in the Help Center.


F-IVery nice indicator that is giving us a more sensitive and faster then other (like ema,sma etc)
using the Z function ( i modify it from script of MichelT about Hull function )
as we see it act as much more faster then regular indicators
here in this script i put different length (10,50,100,150,200)
red is bearish
green is bullish
all credit is to MichelT the originator of this function which i just modify it a little

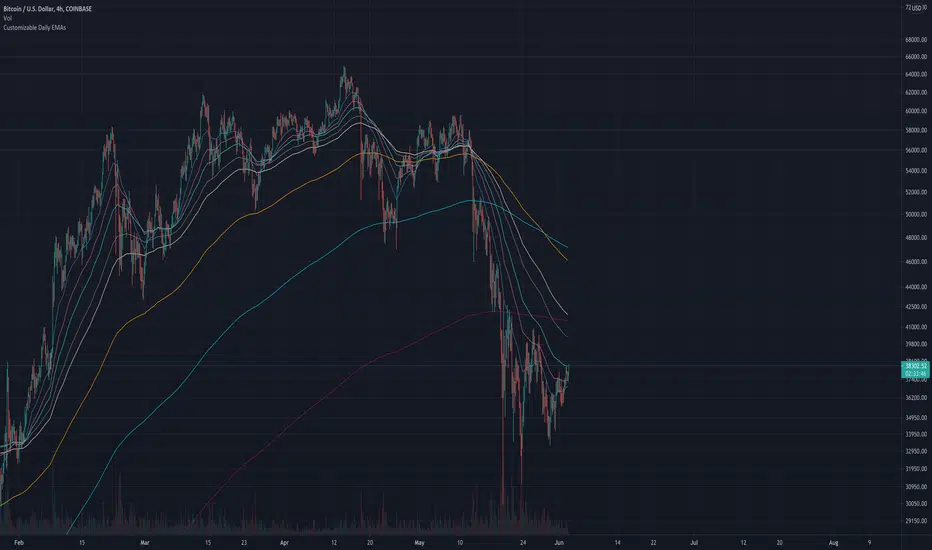
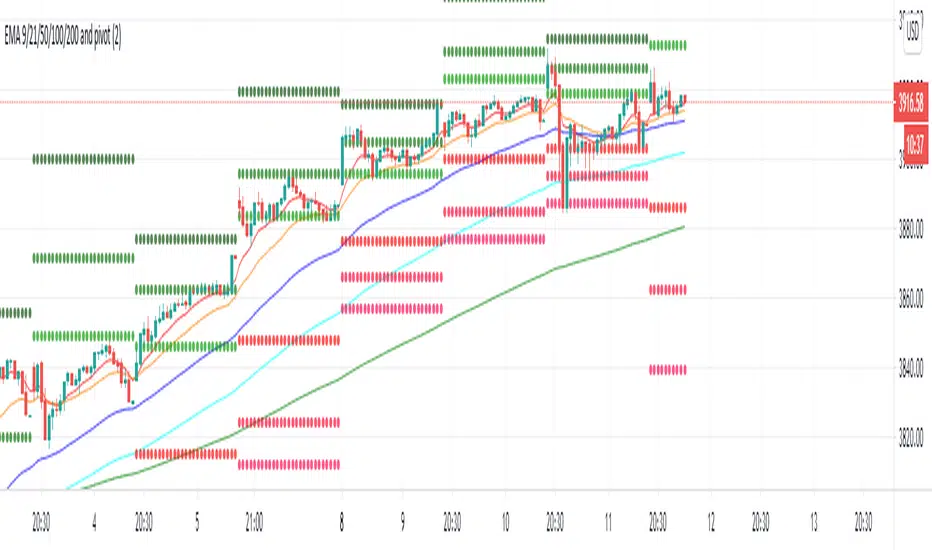
Customizable Daily EMAs (up to 8)This indicator provides you with up to 8 different EMAs that are customizable.
You can specify how many EMAs you want on the chart (up to a maximum of 8), as well as the length and color of each EMA. In addition, the resolution of all EMAs can also be customized - by default all EMAs follow the Daily timeframe but you could set this to any timeframe you want or you could choose for it to follow the timeframe chart as most other EMA Indicators do.
The reason for creating this indicator is because I was looking for Daily EMAs, but wanted to view the chart in a different time period without the EMA lines themselves changing. In addition, I wanted to view ample EMAs at once, and have the ability to change their length as I see fit.
You can see this demonstrated on the 4-hour chart above. Despite the chart being a 4 hourly chart, the EMAs are Daily EMAs.
In the example above all 8 EMAs have been activated, but you could turn any of these off to suit your own preferences.
The default EMAs are set to the following: 20, 50, 100, 200, 5, 9, 13, 26.
The First 4 are ideal for longer-term targets, while the smaller timeframes are more suited to short-term trading targets.
I have made this script Open-source for anybody to view, copy and modify if they need.
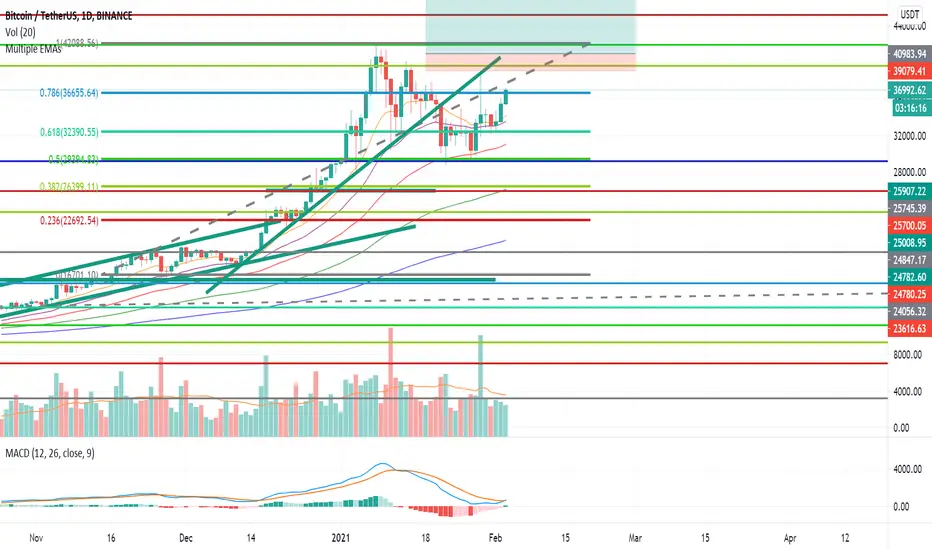
Bitcoin Daily Support/ResistanceA new indicator for tradingview.
Indicator Overview
The 2-Year MA Multiplier is intended to be used as a long term investment tool.
It highlights periods where buying or selling Bitcoin during those times would have produced outsized returns.
To do this, it uses a moving average (MA) line, the 2yr MA, and also a multiplication of that moving average line, 2yr MA x5.
Note: the x5 multiplication is of the price values of the 2yr moving average, not of its time period.
Buying Bitcoin when price drops below the 2yr MA (green line) has historically generated outsized returns. Selling Bitcoin when price goes above the 2yr MA x 5 (red line) has been historically effective for taking profit.
Why This Happens
As Bitcoin is adopted, it moves through market cycles. These are created by periods where market participants are over-excited causing the price to over-extend, and periods where they are overly pessimistic where the price over-contracts. Identifying and understanding these periods can be beneficial to the long term investor.
This tool is a simple and effective way to highlight those periods
MA 50/100/150 was historically good support and resistance. When we cross them we have a new trend that is established.

Daily SMAs (10,50,100,200) by NVenti- Daily simple moving averages
- Data table displaying distance from simple moving averages
Shaded Tripple MAsThree moving averages that have shaded area between its sma and ema versions. Default lengths are 50, 100 and 200.


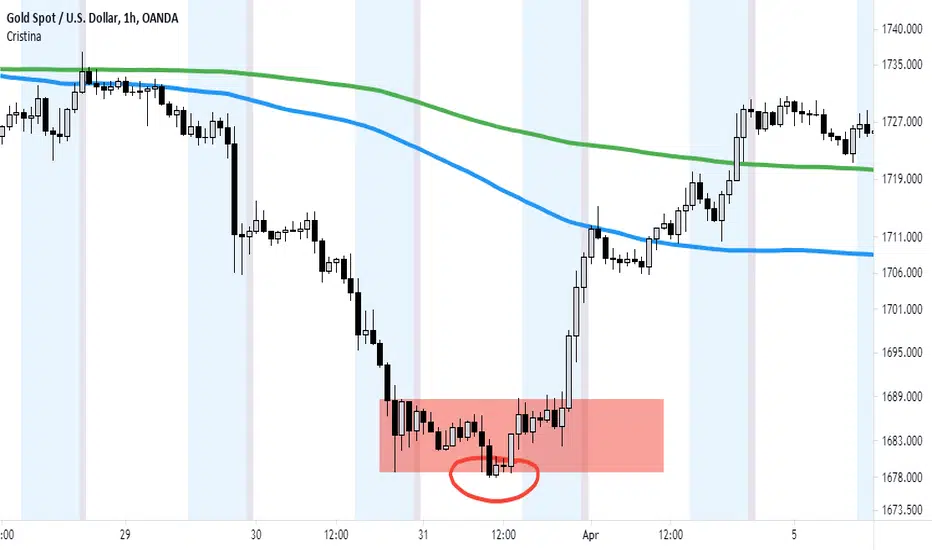
Cristina - Trading Sessions and Moving AveragesCombination of Trading Sessions and Moving Averages. You can easily edit the time frame background to give you a visual presentation of your most active trading hours or customize it to represent the different forex trading session inline with your local time.
The default moving average here is the 20, 50, 100, 200 and 250 MA. The use of moving averages could be in a (1) form of cross over to find out the dominant trend, (2) use it to find value zone or (3) use it to find dynamic support levels. It greatly depends on your trading system.
With the combination of the trading sessions and the moving averages, you could isolate the trades you will be taking inline with your active hours. Thus this is a great tool to add in terms of day trading or swing trading with the lower time frames.
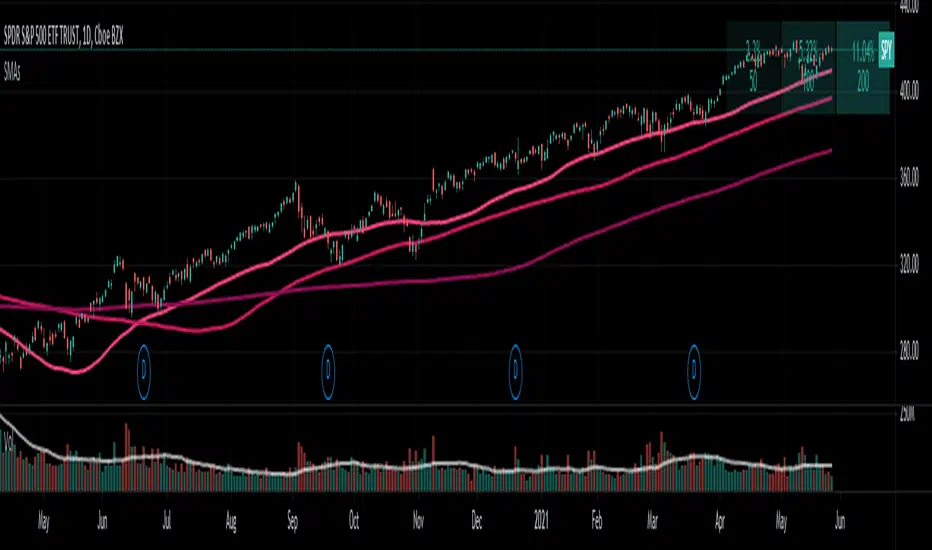
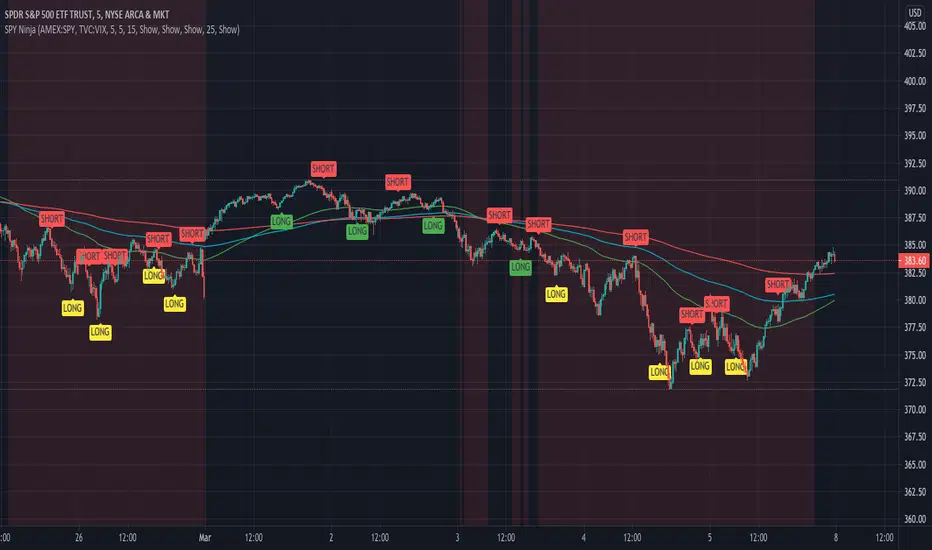
SPY Ninja
SPY Ninja correlates the true strength index exponential moving averages of SPY and VIX together. In doing so we can determine the start of trend shifts via SPY / VIX convergence in addition to crossover, with potential market entries and exits represented by the LONG and SELL signals.
SMMA 50,100, and 200 have been added to chart due to the historic SPY market reactivity to these moving averages. They often act as natural support and resistance levels with SPY, and when coinciding LONG and SHORT signals appear touching any of these levels, it adds an extra layer of confidence for traders' decisions. Also, by highlighting the areas on our SPY chart (red background areas) that represent a VIX threshold higher than 25, we can bring attention to areas with potentially higher volatility immediately so that traders know to proceed with caution.
SPY Ninja works harmoniously with the SPY Ninja Oscillator; Ninja provides the signals highlighting risky VIX areas of concern, while the Ninja Oscillator adds an additional 3 levels of potential confirmation for your trade decisions.


EMA 3/5/10/20/50/100/200Trend follow the fastest moving stocks with the right EMAs to trail your stops.


MA ICHI BB [Rogulabo]3 indicators in 1.
Included Indicators are:
- MA 5,25,50,100,200
- Ichimoku
- Bollinger Band
These can be used to determine changes in trends when:
- MA's collide, trajectories shift, or certain levels are reached.
- Ichimoku cloud is above or below the candles.
- Bollinger Band's width changes, or range is broken.
Reasons for 3 in 1 assembly:
This indicator is intended to be used by students, and followers of Dan Takahashi
(a prominent educator of investing in Japan who is also a user of TradingView) .
Those who wants to use and learn with the same setup as Dan, would greatly benefit from this since,
the complex setting up process which can be a pain for beginners can be skipped with a simple click.
Every stylistic choice of color and placement were made to make it similar to the chart used by Dan.
Simple customizations are available such as:
- Changing color
- Changing the values
- Hide/show controls
Notes:
This is intended to be used alongside “CC RSI” for the complete the setup.
Any questions, please refer to:
@rogulabo
==
高橋ダンさんが使用されてるチャートと同様のセットアップの為にご活用ください。
複数のインジケータをグループにしておりますので、無料版を使われてる方は効率よく使っていただけると思います。
また、“CC RSI ”どいうタイトルのインジケータも同時に公開しておりますので、セットアップを完成させたい方はこちらもご活用ください。
以下のインジケータを含みます。
・MA線
・一目均等表
・ボリンジャーバンド
カスタマイズされたい方はご自由に値を変更ください。
ご質問は @rogulabo までよろしくお願いいたします。
