Trendilo ARTrendilo AR is a custom trading indicator designed to identify market trends using advanced techniques such as the Arnaud Legoux Moving Average (ALMA), volume confirmations, and dynamic volatility bands. This indicator provides a clear visualization of trends, including significant changes and custom alerts.
Review of Indicators Used
1. ALMA
Description:
ALMA is a moving average that applies an advanced filter to smooth price data, reducing noise and focusing on actual trends.
Usage in the Indicator:
Used to calculate the smoothed percentage price change and determine trend direction. Customizable parameters include:
- Length: Defines the number of bars to consider.
- Offset: Adjusts sensitivity toward recent prices.
- Sigma: Controls the degree of smoothing.
Advantages:
- Reduced lag in trend detection.
- Resistance to market noise.
2. ATR
Description:
ATR measures the market’s average volatility by considering the range between high and low prices over a given period.
Usage in the Indicator:
ATR is used to calculate "dynamic smoothing", adjusting the indicator’s sensitivity based on current market volatility.
Advantages:
- Adapts to high or low volatility conditions.
- Helps define dynamic support and resistance levels.
3. SMA
Description:
SMA calculates the average of prices or volume over a specific time period.
Usage in the Indicator:
Used to calculate the volume moving average (Volume SMA) to confirm whether the current volume supports the detected trend.
Advantages:
- Easy to understand and calculate.
- Provides volume-based trend confirmation.
4. RMS Bands
Description:
RMS Bands calculate the standard deviation of percentage price changes, creating upper and lower levels that act as overbought and oversold indicators.
Usage in the Indicator:
- Define the range within which the market is considered neutral.
- Crosses above or below the bands indicate trend changes.
Advantages:
- Visual identification of strong trends.
- Helps filter false signals.
Colors and Visuals Used in the Indicator
1. ALMA Line
Colors:
- Green: Indicates a confirmed uptrend (with sufficient volume).
- Red: Indicates a confirmed downtrend (with sufficient volume).
- Gray: Indicates a neutral phase or insufficient volume to confirm a trend.
2. RMS Bands
- Upper and Lower Lines:
- Purple (with transparency): These lines represent the RMS bands (upper and lower) and
adjust opacity based on trend strength.
- Stronger trends result in less transparency (more solid colors).
3. Highlighted Background (Strong Trends)
- Color:
- Light Green (transparent): Highlights a strong trend when the smoothed percentage change (ALMA) exceeds 1.5 times the RMS.
4. Horizontal Lines
- Baseline (0):
- Dark Gray: Serves as a central reference to identify the directionality of percentage changes.
- Additional Line (0.1):
- Blue: A customizable line to mark user-defined key levels.
5. Bar Colors
- Bar Colors:
- Green: When the price is in a confirmed uptrend.
- Red: When the price is in a confirmed downtrend.
- No color: When there is insufficient volume or no clear trend.
How to Use the Indicator
1. Initial Setup
1. Add the Indicator to Your Chart: Copy the code into the Pine Editor on TradingView and apply it to your chart.
2. Customize Parameters: Adjust values based on your trading strategy:
- Smoothing: Controls the level of smoothing for percentage changes.
- Lookback Length: Defines the observation period for calculations.
- Band Multiplier: Adjusts the width of RMS bands.
2. Signal Interpretation
1. Indicator Colors:
- Green: Confirmed uptrend.
- Red: Confirmed downtrend.
- Gray: No clear trend or insufficient volume.
2. RMS Bands:
- If the ALMA line (smoothed percentage change) crosses above the upper RMS band, it signals a potential uptrend.
- If it crosses below the lower RMS band, it signals a potential downtrend.
3. Volume Confirmation:
- The indicator's color activates only if the current volume exceeds the Volume SMA.
3. Alerts and Decisions
1. Trend Change Alerts:
- The indicator automatically triggers alerts when an uptrend or downtrend is detected.
- Configure these alerts to receive real-time notifications.
2. Strong Trend Signals:
- When the magnitude of the percentage change exceeds 1.5 times the RMS, the chart background highlights the strong trend.
4. Trading Strategies
1. Buy:
- Enter long positions when:
- The indicator turns green.
- Volume confirms the trend.
- Consider placing a stop-loss just below the lower RMS band.
2. Sell:
- Enter short positions when:
- The indicator turns red.
- Volume confirms the trend.
- Consider placing a stop-loss just above the upper RMS band.
3. Neutral:
- Avoid trading when the indicator is gray, as no clear trend or insufficient volume is present.
Disclaimer: As this is my first published indicator, please use it with caution. Feedback is highly appreciated to improve its performance.
Happy Trading!
Sellsignal

mr.crypto731Description:
📊 Enhanced MACD with Strong Buy/Sell Signals 🚀
This script is designed to enhance the standard MACD indicator by adding clear, strong buy and sell signals. It includes:
MACD Line: A fast-moving average that reacts quickly to price changes.
Signal Line: A slower-moving average that smooths out price fluctuations.
MACD Histogram: The difference between the MACD Line and Signal Line, helping to identify trend strength and direction.
Key Features:
Strong Buy/Sell Signals: Uses crossovers of the MACD Line and Signal Line to generate strong buy/sell signals.
Color-Coded Background: Provides visual cues with background colors to highlight strong signals.
User-Friendly Interface: Customizable settings for MACD Fast Length, Slow Length, and Signal Smoothing.

Trend Trader-Remastered StrategyOfficial Strategy for Trend Trader - Remastered
Indicator: Trend Trader-Remastered (TTR)
Overview:
The Trend Trader-Remastered is a refined and highly sophisticated implementation of the Parabolic SAR designed to create strategic buy and sell entry signals, alongside precision take profit and re-entry signals based on marked Bill Williams (BW) fractals. Built with a deep emphasis on clarity and accuracy, this indicator ensures that only relevant and meaningful signals are generated, eliminating any unnecessary entries or exits.
Please check the indicator details and updates via the link above.
Important Disclosure:
My primary objective is to provide realistic strategies and a code base for the TradingView Community. Therefore, the default settings of the strategy version of the indicator have been set to reflect realistic world trading scenarios and best practices.
Key Features:
Strategy execution date&time range.
Take Profit Reduction Rate: The percentage of progressive reduction on active position size for take profit signals.
Example:
TP Reduce: 10%
Entry Position Size: 100
TP1: 100 - 10 = 90
TP2: 90 - 9 = 81
Re-Entry When Rate: The percentage of position size on initial entry of the signal to determine re-entry.
Example:
RE When: 50%
Entry Position Size: 100
Re-Entry Condition: Active Position Size < 50
Re-Entry Fill Rate: The percentage of position size on initial entry of the signal to be completed.
Example:
RE Fill: 75%
Entry Position Size: 100
Active Position Size: 50
Re-Entry Order Size: 25
Final Active Position Size:75
Important: Even RE When condition is met, the active position size required to drop below RE Fill rate to trigger re-entry order.
Key Points:
'Process Orders on Close' is enabled as Take Profit and Re-Entry signals must be executed on candle close.
'Calculate on Every Tick' is enabled as entry signals are required to be executed within candle time.
'Initial Capital' has been set to 10,000 USD.
'Default Quantity Type' has been set to 'Percent of Equity'.
'Default Quantity' has been set to 10% as the best practice of investing 10% of the assets.
'Currency' has been set to USD.
'Commission Type' has been set to 'Commission Percent'
'Commission Value' has been set to 0.05% to reflect the most realistic results with a common taker fee value.

IPO Lifecycle Sell Strategy [JARUTIR]IPO Lifecycle Sell Strategy with Dynamic Buy Date and Multiple Sell Rules
This custom TradingView script is designed for traders looking to capitalize on dynamic strategies for IPOs and growth stocks, by implementing several sell rules based on price action and technical indicators. It provides a set of sell rules that are applied dynamically depending on the stock's lifecycle and price action, allowing users to lock in profits and minimize drawdowns based on key technical thresholds.
The four sell strategies incorporated into this script are inspired by the book "The Lifecycle Trade", a resource that focuses on capturing profits while managing risk in different phases of a stock's lifecycle, from IPO to high-growth stages.
Key Features:
Buy Price and Buy Date: You can either manually input your buy price and date or let the script automatically detect the buy date based on the specified buy price.
Multiple Sell Strategies: Choose from 4 predefined sell strategies:
Ascender Rule : Captures strong momentum from IPO stocks by selling portions at specific price levels or technical conditions.
Midterm Rule : Focuses on holding for longer periods, with defensive sell signals triggered when the stock deviates significantly from peak price or key moving averages.
40 Week Rule : Designed for long-term holds, this rule triggers a sell when the stock closes below the 40-week moving average.
Everest Rule : Aggressive strategy for selling into strength based on parabolic moves or gap downs, ideal for high momentum stocks.
Interactive Features:
Horizontal Green Line showing the buy price level from the buy date.
Visual Sell Signals appear only after the buy date to ensure that your analysis is relevant to the stock lifecycle.
Customizable settings, allowing you to choose your preferred sell rule strategy and automate buy date detection.
This script is perfect for traders using a strategic, systematic approach to IPOs and high-growth stocks, whether you're looking for quick exits during momentum phases or holding for longer-term growth.
Usage:
Input your Buy Price and Buy Date, or allow the script to automate the buy date detection.
Select a Sell Rule strategy based on your risk profile and trading style.
View visual signals for selling when specific conditions are met.
Frequently Asked Questions (FAQs):
Q1: How do I input my Buy Price and Buy Date?
The script allows you to either manually input the Buy Price and Buy Date or use the automated detection. If you choose automated detection, the script will automatically assign the buy date when the price crosses above your set Buy Price.
Q2: What is the purpose of the "Sell Rules"?
The script offers four sell strategies to help manage different types of stocks in varying phases of their lifecycle:
Ascender Rule: Targets IPO stocks showing positive momentum.
Midterm Rule: A defensive strategy for stocks in a steady uptrend.
40 Week Rule: Long-term hold strategy designed to ride stocks through extended growth.
Everest Rule: Aggressive strategy to capture profits during parabolic price moves.
Q3: What is the significance of the Green Line at Buy Price?
The Green Line represents your entry point (Buy Price) on the chart. It will appear from the buy date onwards, helping you track the performance of your stock relative to your entry.
Q4: Can I customize the Sell Strategy?
Yes! You can choose from the available Sell Rules (Ascender Rule, Midterm Rule, 40 Week Rule, Everest Rule) via an input option in the script. Each strategy has its own unique triggers based on price action, moving averages, and time-based conditions.
Q5: Does this script work for stocks and crypto?
Yes, this script is designed for both stocks and cryptocurrencies. It works on any asset where price data and timeframes are available.
Q6: How do the Weekly Moving Averages (WSMA) work in this strategy?
The script uses weekly moving averages (WSMA) to track longer-term trends. These are essential for some of the sell rules, such as the Midterm Rule and 40 Week Rule, which rely on the stock's movement relative to the 40-week moving average.
Q7: Will the script plot a Sell Signal immediately after the Buy Date?
No, sell signals will only be plotted after the Buy Date. This ensures that the sell strategy is relevant to your actual holding period and avoids premature triggers.
Q8: How do I interpret the Sell Signal?
The script will plot a Red Sell Signal above the bar when the sell conditions are met, based on the selected strategy. This indicates that it may be a good time to exit the position according to your chosen rule.
Q9: Can I use this strategy on different timeframes?
Yes, you can apply the script to any timeframe. However, some sell strategies, like the Midterm Rule and 40 Week Rule, are designed to work best with weekly data, so it's recommended to use these strategies with longer timeframes.
Q10: Does this script have any alerts?
Yes! The script supports alert conditions that will notify you when the sell conditions are met according to your selected rule. You can set up alerts to stay informed without needing to watch the chart constantly.
Q11: What if I want to disable some of the sell rules?
You can select your preferred sell rule using the "Select Sell Rule" dropdown. If you don’t want to use a particular rule, simply choose a different strategy or leave it inactive.
------------------------------
Disclaimer:
This strategy is intended for educational purposes only. It should not be considered financial advice. Always perform your own research and consult with a professional before making any trading decisions. Trading involves significant risk, and you should never trade with money you cannot afford to lose.

ATR% Multiple from Key Moving AverageThis script gives signal when the ATR% multiple from any chosen moving average is beyond the configurable threshold value. This indicator quantifies how extended the stock is from a given key moving average.
A lot of traders use ATR% multiple from 10DMA, 21EMA, 50SMA or 200SMA to determine how extended a stock is and accordingly sell partials or exit. By default the indicator takes 50SMA and when the ATR% multiple is greater than 7 then it gives the signal to take partials. You can back test this indicator with previous trades and determine the ideal threshold for the signal. For small and midcaps a threshold of 7 to 10 ATR% multiples from 50SMA is where partials can be taken while large caps can revert to mean even earlier at 3 to 5 ATR% multiples from 50SMA.
You can modify this script and use it anyway you please as long as you make it opensource on TradingView.

Multifactor Buy/Sell Strategy V2 | RSI, MACD, ATR, EMA, Boll.BITGET:1INCHUSDT
This Pine Script code for TradingView is a multifactor Buy/Sell indicator that combines several technical factors to generate trading signals based on trend, volatility, and volume conditions. Here’s a breakdown of the main components and functionality:
Indicator Name
- Multifactor Buy/Sell Strategy V2 — an overlay indicator applied directly on the price chart.
### Input Parameters
The script includes multiple customizable parameters:
- RSI, EMA, MACD parameters — for setting periods and signals of MACD and RSI.
- ATR and Bollinger Bands — used for volatility analysis and level determination.
- Minimum Volatility Threshold — sets a minimum Bollinger Band width threshold for determining high volatility.
Core Indicators
1. RSI — calculated to identify oversold (below 30) and overbought (above 70) conditions.
2. EMA and MACD — calculates exponential moving averages and MACD histogram to determine trend direction.
3. ATR and Bollinger Bands — used to assess current volatility and establish dynamic upper and lower bands.
Volatility and Volume Analysis
- Determines the current ATR level and Bollinger Band width to evaluate high volatility.
- Calculates the volume moving average to track periods of increased volume during high volatility.
Trend Analysis
The script uses the difference between fast and slow EMAs to define strong trends:
- Uptrend — when the fast EMA is above the slow EMA, the price is above the fast EMA, and the trend is strong.
- Downtrend — when the fast EMA is below the slow EMA, the price is below the fast EMA, and the trend is strong.
Momentum Filter
- Based on the price change over the last three bars and compared against the minimum volatility threshold to identify strong momentum.
Buy and Sell Signal Generation
- Buy Signal: Uptrend with RSI oversold, positive MACD histogram, high volatility and volume, strong momentum, and sufficient Bollinger Band width.
- Sell Signal: Downtrend with RSI overbought, negative MACD histogram, high volatility and volume, strong momentum, and sufficient Bollinger Band width.
Visualization
- Buy and sell signals are displayed as green and red triangles on the chart.
- Plots for fast and slow EMAs, upper and lower bands, and Bollinger Bands.
Alerts
The script includes alert conditions for buy and sell signals, allowing notifications to be sent via email or mobile app.
Information Panel
A small table on the chart displays current volatility dataThis Pine Script code for TradingView is a multifactor Buy/Sell indicator that combines several technical factors to generate trading signals based on trend, volatility, and volume conditions. Here’s a breakdown of the main components and functionality:
Indicator Name
- Multifactor Buy/Sell Strategy V2 — an overlay indicator applied directly on the price chart.
Input Parameters
The script includes multiple customizable parameters:
- **RSI, EMA, MACD parameters** — for setting periods and signals of MACD and RSI.
- **ATR and Bollinger Bands** — used for volatility analysis and level determination.
- **Minimum Volatility Threshold** — sets a minimum Bollinger Band width threshold for determining high volatility.
Core Indicators
1. RSI — calculated to identify oversold (below 30) and overbought (above 70) conditions.
2. EMA and MACD — calculates exponential moving averages and MACD histogram to determine trend direction.
3. ATR and Bollinger Bands — used to assess current volatility and establish dynamic upper and lower bands.
Volatility and Volume Analysis
- Determines the current ATR level and Bollinger Band width to evaluate high volatility.
- Calculates the volume moving average to track periods of increased volume during high volatility.
Trend Analysis
The script uses the difference between fast and slow EMAs to define strong trends:
- Uptrend — when the fast EMA is above the slow EMA, the price is above the fast EMA, and the trend is strong.
- Downtrend — when the fast EMA is below the slow EMA, the price is below the fast EMA, and the trend is strong.
Momentum Filter
- Based on the price change over the last three bars and compared against the minimum volatility threshold to identify strong momentum.
Buy and Sell Signal Generation
- Buy Signal: Uptrend with RSI oversold, positive MACD histogram, high volatility and volume, strong momentum, and sufficient Bollinger Band width.
- Sell Signal: Downtrend with RSI overbought, negative MACD histogram, high volatility and volume, strong momentum, and sufficient Bollinger Band width.
Visualization
- Buy and sell signals are displayed as green and red triangles on the chart.
- Plots for fast and slow EMAs, upper and lower bands, and Bollinger Bands.
Alerts
The script includes alert conditions for buy and sell signals, allowing notifications to be sent via email or mobile app.
Information Panel
A small table on the chart displays current volatility
- Volatility Status — indicates high or low volatility.
- Bollinger Band Width — current width as a percentage.
- ATR Ratio — ratio of current ATR to long-term average ATR.
This script is suitable for trading in high-volatility conditions, combining multiple filters and factors to generate precise buy and sell signals.

Trend Trader-RemasteredThe script was originally coded in 2018 with Pine Script version 3, and it was in invite only status. It has been updated and optimised for Pine Script v5 and made completely open source.
Overview
The Trend Trader-Remastered is a refined and highly sophisticated implementation of the Parabolic SAR designed to create strategic buy and sell entry signals, alongside precision take profit and re-entry signals based on marked Bill Williams (BW) fractals. Built with a deep emphasis on clarity and accuracy, this indicator ensures that only relevant and meaningful signals are generated, eliminating any unnecessary entries or exits.
Key Features
1) Parabolic SAR-Based Entry Signals:
This indicator leverages an advanced implementation of the Parabolic SAR to create clear buy and sell position entry signals.
The Parabolic SAR detects potential trend shifts, helping traders make timely entries in trending markets.
These entries are strategically aligned to maximise trend-following opportunities and minimise whipsaw trades, providing an effective approach for trend traders.
2) Take Profit and Re-Entry Signals with BW Fractals:
The indicator goes beyond simple entry and exit signals by integrating BW Fractal-based take profit and re-entry signals.
Relevant Signal Generation: The indicator maintains strict criteria for signal relevance, ensuring that a re-entry signal is only generated if there has been a preceding take profit signal in the respective position. This prevents any misleading or premature re-entry signals.
Progressive Take Profit Signals: The script generates multiple take profit signals sequentially in alignment with prior take profit levels. For instance, in a buy position initiated at a price of 100, the first take profit might occur at 110. Any subsequent take profit signals will then occur at prices greater than 110, ensuring they are "in favour" of the original position's trajectory and previous take profits.
3) Consistent Trend-Following Structure:
This design allows the Trend Trader-Remastered to continue signaling take profit opportunities as the trend advances. The indicator only generates take profit signals in alignment with previous ones, supporting a systematic and profit-maximising strategy.
This structure helps traders maintain positions effectively, securing incremental profits as the trend progresses.
4) Customisability and Usability:
Adjustable Parameters: Users can configure key settings, including sensitivity to the Parabolic SAR and fractal identification. This allows flexibility to fine-tune the indicator according to different market conditions or trading styles.
User-Friendly Alerts: The indicator provides clear visual signals on the chart, along with optional alerts to notify traders of new buy, sell, take profit, or re-entry opportunities in real-time.

RSI & Volume Impact Analyzer Ver.1.00Description:
The RSI VOL Score indicator combines the Relative Strength Index (RSI) and volume data through a mathematical calculation to assist traders in identifying and confirming potential trend reversals and continuations. By leveraging both momentum (RSI) and volume data, this indicator provides a more comprehensive view of market strength compared to using RSI or volume alone.
How It Works:
This indicator calculates a score by comparing the RSI against its moving average, adjusted by the volume data. The resulting score quantifies market momentum and strength. When the score crosses its signal line, it may indicate key moments where the market shifts between bullish and bearish trends, potentially helping traders spot these changes earlier.
Calculation Methods:
The RSI VOL Score allows users to select between several calculation methods to suit their strategy:
SMA (Simple Moving Average): Provides a balanced smoothing approach.
EMA (Exponential Moving Average): Reacts more quickly to recent price changes, offering faster signals.
VWMA (Volume Weighted Moving Average): Emphasizes high-volume periods, focusing on stronger market moves.
WMA (Weighted Moving Average): Applies greater weight to recent data for a more responsive signal.
What the Indicator Plots:
Score Line: Represents a combined metric based on RSI and volume, helping traders gauge the overall strength of the trend.
Signal Line: A smoothed version of the score that helps traders identify potential trend changes. Bullish signals occur when the score crosses above the signal line, while bearish signals occur when the score drops below.
Key Features:
Trend Identification: The score and signal line crossovers can help confirm emerging bullish or bearish trends, allowing traders to act on upward or downward momentum.
Customizable Settings: Traders can adjust the lengths of the RSI and signal line and choose between different moving averages (SMA, EMA, VWMA, WMA) to tailor the indicator to their trading style.
Timeframe-Specific: The indicator works within the selected timeframe, ensuring accurate trend analysis based on the current market context.
Practical Use Cases:
Trending Markets: In trending markets, this indicator helps confirm bullish or bearish signals by validating price moves with volume. Traders can use the crossover of the score and signal line as a guide for entering or exiting trades based on trend strength.
Ranging Markets: In ranging markets, the indicator helps filter out false signals by confirming if price movements are backed by volume, making it a useful tool for traders looking to avoid entering during weak or uncertain market conditions.
Interpreting the Score and Signal Lines:
Bullish Signal: A bullish signal occurs when the score crosses above the signal line, indicating a potential upward trend in momentum and price.
Bearish Signal: A bearish signal is generated when the score crosses below the signal line, suggesting a potential downward trend or weakening market momentum.
By mathematically combining RSI and volume data into a single trend score, the RSI VOL Score indicator provides traders with a powerful tool for identifying trend shifts early and making more confident trading decisions.
Important Note:
The signals generated by this indicator should be interpreted in conjunction with other analysis tools. It is always advisable to confirm signals before making any trading decisions.
Disclaimer:
This indicator is designed to assist traders in their decision-making process and does not provide financial advice. The creators of this tool are not responsible for any financial losses or trading decisions made based on its signals. Trading involves significant risk, and users should seek professional advice or conduct their own research before making any trading decisions.

Buy/Sell IndicatorBuy/Sell Indicator
Overview
The Buy/Sell Indicator is designed to help traders identify potential entry and exit points in the market using a combination of Simple Moving Averages (SMA) and the Relative Strength Index (RSI). This indicator plots buy and sell signals directly on the chart, making it easier to make informed trading decisions.
Inputs
Fast MA Length: The period for the fast-moving average. Default is 9.
Slow MA Length: The period for the slow-moving average. Default is 21.
RSI Length: The period for the RSI calculation. Default is 14.
RSI Overbought Level: The RSI level considered overbought. Default is 70.
RSI Oversold Level: The RSI level considered oversold. Default is 30.
How It Works
Moving Averages:
The indicator calculates two SMAs: a fast-moving average (fastMA) and a slow-moving average (slowMA).
The fast MA reacts more quickly to price changes, while the slow MA reacts more slowly.
RSI:
The RSI is calculated to measure the momentum of price movements.
It helps identify overbought and oversold conditions in the market.
Buy and Sell Conditions:
Buy Signal: A buy signal is generated when the fast MA crosses above the slow MA and the RSI is below the overbought level.
Sell Signal: A sell signal is generated when the fast MA crosses below the slow MA and the RSI is above the oversold level.
Plotting
Buy Signals: Displayed as green labels below the bars where the buy condition is met.
Sell Signals: Displayed as red labels above the bars where the sell condition is met.
Moving Averages: The fast MA is plotted in blue, and the slow MA is plotted in orange.

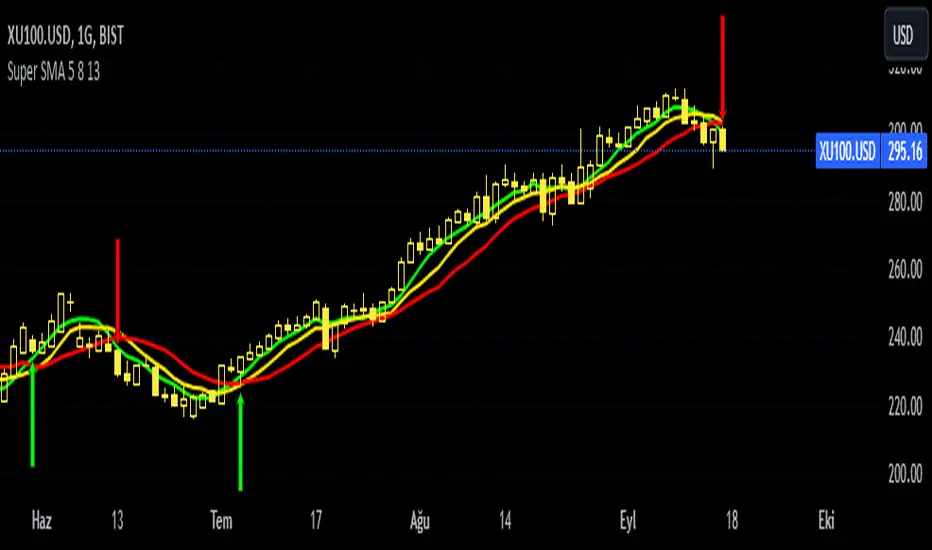
Super SMA 5 8 13This indicator is based on the 5 8 13 simple moving average strategy of strategist Selçuk Gönençler. The indicator shows buy and sell signals when favorable conditions occur.
══ H O W T O U S E ══
Above 5-8-13 - Confirmed hold/buy
5 below (8-13 above) - Be careful, lose weight but don't run away.
Below 5-8 (above 13) - Risk has begun. Don't be stubborn. 13 is your last castle.
5-8-13 below. Don't fight! Wait until it rises above 5-8 again.
Futures All List / Sell SignalAs of May 2023, there are more than 180 usdt perpetual coins on the binance futures exchange. These coins are included in the indicator in lists of 40. They are sorted instantly in the table from largest to smallest. The sorting style can be changed in the indicator settings. This indicator collects RSI and TSI values at desired values. The result has a maximum value of 600. A value of 600 signals that the price will decrease or remain stable for a certain period of time. Generally, a short can be expected from the closest point to 600. If 3 separate lists are selected by using 3 of these indicators, 120 coins can be analyzed at the same time. Available in all time zones. Examine it in a 3-minute timeframe. The line inside the indicator draws the instantaneous values of the relevant coin.

Inside candle (Inside Bar) Strategy- by smartanuThe Inside Candle strategy is a popular price action trading strategy that can be used to trade in a variety of markets. Here's how you can trade the Inside Candle strategy using the Pine script code provided:
1. Identify an Inside Candle: Look for a candlestick pattern where the current candle is completely engulfed within the previous candle's high and low. This is known as an Inside Candle.
2. Enter a Long Position: If an Inside Candle is identified, enter a long position at the open of the next candle using the Pine script code provided.
3. Set Stop Loss and Take Profit: Set a stop loss at a reasonable level to limit your potential losses if the trade goes against you. Set a take profit at a reasonable level to take profit when the price reaches the desired level.
4. Manage the Trade: Monitor the trade closely and adjust the stop loss and take profit levels if necessary. You can use the Pine script code to automatically exit the trade when the stop loss or take profit level is hit.
5. Exit the Trade: Exit the trade when the price reaches the take profit level or the stop loss level is hit.
It's important to note that the Inside Candle strategy is just one of many strategies that traders use to trade the markets. It's important to perform your own analysis and use additional indicators before making any trades. Additionally, it's important to practice proper risk management techniques and never risk more than you can afford to lose.

[LazyBear] SQZ Momentum + 1st Gray Cross Signals ━ whvntrI have modified LazyBears Squeeze Momentum Indicator with enhancements, plus added signals
LazyBear mentioned that in John F. Carter's book, Chapter 11, "Mastering the Trade", that "Mr. Carter suggests waiting till the first gray after a black cross, and taking a position in the direction of the momentum (for ex., if momentum value is above zero, go long). Exit the position when the momentum changes (increase or decrease --- signified by a color change)." I have done just that. Now at each "first gray after a black cross", there are now Bearish and Bullish signals.. The signals only appear in the direction of the momentum.
Disclaimer: This indicator does not constitute investment advice. Trade at your own
risk with this method of identifying changes in stock market momentum.

HMA Breakout Buy/Sell indicator for Scalping & Intraday - ShyamHi All,
This is a very simple indicator which provides the buy signal, when the moving average lines turns Green and sell signal, when the moving average signal turns red. This can be used for both intraday and scalping method with different timeframes. But best time frame is 5 minutes.
Buy Signal >>> Line turns GREEN (Use trailing SL to cover maximum profit)
Sell Signal >>> Line turns RED (Use trailing SL to cover maximum profit)
No trade >>> Line turns GRAY
Best timeframe >>> 5 minutes
Thanks,
Shyam

Attrition Scalper v2.0Green/Red Arrowed Buy/Sell signals are just simple buy sell signals based on SuperTrend, VWAP, Bollinger, Linear Regression
Purple Arrowed Buy/Sell Signals happen when the price/candle cross over or under the yellow outer lines (4.236 fib lines) It's extremely rare and hard for price to stay above these lines therefore we can usually and comfortably buy/sell it, a key information here though when price pumps or dumps super fast and hard to the point of crossing these borders, the trend might also be extremely strong and continous so even if the price temporarily goes back inside the borders as the lines expand over time price can continue riding or crossing these lines back again and continue the uptrend/downtrend, therefore crossing these outer borders doesn't necessarilly and always mean a reversal is due.
When analyzing the instrument you're trading the important factors for support/resistance areas are usually the outer lines like i said previously it's super hard for price to be outside these and will almost always get back inside quickly. The Middle thicker green/red line which is Variable Index Dynamic Average should also be a nice pivot line for major support and resistance . All the other lines are also important dynamic support/resistance lines.
Their Importance Order
1- Outer Yellow Line (4.236 Fibs)
2- Thicker Middle Green/Red Line (VIDYA)
3- Thinner Upper/Lower Green/Red Line (VIDYA +3, VIDYA -3)
4- The Rest Of The Lines (Fib Lines)
You can use this indicator in any market condition in any market to determine key support/resistance levels, use it for mean reversion through price expanding to outside of the most outer line therefore being overbought/oversold basically using the purple buy/sell signals or only follow the normal buy/sell signals or use it in confluence with each other. You can also use this indicator in confluence with your own manual technical analysis or other indicators/strategies you are already using and are comfortable with.
A good part is the support/resistance lines from timeframe to timeframe pictures the whole situation quite well, you can use lower timeframe to find your entry/exit positions and higher timeframe to find your key support/resistance points, they all should be somewhat in confluence from timeframe to timeframe anyways. My recommendation would be to look at 1HR, 4HR and 1D charts for swing trading and 5-15 Min for quick scalping/day trading
You should still probably at least take a look to higher timeframes so that you don't get burned when you realize there is a huge resistance line at price XXXXX on the 4 hour chart but you're expecting it to go above it on the 5 minute chart, it can go above it temporarily but we analyze everything on a closing basis so it most likely won't close above it. Again don't take a position or FOMO when price breaks a support/resistance line, we're looking for a CLOSE above/below them and a retest to see if S/R flip happened would even be better.
Sometimes the most outer line won't be the 4.236 (Yellow) lines as when it gets quite volatile the Thinner Upper/Lower Green/Red Lines (VIDYA +3, VIDYA-3) might cross them to be the most outer line, in this case i have observed that the trend is extremely strong this time price almost always doesn't go above or below the VIDYA line but can stay outside of the Yellow 4.236 Fib line for an extended amount of time (price will still get back inside the channel relatively quickly, just not as fast as the normal condition)
With Proper Risk Management and Discipline this indicator can be of great use to you as it's surprisingly successful especially at mean reversion and pointing out the support/resistance lines, they are so much more successful than your average MA/EMA lines.

Range Detector Indicator [Misu]█ This indicator shows an upper and lower band based on Highs and Lows.
Depending on this, the indicator interprets a ranging market, an uptrend or a downtrend.
█ Usages:
The purpose of this indicator is to identify when the price is ranging.
It's also used to identify changes in trends, breaking points, and trend reversals.
But it can also be used to show resistance or support levels.
█ Features:
> Price Action Change Alerts
> Price Action Change Labels
> Color Bars
> Show Bands
█ Parameters:
Deviation: A parameter used to calculate pivots.
Depth: A parameter used to calculate pivots.
Activate Range Detection: Check the box to activate range detection.
Band% Offset: A factor that is used to vary the bands offset.

V Bottom & V Top Pattern [Misu]█ This indicator shows V bottom & V top patterns as well as potential V bottom & V top.
These V bottom & V top are chart powerful reversal patterns.
They appear in all markets and time-frames, but due to the nature of the aggressive moves that take place when a market reverses direction, it can be difficult to identify this pattern in real-time.
To address this problem, I added potential V pattern as well as the confirmed one.
█ Usages:
You can use V top & V bottoms for reversal zones.
You can use it for scalping strategies, as a main buy & sell signal.
Potential V patterns can be used to anticipate the market, in addition to volatility or momentum indicators, for example.
█ How it works?
This indicator uses pivot points to determine potential V patterns and confirm them.
Paramaters are available to filter breakouts of varying strengths.
Patterns also have a "max number bars" to be validated.
█ Why a Strategy type indicator?
Due to the many different parameters, this indicator is a strategy type.
This way you can overview the best settings depending on your pair & timeframe.
Parameters are available to filter.
█ Parameters:
Deviation: Parameter used to calculate parameters.
Depth: Parameter used to calculate parameters.
Confirmation Type: Type of signal used to confirme the pattern.
> Mid Pivot: pattern will confirm on mid pivot breakout.
> Opposit Pivot: pattern will confirm on opposit pivot breakout.
> No confirmation: no confirmation.
Lenght Avg Body: Lenght used to calculate the average body size.
First Breakout Factor: This factor multiplied by the "body avg" filters out the non-significant breakout of potential V pattern.
Confirmation Breakout Factor: This factor multiplied by the "body avg" filters out the non-significant breakout for the confirmation.
Max Bars Confirmation: The maximum number of bars needed to validate the pattern.

Simple Buy Sell SignalsIt is a simple indicator that provides buy or sell signals based on the intersection of two EMAs and a simple moving average (SMA). once the Relative Strength Index has confirmed it. For greater accuracy, add additional indicators like stochastic RSI, MACD, etc. Use only for intraday trading, Not for Positional Trading

TriexDev - SuperBuySellTrend (PLUS+)Minimal but powerful.
Have been using this for myself, so thought it would be nice to share publicly. Of course no script is correct 100% of the time, but this is one of if not the best in my basic tools. (This is the expanded/PLUS version)
Github Link for latest/most detailed + tidier documentation
Base Indicator - Script Link
TriexDev - SuperBuySellTrend (SBST+) TradingView Trend Indicator
---
SBST Plus+
Using the "plus" version is optional, if you only want the buy/sell signals - use the "base" version.
## What are vector candles?
Vector Candles (inspired to add from TradersReality/MT4) are candles that are colour coded to indicate higher volumes, and likely flip points / direction changes, or confirmations.
These are based off of PVSRA (Price, Volume, Support, Resistance Analysis).
You can also override the currency that this runs off of, including multiple ones - however adding more may slow things down.
PVSRA - From MT4 source:
Situation "Climax"
Bars with volume >= 200% of the average volume of the 10 previous chart TFs, and bars
where the product of candle spread x candle volume is >= the highest for the 10 previous
chart time TFs.
Default Colours: Bull bars are green and bear bars are red.
Situation "Volume Rising Above Average"
Bars with volume >= 150% of the average volume of the 10 previous chart TFs.
Default Colours: Bull bars are blue and bear are blue-violet.
A blue or purple bar can mean the chart has reached a top or bottom.
High volume bars during a movement can indicate a big movement is coming - or a top/bottom if bulls/bears are unable to break that point - or the volume direction has flipped.
This can also just be a healthy short term movement in the opposite direction - but at times sets obvious trend shifts.
## Volume Tracking
You can shift-click any candle to get the volume of that candle (in the pair token/stock), if you click and drag - you will see the volume for that range.
## Bollinger Bands
Bollinger Bands can be enabled in the settings via the toggle.
Bollinger Bands are designed to discover opportunities that give investors a higher probability of properly identifying when an asset is oversold (bottom lines) or overbought (top lines).
>There are three lines that compose Bollinger Bands: A simple moving average (middle band) and an upper and lower band.
>The upper and lower bands are typically 2 standard deviations +/- from a 20-day simple moving average, but they can be modified.
---
Base Indicator
## What is ATR?
The average true range (ATR) is a technical analysis indicator, which measures market volatility by decomposing the entire range of an asset price for that period.
The true range indicator is taken as the greatest of the following:
- current high - the current low;
- the absolute value of the current high - the previous close;
- and the absolute value of the current low - the previous close.
The ATR is then a moving average, generally using 10/14 days, of the true ranges.
## What does this indicator do?
Uses the ATR and multipliers to help you predict price volatility, ranges and trend direction.
> The buy and sell signals are generated when the indicator starts
plotting either on top of the closing price or below the closing price. A buy signal is generated when the ‘Supertrend’ closes above the price and a sell signal is generated when it closes below the closing price.
> It also suggests that the trend is shifting from descending mode to ascending mode. Contrary to this, when a ‘Supertrend’ closes above the price, it generates a sell signal as the colour of the indicator changes into red.
> A ‘Supertrend’ indicator can be used on equities, futures or forex, or even crypto markets and also on daily, weekly and hourly charts as well, but generally, it will be less effective in a sideways-moving market.
Thanks to KivancOzbilgic who made the original SuperTrend Indicator this was based off
---
## Usage Notes
Two indicators will appear, the default ATR multipliers are already set for what I believe to be perfect for this particular (double indicator) strategy.
If you want to break it yourself (I couldn't find anything that tested more accurately myself), you can do so in the settings once you have added the indicator.
Basic rundown:
- A single Buy/Sell indicator in the dim colour; may be setting a direction change, or just healthy movement.
- When the brighter Buy/Sell indicator appears; it often means that a change in direction (uptrend or downtrend) is confirmed.
---
You can see here, there was a (brighter) green indicator which flipped down then up into a (brighter) red sell indicator which set the downtrend. At the end it looks like it may be starting to break the downtrend - as the price is hitting the trend line. (Would watch for whether it holds above or drops below at that point)
Another example, showing how sometimes it can still be correct but take some time to play out - with some arrow indicators.
Typically I would also look at oscillators, RSI and other things to confirm - but here it held above the trend lines nicely, so it appeared to be rather obvious.
It's worth paying attention to the trend lines and where the candles are sitting.
Once you understand/get a feel for the basics of how it works - it can become a very useful tool in your trading arsenal.
Also works for traditional markets & commodities etc in the same way / using the same ATR multipliers, however of course crypto generally has bigger moves.
---
You can use this and other indicators to confirm likeliness of a direction change prior to the brighter/confirmation one appearing - but just going by the 2nd(brighter) indicators, I have found it to be surprisingly accurate.
Tends to work well on virtually all timeframes, but personally prefer to use it on 5min,15min,1hr, 4hr, daily, weekly. Will still work for shorter/other timeframes, but may be more accurate on mid ones.
---
This will likely be updated as I go / find useful additions that don't convolute things. The base indicator may be updated with some limited / toggle-able features in future also.

Simple Buy and Sell SignalsThis is a Simple Indicator which shows buy and sell signals based on MACD and SSL channel.
It is not a Holy Grail Indicator. It shows a lot of false signals when the market is Consolidation Zone.
So don't use this indicator to place trades based on signals given by the indicator.
Use this as a confluence along with your technical analysis
On lower timeframes there are a lot of signals so to eliminate false signals , get a signal on higher timeframe and place a trade in the direction of the trend on lower timeframe.
Hope you'll find this helpful. Enjoy👍.
TriexDev - SuperBuySellTrendMinimal but powerful.
Have been using this for myself, so thought it would be nice to share publicly. Of course no script is correct 100% of the time, but this is one of if not the best in my basic tools.
Two indicators will appear, the default ATR multipliers are already set for what I believe to be perfect for this particular (double indicator) strategy.
If you want to break it yourself (I couldn't find anything that tested more accurately myself), you can do so in the settings.
Basic rundown:
A single Buy/Sell indicator in the dim colour; may be setting a direction change, or just healthy movement.
When the brighter Buy/Sell indicator appears; it often means that a change in direction (uptrend or downtrend) is confirmed.
You can see here, there was a (brighter) green indicator which flipped down then up into a (brighter) red sell indicator which set the downtrend. Once you understand the basics of how it works - it can become a very useful tool in your trading arsenal.
Typically I will use this and other indicators to confirm likeliness of a direction change prior to the brighter/confirmation one appearing - but just going by the 2nd(brighter) indicators, have found it to be surprisingly accurate.
Tends to work well on virtually all timeframes, but personally prefer to use it on 5min,15min,1hr, 4hr, daily, weekly. Will still work for shorter/other timeframes, but may be more accurate on mid ones.

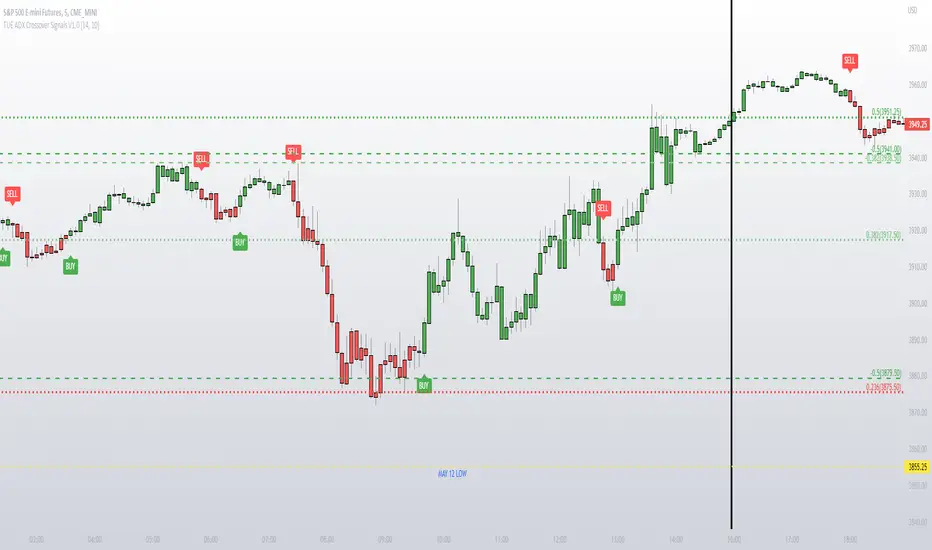
TUE ADX Crossover Signals V1.0This simple indicator gives you a way to visualize ADX crossovers on your chart and is a good companion if you like to trade with the ADX.
Green candles have a DI+ over DI- crossover, and vice versa for the red candles.
It gives you the ability to turn on and off BUY and SELL signals generated from the ADX crossovers.
Code is provided open source, feel free to use it for any purpose other than resale.
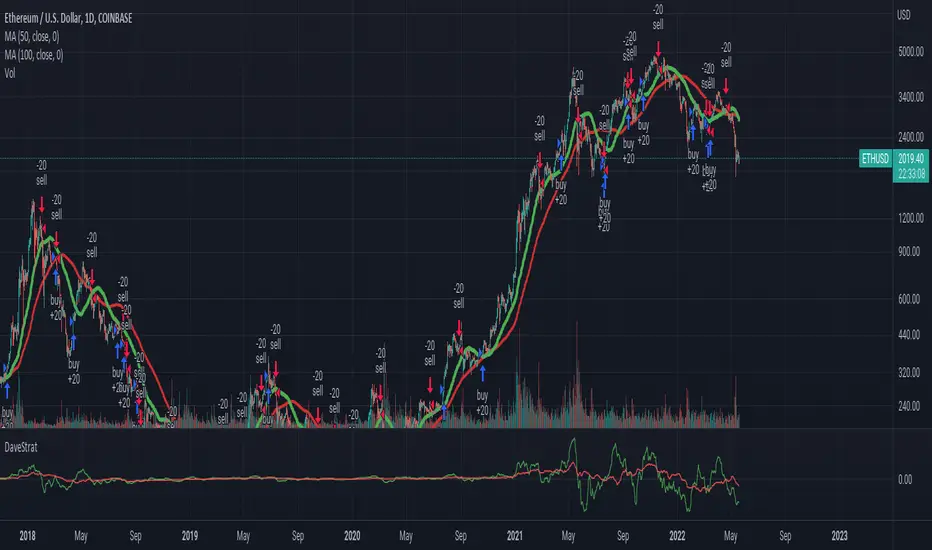
DaveStratThis script attempts to guess inflection points in cryptocurrency asset prices using change in two simple moving averages on the daily timescale.