ASX Buy/Sell Arrow Signals For Australian Equities TradingASX Buy/Sell Arrow Signals For Australian Equities Trading.
ASX:ASX
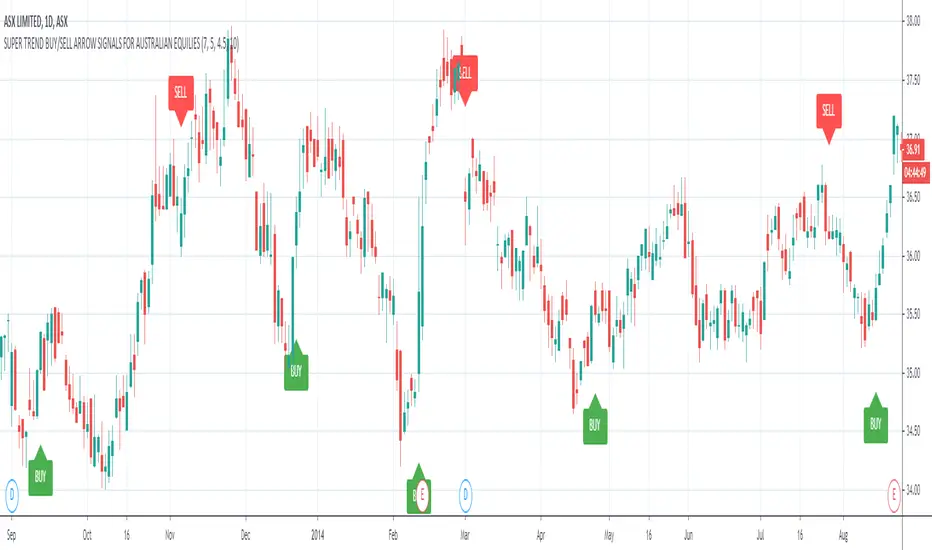
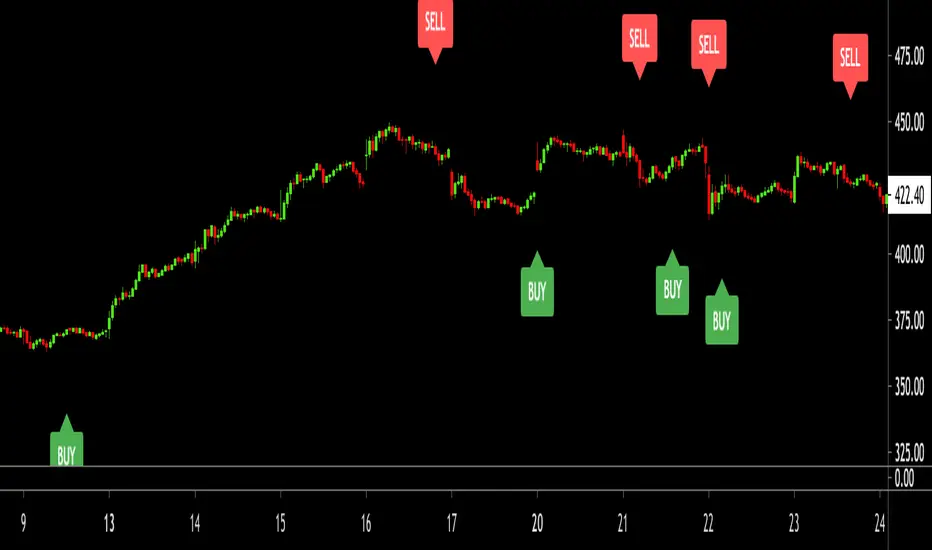
This indicator is specifically designed to trade on assets on the Australian Stock Exchange.
The indicator analyzes historical data and predicts short-term trends and reversal points, as well as generates alert Buy/Sell or Long/Short trading signals.
A distinctive feature of this indicator is that the signals are filtered and high-precision signals are displayed.
The script is useful for trading as an independent trading system, as well as in combination with other indicators, as an addition to any existent trading system.
This script was compiled at the request of our subscribers and we hope it will be useful in trading.
The indicator uses a combination of few popular indicators such as MACD, RSI, Moving Averages.
Recommended for trading on timeframes: D1, W1.
Sellsignal
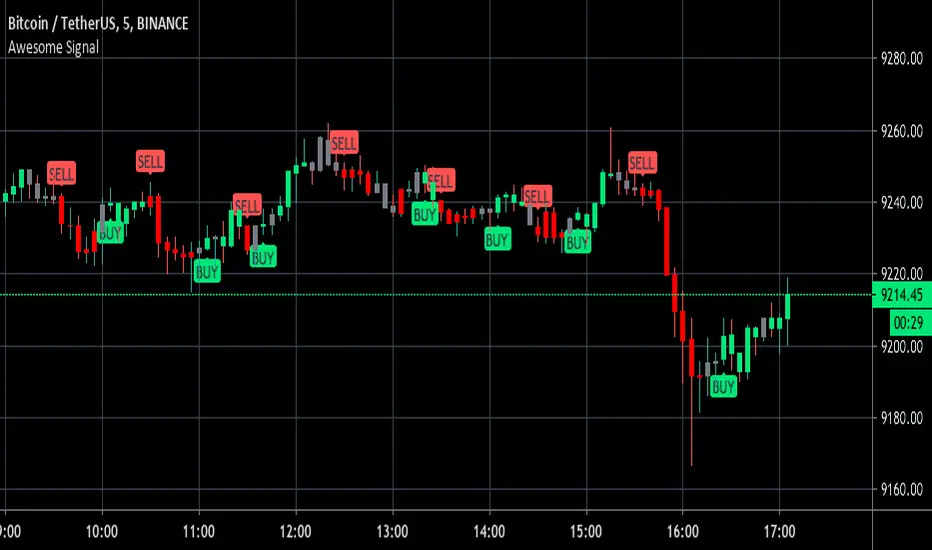
Awesome Buy/Sell SignalBuy and Sell signals using Bill William oscillators. Works for anything with high volume both crypto and stocks.
Optimal at Lower time frames and larger time frames can give you trend.
Green painted bars bullish momentum
Grey painted bars undecided momentum
Red painted bars bearish momentum.
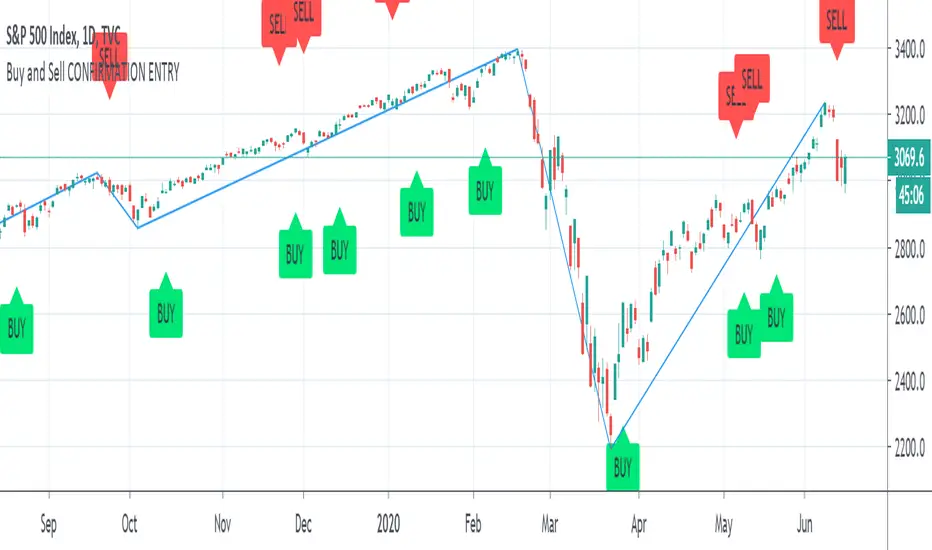
Buy and Sell CONFIRMATION ENTRY"Buy and Sell CONFIRMATION ENTRY" Product Description:
The indicator identifies market trends with visual buy/sell alerts on the chart.
Useful on higher timeframes available on Tradingview (ex: 4 hours, 1 Day).
The "Buy and Sell Confirmation" Indicator combines Moving Average Convergence Divergence and Relative Strength Index, which triggers technical signals when it crosses above (to buy) or below (to sell) its signal line. The crossovers transformed in buy and sell indicators is also taken as a signal of a market is overbought or oversold. The swing lines help you draw Elliott Waves to understand better where the market is heading.
The indicator can be used for every type of market: indices, stocks, cryptocurrencies, currencies and others.
This study is not a guarantee profit. You should backtest or trade virtual money before using this study on your real portfolio, as it is intended to be a tool and not a fortune teller.
Disclaimer: Trading and investing in the stock market and cryptocurrencies involves substantial risk of loss and is not suitable for every investor. The content covered in this videos is NOT to be considered as investment advice. I’m NOT a financial adviser. All trading strategies are used at your own risk.
Please send me a private message on TradingView to gain access to the script.
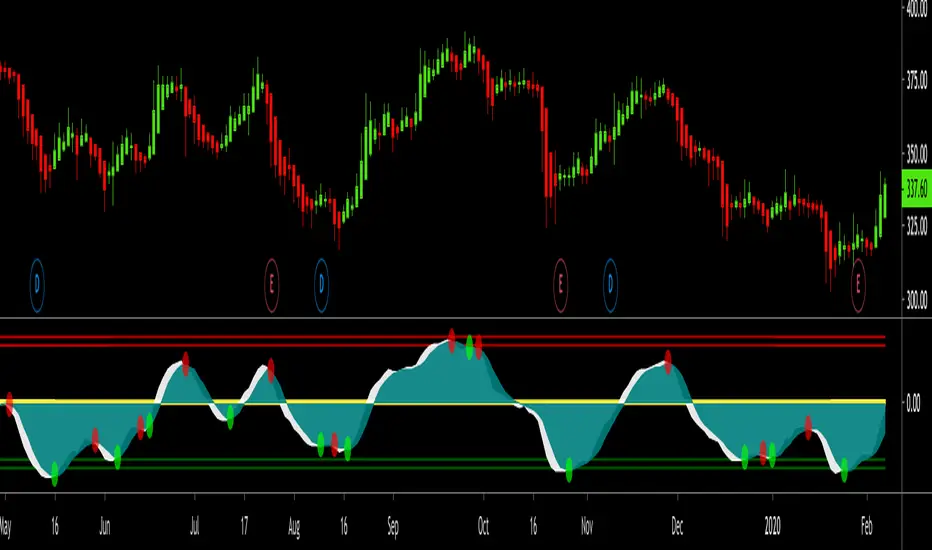
Buy/Sell IndicatorBased on logic from many top contributors here, the script utilizes LazyBear's WaveTrend Oscillator Indicator along with custom code to plot a few key components for daily trading;
Boundaries for entry and exit points which are based on a 6-day trend in OPEN/HIGH and OPEN/LOW prices.
Daily HIGH and LOW points to establish a good view of stock's movements
Entry and exit points with confidence levels. These can be treated as entry points for short to medium term investments
Entry points come in the colours of White and Lime, where white is slightly confident and lime is extremely confident
Exit points come in the colours of Maroon, and Red, where maroon is slightly confident and red is extremely confident
Each Entry and Exit point also comes without text, or with a M or H above it, where M indicates medium confidence on the point and an O indicates overconfidence.
Use Case:
The best possible use case is to enter a trade on a LIME point with O text, this means that is an overconfident entry point.
The trade should be exited on a RED point with O text, this means that is an overconfident exit point.
But you can do with the indicators as you please.
In addition to LazyBear's code, the following existing models and indicators are taken into account:
RSI of closing price over a period of 25
EMA of RSI

RSI Market trendClear indication of market up and down trend so that you can stick to Buy or Sell strategy based on RSI.
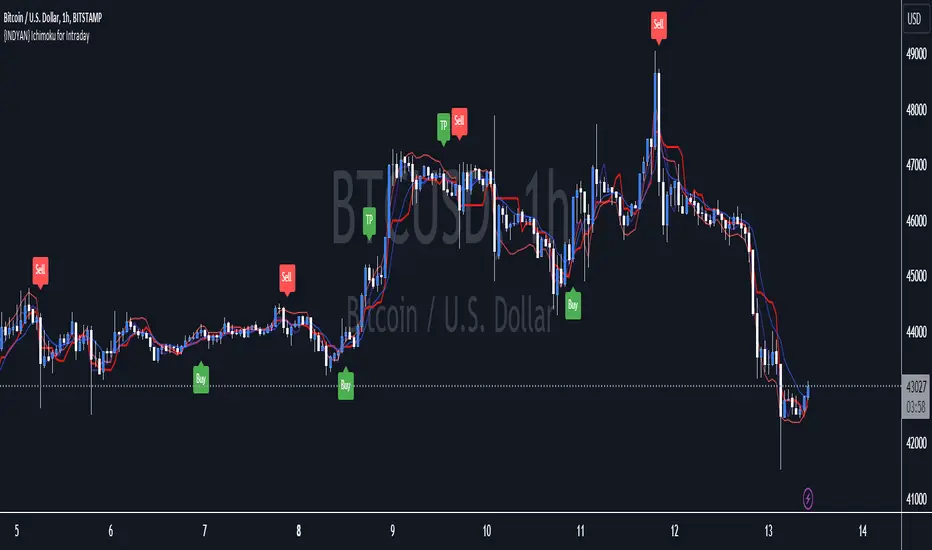
{INDYAN} Ichimoku for IntradayIts based on ichimoku, i removed cloud and mod some changes for better use in intraday trading. It can be used in stocks and index as well.Not tested on MCX and Forex.
Just watch at crossover of tenkan and kijun that RSI macd is above 60 and zero or not? If all three parameters meet go for long... exit when again another cross happen or rsi go below 40.for sell side watch for rsi below 40 and macd below zero line while crossover of kijun tenkan.
Better to use it with RSI+Macd Fast to get more accurate results.
#for better confirmation look value of VWAP and decide accordingly
Do back test before using it.
Happy Trading
Love INDyAN
#change line color as per ur wish but value should be same as it was default entered.
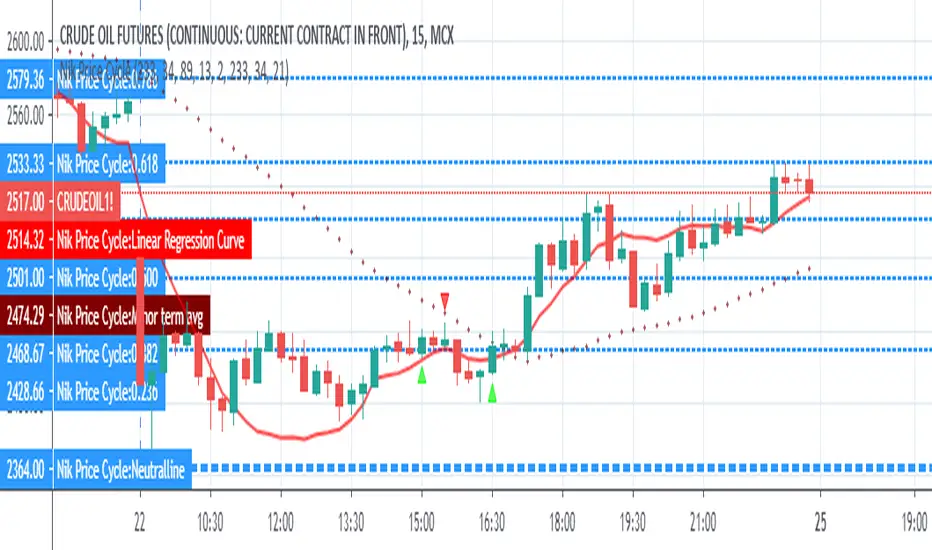
Nikesh Price CycleEvery Script has a pattern and it follows a cyclic movement which results into many small and big swings. We have tried to capture these cyclic pattern. Division line acts here as a pivot point which defines a holistic view of bulls and bear power. Price moving above division line indicates bullish trend and price moving below division line indicates bearish trend. Price scale bar defines trend momentum. when price crosses price scale bar with green scale bar colour it shows we should enter. we will keep on booking our profit on near next fib level. we will exit the trend once price candle crosses linear regression line. for safe entry in case of bulls entry-- price scale bar,linear regression line and mid avg term line should be below price candle. In case of bears entry--price scale bar,linear regression line and mid avg term line should be above price candle.

KINSKI Buy-Sell Signal"KINSKI Buy-Sell Signal" is an Average True Range (ATR) based trailing stop indicator.
In this version, you can change the ATR calculation method using the settings. The default method is hlc3. The HLC stands for High, Low, Close and the /3 divides the result by 3 to give you the average.
The indicator calculates the buy and sell signals using HLC3, Simple Moving Average ( SMA ) and the Exponential Moving Average ( EMA ) as soon as they cross. This indicator is useful with time intervals starting at 15m.
Have fun with it and be careful when buying and selling!
Example Chart:

Nik Price CycleEvery script follow a pattern in their price cycle. This can be defined by division of price cycle. Division line will act as pivot point.Above this bar this any price movement is indication of bullish trend while below this line any price movement is indication of bearish trend. This Nik price signal will give great result in combination of magicsignal which is also one of our developed signal. Although we have included various calculation for analysis purpose in this indicator. i suggest to go in setting and uncheck all channel lines and shapes for getting clear picture of trend and entry point. for more details on how to use this indicator people can message us
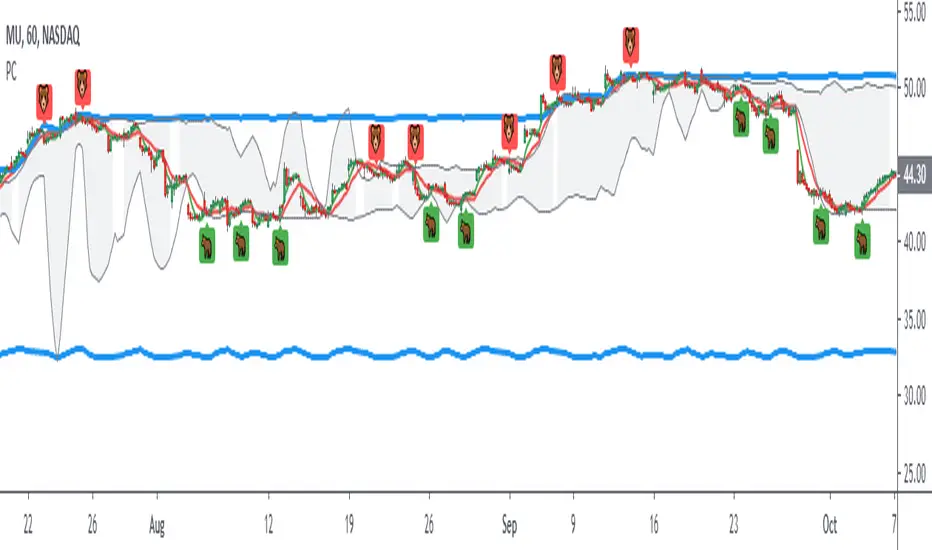
McMillan Volatility Bands w/ Buy & Sell Signals [optstrategist]BACKGROUND
McMillan Volatility Bands are an alternative approach to John Bollinger's "Bollinger Band" study and developed by world-renowned options trader and author Lawrence G. McMillan. Given his background in options trading, it was natural for Lawrence to approach any volatility-based study in the same manner options are priced --using Black-Scholes model. This model of pricing assumes a financial asset's volatility should be measured in percentage change rather than absolute value change.
OVERVIEW
The McMillan Volatility Bands indicator for TradingView will plot the 3 and 4-standard deviation bands around a 20-day moving average. This is how Larry has always used this system. The user can, however, change the standard deviation value as well as the moving average length to their preferred setting. This indicator can be used on any asset and on any timeframe.
Furthermore, the indicator will plot buy and sell signals based on a trading system used by Larry in his flagship newsletter publication The Daily Strategist. The system gives a signal when price closes outside the 4-sigma band and then closes back within the 3-sigma band. That 'signal bar' will be colored red or green for a sell or buy signal setup, respectively.
Finally, an arrow will be plotted on the chart where the system would actually enter the trade. This is determined when price trades a little beyond the extreme of the 'signal bar'. The level by which price has to go beyond the 'signal bar' is an input parameter and can be adjusted by the user. We've chosen the default value of 0.34. This means, the indicator will not give a buy or sell entry until the price moves: 1/3 x beyond the extreme signal bar. This is to prevent getting whipsawed by some setups that never really move in your favor. We've found it successfully removes the less-valuable trade setups.
PARAMETERS
ma_length => length of the moving average that the volatility bands work off of
outside_sigma => standard deviation of outer volatility band
inside_sigma => standard deviation of inner volatility band
entry_trigger_cushion => this refers to the percentage of the signal bar's range. The default value is 0.34. This means price will need to move 1/3 (~34%) of the signal bar's range beyond the high (for a buy) or low (for a sell) of the signal bar to trigger a buy/sell entry. This entry plots the arrow on the chart. We have found requiring this extra move in price eliminates many of the less-desirable signals at the expense of entering the better signals a little later.
WANT TO PURCHASE OR NEED MORE INFORMATION ON McMILLAN VOLATILITY BANDS?
Visit the link below to see purchasing options as well as screenshots of the indicator and how we trade it at McMillan Analysis Corp.

™TʀᴀᴅᴇCʜᴀʀᴛɪsᴛ Tʀᴇɴᴅsᴇᴛᴛᴇʀ™TradeChartist Trendsetter is an elegantly designed functional indicator that helps spot price trends based on user input and volatility to generate high probability BUY and SELL signals.
1. What does ™TradeChartist Trendsetter do?
Plots high probability BUY/SELL signals based on user input and price volatility.
Plots recommended Stop Loss and SOS signals.
Plots regular RSI divergences based on user input.
Plots Linear Regression trend lines based on user input.
Displays Trendsetter Dashboard with useful trade information.
Displays real time gains tracker.
Tracks another symbol on Dashboard based on user input.
Alerts when BUY and SELL signals are generated.
2. What markets can this indicator be used on?
Forex
Stocks - Signal prices calculated taking gaps into account.
Commodities
Cryptocurrencies
and almost any asset on Trading View.
Works really well when there is good volume, volatility or both in the asset traded/observed.
3. Do the indicator signals repaint?
No. Once the BUY and SELL signals are generated with entry price (open price of signal candle), there is no repainting.
This can be verified using Trading View Bar Replay to check if the signals stay in the same candle in real-time as the Bar Replay.
4. Does the indicator send alerts when a signal is generated?
Yes. Traders can get alerts by setting up Trading View alerts for BUY/SELL signals. For confirmed BUY/SELL alerts, 'Once Per Bar' must be used as there is no need to wait for the candle close.
Example Charts
GBP-USD 1hr chart with indicator plots description
GOLD 4hr chart using Daily HTF resolution from indicator settings.
SPX 15m chart using Daily HTF resolution with RSI divergences.
Note: Default settings work really well for most assets and time frames. Change HTF resolution (default 4hr) from indicator settings and make sure it is higher time frame than the chart resolution.

Follow Line MTF Any MM AverageThe original version uses SMA, in this new version you can choose any type of MA and time frame.
- RMA,SMA,EMA,WMA,VWMA,SMMA,KMA,TMA,HullMA,DEMA,TEMA,CTI
- 1 min, 3 min, 5 min, 15 min, 30 min, 45min, 1h, 2h, 3h, 4h, 1d, 1w, 1M
- Alerts
Combine multiple time frames, this will come in handy ¡¡¡¡
Success in your trade ¡¡¡¡
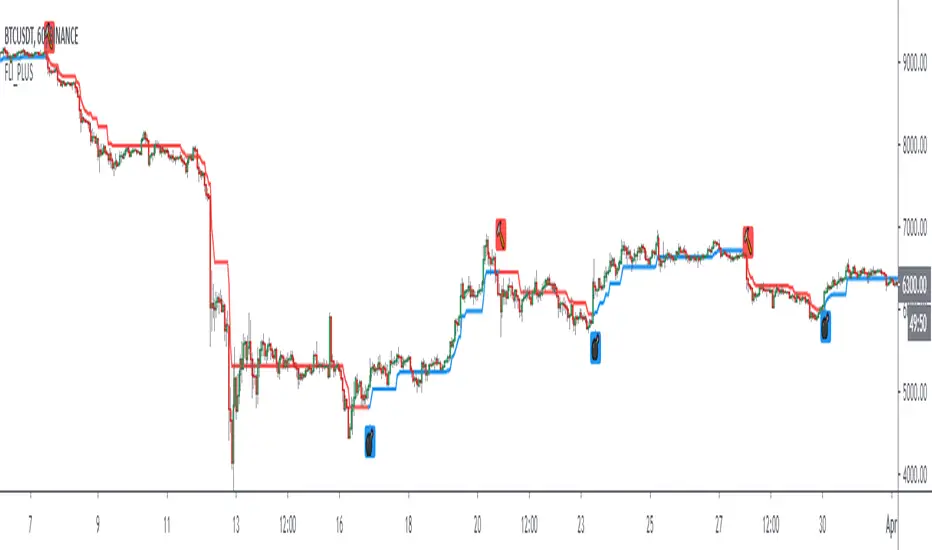
Follow Line IndicatorThe FollowLine indicator is a trend following indicator. The blue/red lines are activated when the price closes above the upper Bollinger band or below the lower one.
Once the trigger of the trend direction is made, the FollowLine will be placed at High or Low (depending of the trend).
An ATR filter can be selected to place the line at a more distance level than the normal mode settled at candles Highs/Lows.
Alerts Added

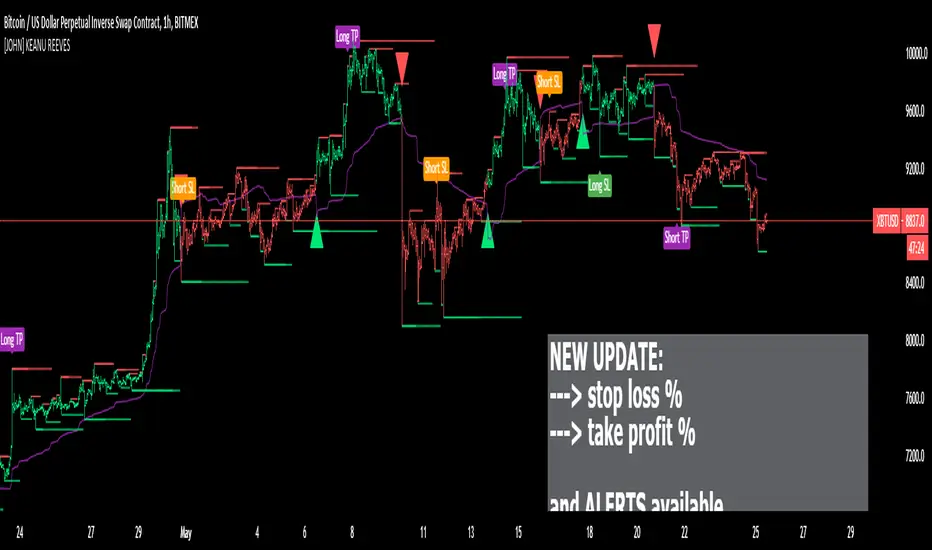
[JOHN] KEANU REEVESHello this is KEANU REEVES indicator. (Ideal for crypto)
---------------------------------
How this indicator work?
KEANU REEVES work with ATR, integrated with high and low system.
Support/resistance area as high/low. Check the images below.
This system provide high profitable signal with every pair and coins, with all timeframes.
Below last daily signal ROI
BITCOIN
ETH ROI
Some other timeframes WEEKLY AND H4 Bitcoin chart
Some other exmple EOS and ETH other perspective (different parameters)
[BT] - Manual TSSL [ALERTS] v1Manual TSSL - V1
Enter the market on your own, and use this script to alert you when to sell. I found myself many times in position but wanted a script to help automatically exit the market when I stepped away.
Directions
You must provide the timestamp and price in the settings. Adjust the TSSL settings, make sure you leave enough room so the market can breath. Once the price goes below the bottom TSSL red line, is when the alert will trigger. Added some labels to keep track of the buy/sell and when the bottom TSSL price moves up.
If you like this idea, but would like another indicator instead of TSSL, please feel free to message me directly.
Thanks for looking!

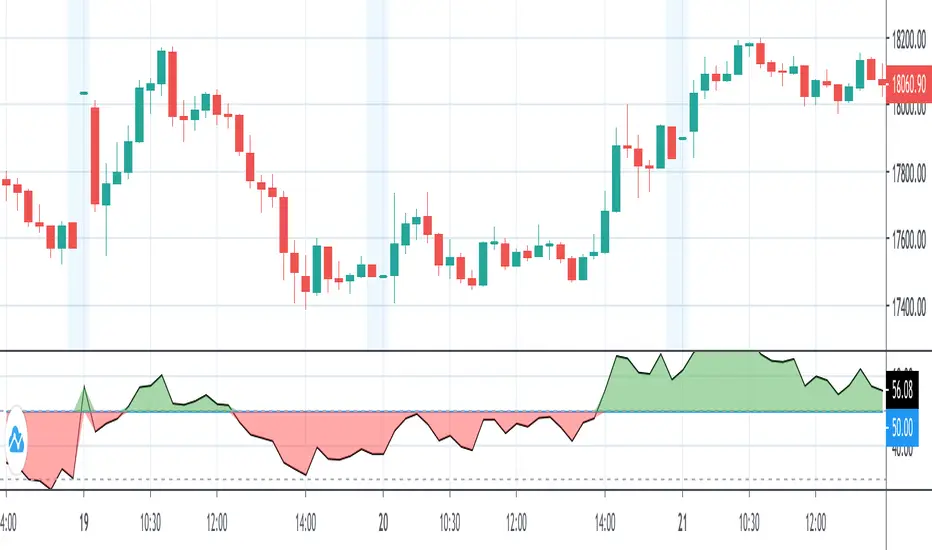
Swing Trade Pros - Buy/Sell SignalsThe STP Buy/Sell Signals are real-time indicators that accurately show the swings in the market. When the shorter average crosses the longer average in the upward direction it triggers a Buy signal. and when crossing in the downward direction signals a Sell signal. You also have the ability to set up alerts to maximize your profit. With these signals it will help to reduce risk and easily recognize market patterns.
Swing Trade Pros - Wave Trend IndicatorThe STP Wave Trend Indicator allows you to catch big trends before they start by confirming the direction and momentum in real-time. This indicator can be used across all assets on any timeframe. When the oscillator (white area) crosses down the signal (green area), it is a good SELL signal. Similarly, when the oscillator crosses above the signal it is a good BUY signal. Another strategy is to buy when the oscillator crosses the oversold area and sell when it crosses the overbought area
CryptoSignalScanner - Stochastic Trend IndicatorDESCRIPTION:
This script has been designed to provide the ideal buy and sell moment on the lower time frames.
• This scripts is based on the Stochastic RSI Indicator.
• When we are in an uptrend the background becomes green.
• When we are in a downtrend the background becomes red.
• It is also possibility to set the overbought and oversold range.
HOW TO USE:
• When the blue line (stochastic K) has crossed above the red line (stochastic D) in the oversold area then this is the ideal moment to get into a trade.
• When the blue line (stochastic K) has crossed below the red line (stochastic D) in the overbought area then this is the ideal moment to get out of a trade.
• Use this together with the CryptoSignalScanner - Advanced BUY/SELL indicator to get a stronger confirmation.
• Use the Fibonacci tool together with the Eliot Waves to help you to find the ideal buy or sell moment.
HOW TO GET ACCESS TO THE SCRIPT:
• Use the link below to subscribe to our indicators.
REMARKS:
• This advice is NOT financial advice.
• We do not provide personal investment advice and we are not a qualified licensed investment advisor.
• All information found here, including any ideas, opinions, views, predictions, forecasts, commentaries, suggestions, or stock picks, expressed or implied herein, are for informational, entertainment or educational purposes only and should not be construed as personal investment advice.
• We will not and cannot be held liable for any actions you take as a result of anything you read here.
• We only provide this information to help you make a better decision.
• While the information provided is believed to be accurate, it may include errors or inaccuracies.
Good Luck,
The CryptoSignalScanner Team

LOTUS v1.0Welcome to Lotus v1.0 by Bloom Trading!
We aimed to create a useful script that takes an all in one approach.
In version 1.0 we have included a Buy/Sell module, a colored trend candle system, a support/resistance module, HA candle overlays, Bollinger Bands , and Ichimoku Cloud .
We wanted to combine or unique modules with some of our takes on the classics to make an all encompassing indicator suite.
-Buy/Sell Module
The Buy/Sell algorithm is composed of several unique factors to help users identify the underlying trend. We spent a lot of time developing a combination of indicators to provide accurate Buy/Sell signals. When a label prints "Buy", it may be a good time to consider entering a position. The opposite goes for "Sell" labels.
-Colored Trend Candles
To find further synergy we added colored trend candles. These work great in combination with the Buy/Sell signals. At its simplest, when the candles are green the trend is bullish , and when the candles are red the trend is bearish . We find it especially useful in situations where a Buy/Sell signal prints, to look at the color of the following candle. For example, strong confluence would be, when a buy signal prints, that the following candle be green. If not, then the buy signal is weak and to proceed with caution. On the contrary, if a buy signal prints and the next candle is green, it may be a great time to consider an entry. The exact opposite applies for short/bearish conditions.
-Support/Resistance Module
To further add to our suite we added a support and resistance module. This works great in combination with our Buy/Sell signals. If a buy signal prints right before a major resistance (indicated in red), then it may be a week signal. However, if it prints right above a support(indicated in purple), it is usually a strong signal.
-HA Candle Module
Sometimes HA candles help to further identify a trend. This module toggles on/off a HA candle overlay on top of the standard Japanese Candlesticks .
-BBands
We find that just like with support and resistance lines, BBands can play well for Buy/Sell signal confluence. If a signal prints at the top of the outer BBands, it may be weak, where as if it prints at the bottom it may be strong.
This indicator suite is being actively developed to improve the experience for our users. All feedback is appreciated and if anyone has any questions feel free to message us!
-Bloom Trading

Simple Reversal PointThis indicator finds possible points of reversion, you can use it to stack positions and get a good average price for when the price changes direction, it is the trader responsibility to manage the position and make a profit.
-Added alerts
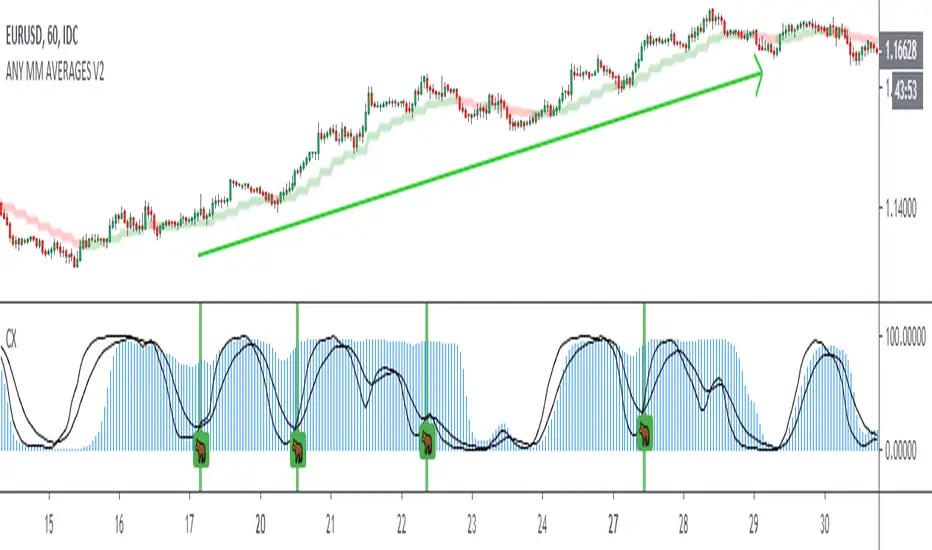
Crack XThis indicator looks for cracks (de-correlation of 2 indicators), what you have to do is simple, first look at the trend in a higher frame, there are many indicators for this, then look for cracks as wide as possible (you can configure the size in the configuration) and that they are not close to important supports / resistances. This indicator can be very useful for Swing, Coverages, to increase existing positions.The confirmation of the crack occurs when the black lines cross + bar closure.
- Added Alerts
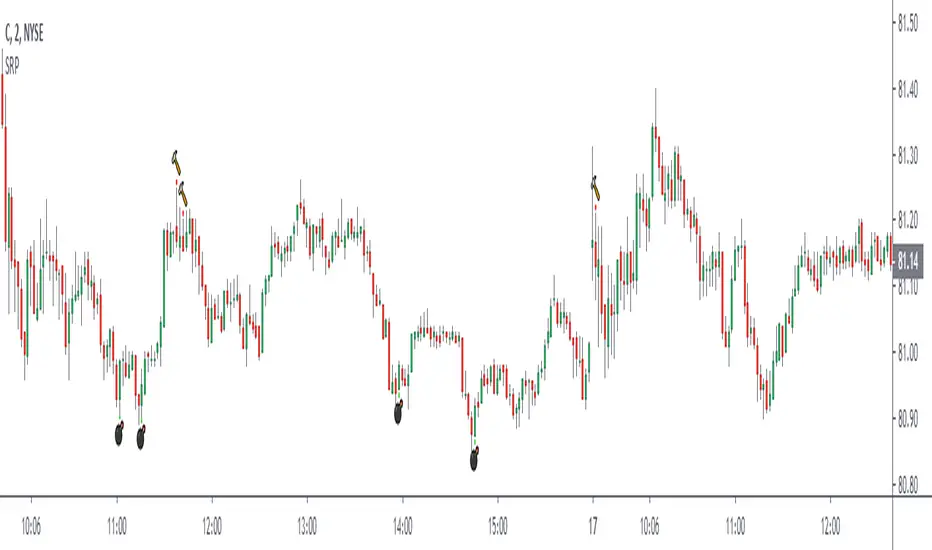
CryptoSignalScanner - Double High/Low & Engulfing IndicatorDESCRIPTION:
This script has been designed to show the double high/low candle patterns and the Engulfing candles patterns.
• This scripts is based on RSI length.
• It displays a label when a Double High or Double Low candle pattern is detected.
• It displays a label when a Bullish Engulfing or Bearish Engulfing candle pattern is detected.
• It is also possibility to set a Double High/Low, Double High, Double Low, Bullish/Bearish Engulfing, Bullish Engulfing, or Bearish Engulfing alert.
HOW TO USE:
• When a Double High signal appears it means that we have probably or temporarily stopped the uptrend and could see a reversal. Most likely we will see a downtrend from here.
• When a Double Low signal appears it means that we have probably or temporarily stopped the downtrend and probably could see a reversal. Most likely we will see an uptrend from here.
• When a Bullish Engulfing candle appears it means that we probably made a reversal to the upside. Bullish Engulfing patterns are more likely to signal reversals when they are preceded by three or more red candlesticks.
• When a Bearish Engulfing candle appears it means that we probably made a reversal to the downside. Bearish Engulfing patterns are more likely to signal reversals when they are preceded by three or more green candlesticks.
• Wait for a clear reversal to buy or to sell. Use the Fibonacci tool together with the Eliot Waves to help you with this.
FEATURES:
• You can show/hide the labels based on RSI length and high/low input values.
• You can show/hide the labels based on the % candle match.
• You can show/hide the Double High/Low labels.
• You can show/hide the Bullish/Bearish Engulfing labels.
HOW TO GET ACCESS TO THE SCRIPT:
• Use the link below to subscribe to our indicators.
REMARKS:
• This advice is NOT financial advice.
• We do not provide personal investment advice and we are not a qualified licensed investment advisor.
• All information found here, including any ideas, opinions, views, predictions, forecasts, commentaries, suggestions, or stock picks, expressed or implied herein, are for informational, entertainment or educational purposes only and should not be construed as personal investment advice.
• We will not and cannot be held liable for any actions you take as a result of anything you read here.
• We only provide this information to help you make a better decision.
• While the information provided is believed to be accurate, it may include errors or inaccuracies.
Good Luck,
The CryptoSignalScanner Team
