NYSE TickThe NYSE Tick indicator is a market breadth indicator used to determine short-term bullish or bearish market sentiment. The NYSE Tick index compares the number of stocks on the New York Stock Exchange that are ticking up to the number of stocks ticking down at a specific moment in time. When the NYSE Tick is hovering around the zero line, roughly the same number of stocks are ticking up as are ticking down. When the overall market is rising it will usually present on the NYSE Tick as a rise in value that will generally stay mostly above the zero line for a period of time. The opposite is true when the general market is falling and can be seen as the NYSE Tick staying mostly below the zero line. This information can be very helpful for a short-term day trader who trades a market that also follows many of these same stocks, like the E-Mini S&P 500 Futures (ES), for example. While the index can theoretically rise or fall to over ±2,000 if all stocks on the NYSE are ticking up or down at the same time, it’s generally considered an extreme movement if the NYSE Tick is ±1,000. For this reason, the indicator has default reference lines at ±1,000 and halfway marks at ±500. In order to partially smooth out the movement and make movement trends more easily read, the indicator plots the values using Heikin Ashi candles instead of the standard bars or candlesticks. The price-line value displayed is an accurate live value, however, rather than the OHLC average value of a standard Heikin Ashi candle. Since the standard hours for the NYSE are Monday – Friday, 09:30 – 16:00 EST, the indicator only plots bars during this time.
Sentiment-indicator

Heat Map SeasonsHeat Map Seasons indicator
Indicator offers traders a unique perspective on market dynamics by visualizing seasonal trends and deviations from typical price behavior. By blending regression analysis with a color-coded heat map, this indicator highlights periods of heightened volatility and helps identify potential shifts in market sentiment.
Summer:
In the context of the indicator, "summer" represents a period of heightened volatility and upward price momentum in the market. This is analogous to the warmer months of the year when activities are typically more vibrant and energetic. During the "summer" phase indicated by the indicator, traders may observe strong bullish trends, increased trading volumes, and larger price movements. It suggests a favorable environment for bullish strategies, such as trend following or momentum trading. However, traders should exercise caution as heightened volatility can also lead to increased risk and potential drawdowns.
Winter:
Conversely, "winter" signifies a period of decreased volatility and potentially sideways or bearish price action in the market. Similar to the colder months of the year when activities tend to slow down, the "winter" phase in the indicator suggests a quieter market environment with subdued price movements and lower trading volumes. During this phase, traders may encounter choppy price action, consolidation patterns, or even downtrends. It indicates a challenging environment for trend-following strategies and may require a more cautious approach, such as range-bound or mean-reversion trading strategies.
In summary, the "summer" and "winter" phases in the "Heat Map Seasons" indicator provide traders with valuable insights into the prevailing market sentiment and can help inform their trading decisions based on the observed levels of volatility and price momentum.
How to Use:
Watch for price bars that deviate significantly from the regression line , as these may signal potential trading opportunities.
Use the seasonal gauge to gauge the current market sentiment and adjust trading strategies accordingly.
Experiment with different settings for Length and Heat Sensitivity to customize the indicator to your trading style and preferences.
The "Heat Map Seasons" indicator can potentially identify overheated market tops and bottoms on a weekly timeframe by detecting significant deviations from the regression line and observing extreme color gradients in the heat map. Here's how it can be used for this purpose:
Observing Extreme Color Gradients:
When the market is overheated and reaches a potential top, you may observe extremely warm colors (e.g., deep red) in the heat map section of the indicator.
Traders can interpret this as a warning sign of a potential market top, indicating that bullish momentum may be reaching unsustainable levels.
Conversely, when prices deviate too far below the regression line, it may indicate oversold conditions and a potential bottom.
Potential Tops and Bottoms:
User Inputs:
Length: Determines the length of the regression analysis period.
Heat Sensitivity: Controls the sensitivity of the heat map to deviations from the regression line.
Show Regression Line: Option to display or hide the regression line on the chart
Note: This indicator is best used in conjunction with other technical analysis tools and should not be relied upon as the sole basis for trading decisions.

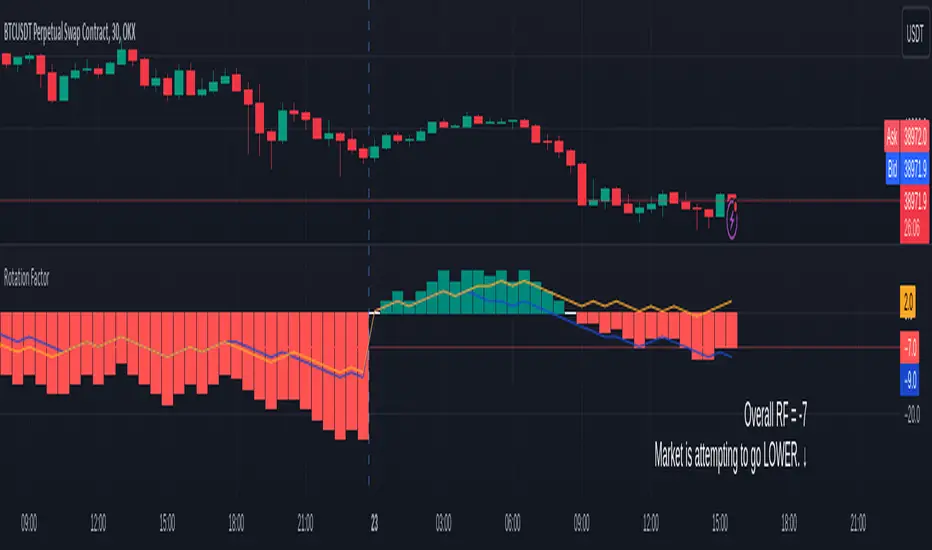
Rotation Factor for TPO and OHLC (Plot)The Rotation Factor objectively measures attempted market direction(or market sentiment) for a given period. It records the cumulative directional attempts of auction rotations within a given period, thus, helping traders determine which way the market is trying to go and which market participant is exerting greater control or influence.
Theory
The premise is that a greater number of bars auctioning higher contrasted to bars auctioning lower indicates that buyers are exerting greater control over price within the given period(usually daily). In this case, the market is attempting to go higher (Market is Bullish). The same is true for a greater number of bars auctioning lower than higher, which, in this case, indicates that the sellers are exerting greater control over price within the given period and that the market is attempting to go lower (Market is Bearish).
Calculation
Each bar is individually measured in relation to the immediate previous bar, and calculations are reset at the beginning of each period.
For every bar, two variables are utilised: One for the highs and another for the lows. During bar start, these variables are initiated at 0.
As the period progresses, these variables are set accordingly: If the high of the current bar is higher than that of the previous bar, then the bar's highs variable is assigned a "+1". If the opposite is true, it is given a "-1". Finally, if both bar highs are equal, it is, instead, assigned a "0". The same is true for the lows: if the low of the current bar is higher than that of the previous low, then the bar's lows variable is assigned a "+1". Similarly, the opposite is given a "-1", while equal lows causes it to be assigned a "0". All highs and lows are then summed together resulting to a total, which becomes the Rotational Factor.
Presentation
Furthermore, this Rotation Factor Indicator is presented as a plot, which, unlike its classic variation, shows you how the rotation factor is developing. It also includes lines indicating the Top Rotation Factor and the Bottom Rotation Factor individually, the better to observe the developing auction.
Link to the Classic Variation:
Features
1. Customisable Tick Size/Granularity : The calculation tick size/ granularity is customisable which can be accessed through the indicator settings.
2. Customisable Labels and Lines : The colour and sizes used by the labels and lines are customisable the better for accessibility.
3. Period Separator : A separator is rendered to represent period borders (start and end). If separators are already present on your chart, you can remove them from the indicator settings.
4. Individual Top Rotation Factor and Bottom Rotation Factor plots : These two parts which becomes of the Rotation Factor are also presented individually, on their own plots, the better to observe the developing auction.
Works for both split Market Profile(TPO) charts and regular OHLC bars/candle charts
The Rotation Factor is usually used with a Split Market Profile (TPO). However, if no such tool is available, you will still be able to benefit from the Rotation Factor as the price ranges of Split Market Profiles and OHLC bars/candles are one and the same. In such cases, it is recommended that you set your chart to use a 30 minute timeframe and the indicator's period to "daily" to simulate a Split Market Profile.
Note :
The Rotation Factor is, to quote, "by no means not an all-conclusive indication of future market direction.". It only helps determine which way the market is trying to go by objectively measuring the market's directional attempts.