BTC 4H Entrées/SortiesAnalysis: Input and output this script was created by ChatGPT. I allow myself to use this artificial intelligence, in order to find the most precise entry points and exit points possible in order to generate profits in complete transparency with you.
Sentiment

CandleTrack Pro | Pure Price Action Trend Detection CandleTrack Pro | Pure Price Action Trend Detection with Smart Candle Coloring
📝 Description:
CandleTrack Pro is a clean, lightweight trend-detection tool that uses only candle structure and ATR-based logic to determine market direction — no indicators, no overlays, just pure price action.
🔍 Features:
✅ Smart Candle-Based Trend Detection
Uses dynamic ATR thresholds to identify trend shifts with precision.
✅ Doji Protection Logic
Automatically filters indecision candles to avoid whipsaws and false signals.
✅ Dynamic Bull/Bear Color Coding
Bullish candles are colored green, bearish candles are colored red — see the trend instantly.
✅ No Noise, No Lag
No moving averages, no smoothing — just real-time decision-making power based on price itself.
📈 Ideal For:
Price action purists
Scalpers and intraday traders
Swing traders looking for clear visual bias
Anyone who wants a simple, no-nonsense trend indicator
📌 Follow me for more pure price action tools

RAHA Strategy - LongThe RAHA Long Strategy is based on a unique average formula called RAHA – an acronym for:
Roni's Adjusted Hybrid Average – a formula developed by Aharon Roni Pesach.
What is RAHA?
This is an adjusted hybrid average that gives different weight to outliers:
The extreme values (particularly high or low) receive a lower weight.
The calculation is based on the standard deviation and average of the data.
This results in a more sensitive but stable average that does not ignore outliers – but rather considers them in proportion.
The RAHA Long Strategy identifies a positive trend and enters when clear technical conditions are met, such as an upward slope of RAHA 40, RAHA 10 crossing above RAHA 20, and the absence of a sequence of 3 green candles.
Entry is also made in the exceptional case of a green candle below the Bollinger Band.
The position size is determined by 1% of the capital divided by the stop.
The exit is carried out by a stop below the low, or under additional conditions above the profit target (TP).
אסטרטגיית הלונג RAHA מבוססת על נוסחת ממוצע ייחודית בשם RAHA – ראשי תיבות של :
Roni's Adjusted Hybrid Average – נוסחה שפיתח אהרון רוני פסח.
מהו RAHA?
מדובר בממוצע היברידי מתואם המעניק משקל שונה לנתונים חריגים:
הערכים הקיצוניים (גבוהים או נמוכים במיוחד) מקבלים משקל נמוך יותר.
החישוב מבוסס על סטיית התקן והממוצע של הנתונים.
כך מתקבל ממוצע רגיש אך יציב יותר, שאינו מתעלם מהחריגים – אלא מתחשב בהם בפרופורציה.
אסטרטגיית הלונג RAHA מזהה מגמה חיובית ומבצעת כניסה כשמתקיימים תנאים טכניים ברורים, כמו שיפוע עולה של RAHA 40, חציית RAHA 10 מעל RAHA 20, והיעדר רצף של 3 נרות ירוקים.
הכניסה מבוצעת גם במקרה חריג של נר ירוק מתחת לרצועת בולינגר.
גודל הפוזיציה נקבע לפי 1% מההון חלקי הסטופ.
היציאה מבוצעת לפי סטופ מתחת לנמוך, או בתנאים נוספים מעל יעד הרווח (TP).


TICK ±1200 Intrabar MarkerMarks +1100 and -1200 NYSE TICK readings on any chart. Useful for TICK fades without having to look at the actual USI:TICK chart.

Better MACD📘 Better MACD – Adaptive Momentum & Divergence Suite
Better MACD is a comprehensive momentum-trend tool that evolves the traditional MACD into a multi-dimensional, divergence-aware oscillator. It leverages exponential smoothing across logarithmic rate-of-change of OHLC data, adaptive signal processing, and intelligent divergence detection logic to provide traders with earlier, smoother, and more reliable momentum signals.
This indicator is built for professional-level analysis, suitable for scalping, swing trading, and trend-following systems.
🧬 Core Concept
Unlike the classic MACD which subtracts two EMAs of price, Better MACD constructs a signal by:
Applying logarithmic transformation on the change between OHLC components (Close, High, Low, Open).
Using double EMA smoothing to filter noise and volatility, Triangular method. 1st to 2nd Smoothing.
Averaging and de-biasing the results through a custom linear regression model, 4th Smoothing.
Subtracting a fast SMA and slow SMA response to yield a dynamic MACD value, 3rd Smoothing.
The result is a smooth, adaptive, and high-resolution MACD-style oscillator that responds more naturally to trend conditions and price geometry.
🧠 Features Breakdown
1. 📈 Multi-Layer MACD Engine
Src1: Smoothed Log Rate-of-Change on Close
Src2: Smoothed Log Rate-of-Change on High
Src3: Smoothed Log Rate-of-Change on Low
Src4: Smoothed Log Rate-of-Change on Open
These are blended using highest high, lowest low, and average Close price over a configurable window for more complete trend detection. The open-based Src4 is subtracted using SMA.
2. 🧮 Signal Line
A fast EMA (signalLength) of the Better MACD value is used for crossover logic.
Crossovers of MACD and Signal line signal potential entries or exits.
3. 📊 MACD Histogram
Visualizes the difference between MACD and Signal line.
Dynamically color-coded:
Green/Light Green for bullish impulse
Red/Pink for bearish impulse
Width and color intensity reflect strength and momentum slope.
🎨 Visual Enhancements
Feature Description
✅ Ribbon Fill Optional fill between MACD and Signal line, colored by trend direction
✅ Zero-Line Background Background highlights above/below 0 to easily read bullish/bearish bias
✅ Crossover Highlights Tiny circles plotted when MACD crosses Signal line
🔍 Divergence Detection Suite
The script includes a full Divergence Engine to detect:
🔼 Bullish Regular Divergence (Price lower lows + Indicator higher lows)
🔽 Bearish Regular Divergence (Price higher highs + Indicator lower highs)
🟢 Bullish Hidden Divergence (Price higher lows + Indicator lower lows)
🔴 Bearish Hidden Divergence (Price lower highs + Indicator higher highs)
🧩 Divergence Modes:
Supports both Regular, Hidden, or Both simultaneously
Detects from either Close Price or Heikin Ashi-derived candles
Uses dynamic pivot tracking with configurable lookback and divergence sensitivity
Divergence lines are labeled, colored, and plotted in real-time
🔁 Styling & Customization:
Choose from Solid, Dashed, or Dotted line styles
Configure separate colors and widths for all divergence types
Control number of divergence lines visible or only show the most recent
Divergences update live without repainting
⚠️ Alerts
Alerts are built-in for real-time notification:
MACD Histogram reversals (rising → falling, or vice versa)
Divergence signals (all 4 types, grouped and individually)
Combines seamlessly with TradingView alerts for actionable triggers
🔧 Input Controls (Grouped by Purpose)
Better MACD Group
1st–4th Smoothing Lengths: Controls responsiveness of MACD core engine
Signal Length: Smoothness of signal line
Toggles for crossover highlights, zero cross fills, and ribbon fills
Divergence Settings
Enable/disable divergence lines
Choose divergence type (Regular, Hidden, Both)
Set confirmation requirements
Customize pivot detection and bar search depth
Styling Options
Colors, line widths, and line styles for each divergence type
Heikin Ashi Mode for smoother pivots and divergences
🧠 How to Use
✅ For Trend Traders:
Use MACD > Signal + Histogram > 0 → Bullish confirmation
MACD < Signal + Histogram < 0 → Bearish confirmation
Wait for pullbacks with hidden divergences to enter in trend direction
✅ For Reversal Traders:
Look for Regular Divergences at trend exhaustion points
Combine with price action (e.g., support/resistance or candle pattern)
✅ For Swing & Day Traders:
Enable Heikin Ashi Mode for smoother divergence pivots
Use zero line background + histogram color to time entries
📌 Summary
Feature Description
🚀 Advanced MACD Core Smoother, more reliable, multi-source-based MACD
🔍 Divergence Engine Detects 4 divergence types with pivot logic
🎯 Real-Time Alerts Alerts for histogram slope and divergences
🎛️ Deep Customization Full styling, smoothing, and detection controls
📉 Heikin Ashi Support Improved signal quality in trend-based markets

Custom EMA High/Low & SMA - [GSK-VIZAG-AP-INDIA] Custom EMA High/Low & SMA -
1. Overview
This indicator overlays a dynamic combination of Exponential Moving Averages (EMA) and Simple Moving Average (SMA) to identify momentum shifts and potential entry/exit zones. It highlights bullish or bearish conditions using color-coded SMA logic and provides visual Buy/Sell signals based on smart crossover and state-based logic.
2. Purpose / Use Case
Designed for traders who want to visually identify momentum breakouts, trend reversals, or pullback opportunities, this tool helps:
Spot high-probability buy/sell zones
Confirm price strength relative to volatility bands (EMA High/Low)
Time entries based on clean visual cues
It works well in trend-following strategies, particularly in intraday or swing setups across any liquid market (indices, stocks, crypto, etc.).
3. Key Features & Logic
✅ EMA High/Low Channel: Acts as dynamic support/resistance boundaries using 20-period EMAs on high and low prices.
✅ Timeframe-Specific SMA: A 33-period SMA calculated from a user-defined timeframe (default: 10-minute) for flexible multi-timeframe analysis.
✅ Signal Generation:
Buy: When SMA drops below EMA Low and close is above EMA High.
Sell: When SMA rises above EMA High and price closes below both EMAs.
Optionally, signals also fire based on SMA color changes (green = bullish, red = bearish).
✅ Strict or Loose Signal Logic: Choose between precise crossovers or broader state-based conditions.
✅ Debugging Tools: Optional markers for granular insight into condition logic.
4. User Inputs & Settings
Input Description
EMA High Length Period for EMA of high prices (default: 20)
EMA Low Length Period for EMA of low prices (default: 20)
SMA Length Period for Simple Moving Average (default: 33)
SMA Timeframe Timeframe for SMA (default: “10”)
Show Buy/Sell Arrows Enable visual arrow signals for Buy/Sell
Strict Signal Logic ON = crossover-based signals; OFF = state logic
Plot Signals on SMA Color Change Enable signals on SMA color shifts (Green/Red)
Show Debug Markers Plot small markers to debug condition logic
5. Visual Elements Explained
🔵 EMA High Line – Blue line marking dynamic resistance
🔴 EMA Low Line – Red line marking dynamic support
🟡 SMA Line – Color-coded based on position:
Green if SMA < EMA Low (Bullish)
Red if SMA > EMA High (Bearish)
Yellow otherwise (Neutral)
✅ BUY / SELL Labels – Displayed below or above candles on valid signals
🛠️ Debug Circles/Triangles – Help visually understand the signal logic when enabled
6. Usage Tips
Best used on 5–30 min timeframes for intraday setups or 1H+ for swing trades.
Confirm signals with volume, price action, or other confluences (like support/resistance).
Use strict mode for more accurate entries, and non-strict mode for broader trend views.
Ideal for identifying pullbacks into trend, or early reversals after volatility squeezes.
7. What Makes It Unique
Multi-timeframe SMA integrated with EMA High/Low bands
Dual signal logic (crossover + color shift)
Visually intuitive and beginner-friendly
Minimal clutter with dynamic signal labeling
Debug mode for transparency and learning
8. Alerts & Automation
The indicator includes built-in alert conditions for:
📈 Buy Alert: Triggered when a bullish condition is detected.
🔻 Sell Alert: Triggered when bearish confirmation is detected.
These alerts can be used with TradingView's alert system for real-time notifications or bot integrations.
9. Technical Concepts Used
EMA (Exponential Moving Average): Reacts faster to recent price, ideal for trend channels
SMA (Simple Moving Average): Smoother average for detecting general trend direction
Crossover Logic: Checks when SMA crosses over or under EMA levels
Color Coding: Visual signal enhancement based on relative positioning
Multi-Timeframe Analysis: SMA calculated on a custom timeframe, powerful for confirmation
10. Disclaimer
This script is for educational and informational purposes only. It is not financial advice. Always backtest thoroughly and validate on demo accounts before applying to live markets. Trading involves risk, and past performance does not guarantee future results.
11. Author Signature
📌 Indicator Name: Custom EMA High/Low & SMA -
👤 Author: GSK-VIZAG-AP-INDIA


CVD Battle Tape Strategy 🔥
⸻
🔍 What This Tool Does & How It Helps You
The CVD Battle Tape Strategy™ is a pro-level market analyzer that helps you instantly see who’s in control — buyers or sellers — and whether they’re strong or getting trapped.
It uses live Cumulative Volume Delta (CVD) and Directional Movement Index (DMI) to track aggressive buying and selling pressure, then tells you if that pressure is actually moving price or failing to.
⸻
✅ What It Gives You
• Clear Buy/Sell Control Signals – Know when real buyers or sellers are stepping in.
• Trap Detection – Spot when price moves against volume pressure (a major edge).
• Execution Bias – Real-time cues like “Lifting the Ask” or “Selling the Bid” to stay aligned.
• Live Strength Meter – CVD, Net Force, and Price Change shown in a quick-read dashboard.
⸻
🚀 Why It’s Powerful
Most traders can’t read raw order flow — this script does the heavy lifting for you.
It decodes complex volume behavior and gives you real-time insights on control shifts and sentiment changes.
Pair it with our live Discord order flow feed, and you now have two tools confirming the same story — like a radar and compass working together.
Whether you’re scalping, swinging, trading forex, futures, options, or commodities — this tool raises your decision-making to a professional level.

TradeCrafted – Custom Lines with Dynamic Trend Flow📌 TradeCrafted – Custom Lines with Dynamic Trend Flow
Smart Trend Mapping with Signal Precision
This indicator is crafted for traders who seek clarity, structure, and precision in their trend-following strategy. It dynamically maps price behavior using multiple custom-calculated trend lines that reset daily, extend into the future, and adapt live to market conditions.
🔍 Key Highlights:
⚡ Instant Buy/Sell Labels at critical moments of trend momentum shifts — ideal for intraday entries or swing confirmations.
📐 Three smooth trend lines, updated live and extended ahead, help visualize short- and mid-term directional flow.
🎨 Auto-colored candles based on unique momentum criteria make it easy to scan for strength or weakness.
🕛 Daily resetting logic ensures every session starts with fresh, unbiased trend evaluation — no carryover noise.
✅ Perfect For:
Traders who appreciate minimalist, structure-focused visual guidance.
Those who want an edge without relying on standard indicators.
Anyone looking for clean breakout signals that combine momentum and price action intelligence.
Add it to your chart and let it guide your decisions with elegant, real-time structure and high-probability signals.

TradeCrafted - Gaps in Candles Live🚀 TradeCrafted – Gaps in Candles Live
Instant Gap Detection. Real-Time Signals.
The TradeCrafted – Gaps in Candles Live indicator is a precision tool that scans your chart for true gap formations — those moments when price completely jumps above or below the previous candle, often signaling strong institutional activity or momentum shifts.
🔍 Key Features:
📈 Gap Up Alerts: Highlights when the current candle opens entirely above the previous high — a potential bullish breakout signal.
📉 Gap Down Alerts: Marks when the current candle opens entirely below the previous low — a possible bearish momentum signal.
✅ Real-Time Plotting: Gaps are detected and displayed live, with bold green and red labels for instant visibility.
🎯 Designed for all assets — stocks, indices, crypto, and forex — on any timeframe.
🧠 Why Use It?
Great for spotting momentum ignition points.
Helps identify institutional buying or selling footprints.
Ideal for gap trading strategies or opening range analysis.
Just add it to your chart and let the gaps speak for themselves — no settings, no confusion, just clarity.

TradeCrafted Buy And Sell Volume📊 TradeCrafted Buy And Sell Volume — Volume Strength with Directional Clarity
The TradeCrafted Buy And Sell Volume indicator brings smart volume analysis to your chart by breaking down total volume into buying vs. selling pressure, helping you gauge which side is in control.
🔍 What It Does:
Splits each candle’s volume into Buy Volume and Sell Volume based on where the close occurs within the candle.
Highlights strong Buy or Sell signals when volume exceeds a defined threshold and one side dominates.
Includes a Volume Moving Average for trend context.
📈 Visual Insights:
Teal bars represent Buy Volume.
Red bars represent Sell Volume.
Fuchsia line shows the smoothed Volume MA to help you compare with current volume.
✅ Ideal For:
Traders wanting directional volume clarity.
Volume-based scalpers and breakout traders.
Anyone looking to understand who's driving the market: buyers or sellers.

TradeCrafted live Zigzag Trend Lines🧠 TradeCrafted live Zigzag Trend Lines — Trend Shift Detection with Supertrend Logic
The TradeCrafted live Zigzag Trend Lines is a powerful visual indicator that connects key trend reversal points using bold, color-coded lines. It's designed to help you spot trend changes clearly and act with confidence.
🔹 Blue lines connect significant bearish-to-bullish reversals, helping you identify new uptrends.
🔸 White lines connect bullish-to-bearish reversals, signaling potential downtrends.
📈 Features:
Highlights Buy and Sell signals directly on the chart using real-time crossover
logic.
Automatically draws trend lines at key turning points — visually mapping out price structure.
Simple, no-setup interface with hardcoded settings for consistent and clean results.
Built for scalpers and swing traders looking for early trend confirmation.
✅ Great For:
Traders who love clean visuals and want to reduce noise.
Price action traders who value structure over indicators.
Anyone looking to visually follow trend shifts with minimal delay.

Economic Event Timer & Alerts [AlgoXcalibur]Stay ahead of market-moving news with this real-time event tracker and countdown alert system.
This essential algorithm displays critical scheduled events that may influence sudden spikes in market volatility, helping you stay aware and reduce exposure to unpredictable moves before they even happen. Featuring a captivating on-chart display with event titles, adjustable time zone, real-time countdowns, and live alert notifications — you’ll always know what’s ahead — so you can prepare, not react.
🧠 Algorithm Logic
The Economic Event Timer & Alerts system delivers critical market awareness through an array of integrated functions. At its core, a live countdown table provides real-time updates on the day’s scheduled economic events, with dynamic, color-coded countdowns that ensure fast and easy interpretation at a glance. Complementing the table, Countdown Alerts notify you 30 minutes, 10 minutes, and 1 minute prior to each event—giving you clear, timely reminders without the need to constantly monitor your chart. The adjustable time zone input supports ET, CT, MT, PT, or UTC, so the displayed time-of-event aligns with your trading session. Rigorously refined, the algorithm updates the table daily—and clearly displays No Scheduled Events Today to provide certainty and reassurance on days without scheduled events. Packaged in a minimalist, unobtrusive design, the tool remains visually clean and focused for serious traders.
Updated automatically for hassle-free peace of mind.
⚙️ Features
• Time Zone Selector: Easily toggle between time zones to match your trading session.
• Countdown Alerts: Enable real-time notifications to keep you informed and aware of events without having to monitor the chart.
• Update & Expiration Awareness Feature:
This innovative feature includes a simple visual and alert system that prompts you when it’s time to reload the indicator & recreate alerts — ensuring your alerts are always tied to the latest data update.
🔄 Update Available
On the final day of current event data, the indicator will:
• Display Update Available on the indicator’s table
• Send an alert at 4:00 PM ET reminding you to reload & recreate alerts
You can load the updated version anytime that day.
⛔ Expired
If not reloaded, the next day the indicator will:
• Display an EXPIRED banner on the indicator’s table
• Send a Data Expired alert every day at 8:30 AM ET that prompts you to recreate alerts, until you do or disable the alert.
This prevents missing event alerts unknowingly.
Why is this feature necessary?
Even though the indicator is updated when necessary (typically every 2–4 weeks) to provide upcoming event data automatically, TradingView alerts do not auto-update —they stay tied to the version of the script that was active when the alert was created.
This thoughtful refinement is designed to ensure your alerts remain synced to current events and ready for when it matters most.
🚨 Protect Your Capital
At AlgoXcalibur, we understand that the best way to be profitable is to avoid unnecessary risk.
Dedicated to empowering traders with insight that matters, we designed this tool to transform inconvenient economic calendars into effortless, essential information—displayed directly on your chart. Whether you’re managing open positions or timing new trades, knowing when impactful events are about to hit is crucial to being proactive, protecting capital, and trading with confidence. This is not a technical analysis indicator—this is a risk management tool that provides traders with a fundamental edge.
Built for traders who value risk management, market awareness, and algorithm automation.
🔐 To get access or learn more, visit the Author’s Instructions section.

Trend Reversal Trading Indicator🔍 What It Does
The TRTI indicator is a custom-built tool designed to identify potential trend reversals and plot buy/sell signals on the chart using adaptive volatility-based logic. Unlike basic trend indicators, TRTI recalculates dynamic upper and lower thresholds based on price action and volatility, allowing more precise signal generation.
⚙️ How It Works
Uses a custom trend reversal engine built on median price and ATR-based ranges
Tracks evolving high/low thresholds (TUp / TDown) to define trend direction
Generates 'Long' and 'Short' labels when a clean trend change is confirmed
No reliance on Pine Script’s built-in indicators - this logic is manually developed
Inputs like TRTI Trend and TRTI Swift allow users to control the signal sensitivity
✅ Why It’s Unique
Fully custom-coded trend logic - not a wrapper around built-in indicators
Designed to reduce false breakouts by confirming conditions before flipping trend
Lightweight and effective for intraday, swing, and positional strategies
Offers clean visual entries, especially useful for traders focusing on price action-based trading
⚠️ Note
No indicator is perfect or predictive. TRTI is meant to support decision-making, not replace your analysis. It helps identify potential high-probability reversal zones based on structure and volatility behavior.

ParthFintech SMART Indicator V1.0A powerful, all-in-one SMART indicator designed to identify high-probability trade setups across any timeframe. By combining break-of-structure entries with multi-timeframe trend confirmation, dynamic support & resistance, Order Block (OB) and Fair Value Gaps (FVG ) Detection, it automatically plots your entry, stop loss, and three tiered take-profit levels—and even marks them with arrows and labels so you can act at a glance.
---
A. 🔑 Key Features
1. Break of Structure (BOS) based entries: Detects fresh bullish or bearish structure breaks for precise timing.
2. Multi-Timeframe Trend Filter: Confirms 4 hour and Daily trend alignment via EMA crossover to avoid counter-trend signals.
3. Dynamic Support & Resistance Zones: Automatically captures the most recent swing highs/lows as S/R levels in the chart.
4. Multiple confluence Detection: Marks recent bullish/bearish order blocks with tiny colored squares.
5. Fair Value Gap (FVG) Zones: Highlights potential liquidity imbalance areas where price often returns.
6. Automated Risk/Reward Levels:
- Entry at the BOS candle high/low
- Stop Loss at the most recent swing low (for longs) or swing high (for shorts)
- TP1, TP2, TP3 calculated as configurable RR multiples (default 1.5×, 2×, 3×)
B. Visual Cues:
- Green arrow below the bar for long entries
- Red arrow above the bar for short entries
- Labels “ENTRY”, “SL”, “TP1”, “TP2”, “TP3” plotted at their respective price levels
- Alert-Ready: Built-in alert conditions for Entry, all three TPs and SL hits—perfect for pop-ups, emails, or webhooks (Telegram integration).
C. ⚙️ Inputs & Customization
Input Default Description
- TP1 RR 1.5 First take-profit as a multiple of risk
- TP2 RR 2.0 Second take-profit multiple
- TP3 RR 3.0 Third take-profit multiple
- Lookback S/R 20 Bars to use when calculating swing highs/lows
- Arrow Offset (pips) 10 Vertical offset for the entry arrows
- HTF 1 240 Higher timeframe #1 (4 hour)
- HTF 2 D Higher timeframe #2 (Daily)
- Customize RR targets, lookback period, arrow offset, or HF trend timeframes to match your trading style.
---
D. 🎯 How It Works
1. Trend Check – Uses 50/200 EMA on 4H & Daily to ensure you trade with the dominant market direction.
2. Structure Break – Alerts when price closes beyond the most recent swing high (bullish) or low (bearish).
3. Zone Confirmation – Plots S/R, OB, and FVG zones to help you visualize confluence.
4. Level Calculation – Automatically computes entry, stop, and three target levels based on your RR settings.
5. Visual Signals & Alerts – Draws arrows/labels on the chart and triggers alerts so you never miss a setup.
---
E. 🚀 Getting Started
To get exclusive access to ParthFintech SMART-MOVE Indicator on your Tradingview Account, text us your full Name & your Tradingview email address to: support@parth-fintech.com or telegram: @ParthFintech
visit: parth-fintech.com to learn more about our many trading tools, Automated trading bots, high probability signals , mentorship program and more.
-----
> Disclaimer: This indicator is provided for educational purposes and should be tested thoroughly in a demo environment before deploying with real capital. Always manage your risk appropriately.
ParthFintech
Also on:
Disclaimer
The information and publications are not meant to be, and do not constitute, financial, investment, trading, or other types of advice or recommendations supplied or endorsed by

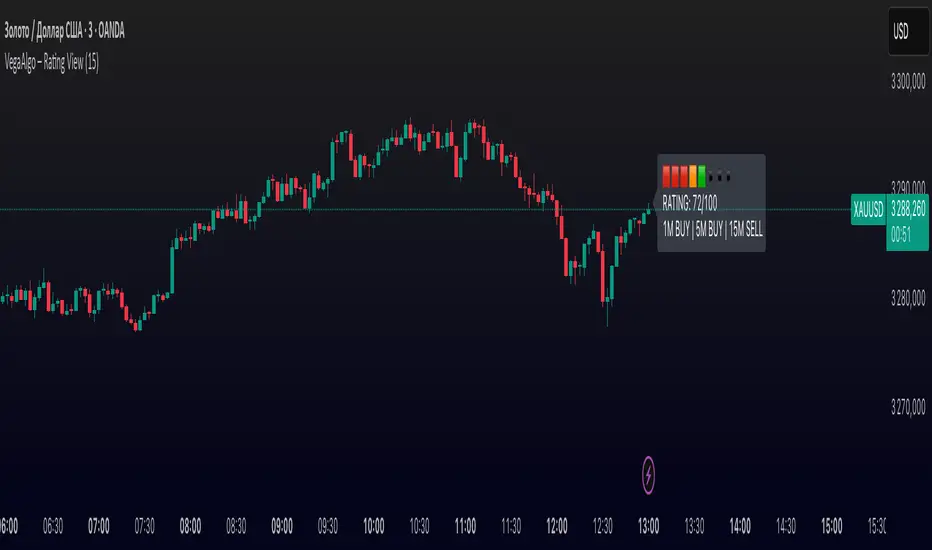
VegaAlgo – Rating ViewVegaAlgo – Rating View is a market condition analysis tool designed to evaluate the current price structure.
The indicator calculates a RATING (from 0 to 100) that reflects how clean, directional, and structured the recent price movement is. The rating is based on the number of price direction changes (from bullish to bearish candles and vice versa) within a selected period. Fewer direction changes indicate a clearer trend and result in a higher rating, while a choppy or highly volatile market leads to a lower score.
Additionally, the indicator provides directional signals on three key timeframes — 1M, 5M, and 15M, using a comparison of fast and slow moving averages. This allows traders to quickly assess the dominant trend both locally and across higher timeframes.
This script is intended for visual market analysis only and should not be considered financial advice.
Capitulation Candle Color✅ What It Does:
Candles turn bright green when the score ≥4 (i.e., multiple capitulation signals active).
Otherwise, candles keep their default coloring.
You can visually confirm extreme oversold conditions by seeing these green bars.
Moving averages and the lower Bollinger Band are displayed for context.
✅ How to Customize:
Adjust thresholds (e.g., make ATR threshold less strict).
Change the minimum score to trigger coloring (e.g., ≥3).
Use a different color (color.rgb(0,255,0) for neon green).

BTC 15M Long SwingerBTC 15M Long Swinger — Multi-Layer Trend and Momentum Confirmation Tool
Overview
BTC 15M Long Swinger is a purpose-built signal and confirmation system designed specifically for Bitcoin intraday traders operating on 15-minute charts. Its main objective is to detect high-conviction bullish setups by combining multiple independent trend engines, volatility structures, and momentum filters. By aligning these diverse dimensions, the tool aims to highlight early and mature LONG opportunities in a clean, actionable format.
What It Does
BTC 15M Long Swinger analyzes BTC price action across four core dimensions:
1. Multi-Layer Trend Detection — Uses three separate ATR-based trend engines with varying sensitivities (short, medium, long), each building dynamic support/resistance structures that adapt in real time. A valid signal requires all trend engines to transition into bullish alignment, minimizing noise and false positives.
2. Volatility Barrier Framework — Constructs ATR-based trend zones that dynamically track volatility, similar to advanced trailing stop techniques. These zones help determine whether price action has genuinely shifted trend or is experiencing a temporary retracement.
3. Momentum Confirmation — Integrates a MACD-derived momentum measure (EMA differential with smoothing) and an RSI filter to confirm whether bullish price action has sufficient strength to sustain a swing move.
4. EMA Validation Layer — Uses fast EMAs (9 and 21) to validate that price has reclaimed short-term bullish structure before signaling, preventing entries during incomplete reversals or consolidations.
How It Works
The indicator requires a strict alignment across all confirmation layers before plotting a signal:
1. All three ATR-based trend engines must transition into a bullish state (i.e., trend flips).
2. The MACD signal must be recovering from negative territory and show rising momentum.
3. RSI smoothing must remain below a defined threshold, indicating momentum reset before an upward move.
4. Price must close above both EMA9 and EMA21, ensuring reclaim of short-term bullish context.
5. Additional filters confirm the candle’s positive close and appropriate symbol/timeframe conditions (BTC pairs only, 15m chart).
Once all criteria are met, a clean BUY label is drawn beneath the bar and an alert is triggered. The signal remains active until price breaks below a dynamically placed support zone (1% below the signal low).
How To Use It
1. Confirm Context:
Always assess the higher timeframe BTC trend to avoid trading against dominant momentum. Use daily or 4-hour charts for context, and 15m chart for precise entries.
2. Act According to Signal Type:
This tool generates only Long Confirmation Signals (trend-following). Enter positions when a fresh signal appears, with a stop loss below the recent low or the dynamic support line aligned with the label position. Avoid countertrend trades when no signal is active.
3. Combine With Risk Management:
Define position sizing and stop loss before entry.
Consider trailing exits if price accelerates favorably after the signal.
Why It Is Unique
1. Multi-Engine Confirmation: Unlike single-indicator approaches, BTC 15M Long Swinger demands alignment across three ATR-based trend engines, EMA validation, and momentum filters before confirming entries.
2. Volatility-Adaptive: Dynamic ATR zones adjust to changing BTC volatility, preventing signals during choppy consolidations.
3. Early Yet Selective: Designed to identify fresh swing phases in their early stages while minimizing false positives.
4. BTC Focused: Optimized for BTC/USDT, BTC/USD, and BTC/USDC pairs in 15-minute intraday trading.
Apply Risk Management
This indicator is not a standalone trading system. Always combine signals with a structured trading plan, appropriate position sizing, and stop losses. Maintain a pre-defined risk/reward profile for each trade.
Timeframe Selection
Optimized exclusively for the 15-minute chart. Using it outside this timeframe is not recommended.
Best Suited For
Intraday BTC traders and active scalpers seeking systematic confirmation for swing long entries.
Important Notes
Signals generated by the BTC 15M Long Swinger are intended to support trading decisions. They do not constitute investment advice and do not guarantee results. Always use additional market analysis and prudent risk management practices.
License
This indicator was developed by the ProphetAlgoAI team. Its use is subject to a private, invite-only TradingView license. Redistribution or usage outside TradingView is strictly prohibited without explicit permission.

Volume Divergence & Heatmap [xdecow + MM]Usage Tips:
Use shorter MA lengths (5-10) for day trading
Increase lookback ranges (30-60) for swing trading
Combine bullish divergences with oversold conditions
Watch for bearish divergences during overbought rallies
Use heatmap colors to identify volume climaxes

Trend Reversal Strength IndicatorThis is a trend reversal strength indicator for traders who target entries at the beginning of a trend. This is was designed by a scalper for use by scalpers.

ADX > 20 and Price Rejection from 50 SMAindicator to show price rejections at 50 SMA with adx above 20

Multi SMA AnalyzerMulti SMA Analyzer with Custom SMA Table
Overview
A comprehensive Simple Moving Average (SMA) analysis tool that provides visual chart overlays, detailed data tables, and automated signal detection. Perfect for traders who rely on multiple moving averages for trend analysis and market timing.
Key Features
📊 Multiple SMA Support
7 Configurable SMAs (A through G) with default periods: 5, 20, 50, 100, 200, 21, 34
Individual show/hide toggles for each SMA
Customizable colors, line styles (solid, stepline, circles), and sources
Dynamic color coding: full opacity when price is above SMA, reduced opacity when below
⏰ Multi-Timeframe Analysis
Option to use custom timeframe for SMA calculations in the table
Chart SMAs always display on current timeframe for clean visualization
Perfect for analyzing higher timeframe trends while trading on lower timeframes
📋 Smart Data Table
Real-time SMA values and percentage distance from current price
Trend arrows (↑↓→) showing price direction relative to each SMA
Color-coded trend indicators (green/red/orange)
Bull/Bear/Sideways trend classification
Customizable position, size, colors, and transparency
🎯 Golden/Death Cross Detection
Configurable fast and slow SMA pairs
Visual alerts with customizable symbols (★ for Golden Cross, 💀 for Death Cross)
Crossover labels with adjustable size and colors
🏷️ SMA Labels
Optional labels showing SMA periods
Adjustable position (above/below/on the line)
Customizable offset, size, and colors
Only displays labels for visible SMAs
🚨 Advanced Signal Detection
Trend Analysis: Bull/Bear/Sideways classification based on price position relative to key SMAs
Volume Spike Detection: Identifies when volume exceeds 2x the 20-period average
Engulfing Pattern Recognition: Detects bullish engulfing candlestick patterns
All signals respect the custom timeframe setting
🎨 Background Color Coding
Optional background coloring based on overall trend
Bullish (green), Bearish (red), or Neutral (gray) backgrounds
Can use either chart timeframe or custom timeframe data
🔔 Built-in Alerts
SMA20/SMA50 crossovers
Golden/Death Cross events
Bull trend detection
Volume spikes
Engulfing patterns
Perfect For
Multi-timeframe traders who need to see both chart and higher timeframe SMA data
Trend followers using multiple moving averages for confirmation
Swing traders looking for comprehensive market analysis in one indicator
Position traders who want clean visual representation of long-term trends
Customization Options
Every aspect is customizable including colors, transparency, table position, label styles, signal detection toggles, and timeframe settings. The indicator is designed to work seamlessly across all markets and timeframes.
Clean, professional, and feature-rich - this indicator combines the power of multiple SMAs with modern trading analysis tools.
Enjoy!
