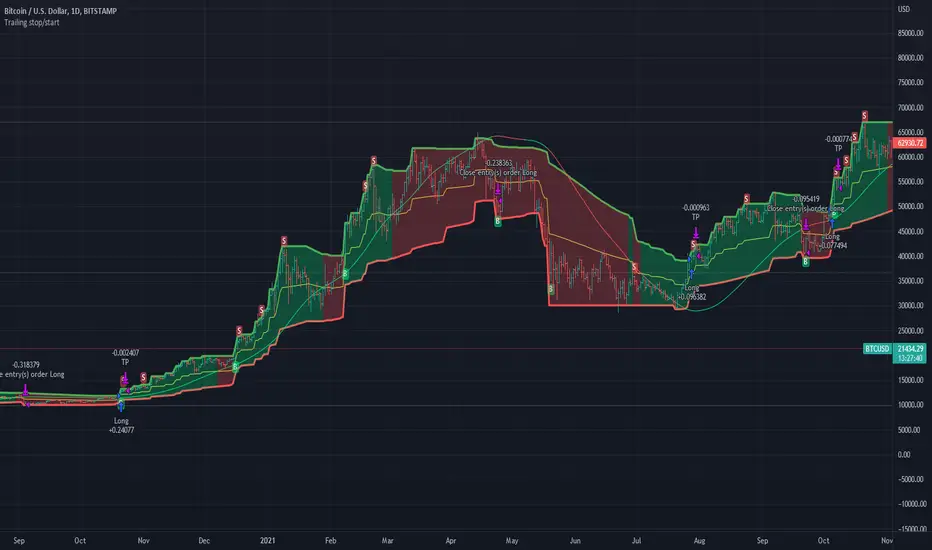
Trailing stop/startThis indicator uses a pair of dynamic volatility driven trailing stops and starts to find long and short opportunities, its designed to run on a day chart or higher but using the auto function for the trailing stop adjustment you can get a base line value to further fine tune in manual, limited testing outside of crypto but positive results found in gold, forex and stocks
Sentiment
"Sell in May, buy in September"-StrategyDear TV'ers,
This script applies the classic traders mantra of "Sell in May, buy in September". Not much else to it to be honest. Seems to work though :-).

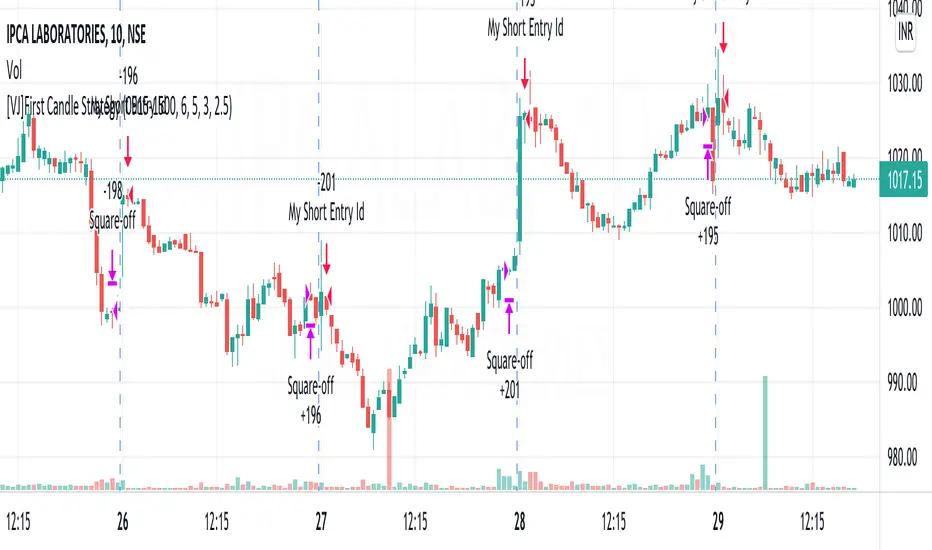
[VJ]First Candle StrategyHello Traders, this is a simple intraday strategy involving the first candle of the day with an additional twist to the traditional style . You can modify the time of candle on the stock and see what are your best picks. Comment below if you found something with good returns
Strategy: Observe the first candle of the day within any time frame. 15m works best. If the first candle is RED ,then go for buy side for the rest of the day. You could square off at close of session or have a fixed take profit and stop loss. This is a contrarian indicator where people just use this as their first entry for the day. The same holds good when a Green candle is seen you go short side.
There is stop loss and take profit that can be used to optimise your trade
The template also includes daily square off based on your time.
TICK Scalping strategy, SPY 1 min1 min chart scalping version of my other TICK strategy with adjusted parameters and additional entry and exit conditions better suited for 1 min SPY chart. Please refer to my original TICK strategy for explanation.
Important notes:
1. This strategy is designed for same day SPY option scalping on the 1 min chart . All profit shown in back testing report is based on Profit/Loss (P/L) estimates from trading options with approximately 6 weeks of data. By default, it is set to 10 option contracts. By default the initial capital is set to $5000. Pyramiding is set to 3.
2. This strategy works better with non-extended market data .
3. This strategy is mainly developed for SPY trading on 1 min chart, it probably will not be very profitable with other tickers or time frame without tweaking all the parameters first.
Cheers and enjoy~! Let's all make money~!!

TICK strategy for SPY optionsImportant notes:
1. This strategy is designed for same day SPY option scalping. All profit shown in back testing report is based on Profit/Loss (P/L) estimates from trading options with approximately 6 months of data. By default, it is set to 10 option contracts. By default the initial capital is set to $5000. Pyramiding is set to 3.
2. This strategy works better with non-extended market data.
3. This strategy is mainly developed for SPY trading on 5 min chart, it probably will not be very profitable with other tickers or time frame without tweaking all the parameters first.
4. This strategy will work with QQQ as well, but please adjust the profit multiplier to match the P/L of QQQ options.
How it works:
When trading the indices, many rely on the TICK for market directions. This strategy is a trend following strategy that uses a combination of conditions using the following indicators:
- TICK
- RSI
- VIX volatility index
- EMA
For entries, the conditions are:
1. TICK moving average crossover with a delayed signal line
2. Bullish or bearish RSI signal, RSI > 50 for bullish, < 50 for bearish
3. VIX must be above a certain threshold to take advantage of high market volatility
4. Price must be on top of EMA line for long, and below for short
For exits, there are 3 scenarios:
1. Stop loss set by a percentage of the daily ATR value
2. Trend changes on the TICK and the RSI
3. Bearish or bullish divergence on price with TICK
This strategy automatically signal to close all trades at 3:50 pm EST at the end of the day.
Extras:
- There is an option to show P/L for reinvesting profits
Enjoy~!!! Let's all make $$$

Sentiment by JDG v5.0Hi Trading View User,
First of all: Strictly use 1hr TF
This strategy uses the following indicators:
1. RSI (default and improved provided by trading view.
2. Fear and greed index
3. Slope of Fear and Greed Index( Drop over run formula)
Slope is calculated and fine tuned for every stock/coin.
All crypto coins have different slope structure / fear and greed DNA.
Slope is different for every coin/stock, this is automatically calculated by the script and optimized for best profit.
How the Fear and Greed Index is calculated
So how do they arrive at the final number? There are multiple factors that influence the ultimate output.
1. Volatility: The index compares volatility and max drawdowns (a drawdown is a decline in value) against the 30-day and 90-day average volatility and drawdown numbers. Higher volatility is considered fearful and increases the final output. Volatility represents 25% of the index value.
2. Momentum/volume: The index measures the current momentum and volume of the bitcoin market. Again, against the 30-day and 90-day averages. High volume and momentum are seen as negative metrics and increase the final index output. Momentum/ volume represents 25% of the index value.
3. Social Media: The index tracts mentions and hashtags for bitcoin , and compares them to historical averages. Higher mentions and hashtags are interpreted as increased market involvement and lead to an increase in the final index output. Social media represents 15% of the index value.
4. Surveys: The index conducts large, market-wide surveys on a weekly basis. Usually, there are 2,000-3,000 participants in each survey. More enthusiastic survey results drive the index higher, pointing to market greed prevailing. Surveys represent 15% of the index value.
5. Dominance: The index measures bitcoin dominance in the overall market. The higher the bitcoin dominance, the more fearful the market – as interpreted by the index. As alternative coins gain market share, the market is acting courageously and not fearfully. The lower the bitcoin dominance, the greedier the market is becoming. 6. 6. Dominance represents 10% of the index value.
7. Trends: The index includes Google trend numbers in the final value. The higher the search interest of cryptocurrency becomes; the higher amount of greed is seen in the market. Trends represent 10% of the index value.
For more information on Crypto Fear & Greed Index please do visit:
alternative.me
Strategy Buy Conditions:
1. Sentiment is at Extreme Fear and Fear , as this increases the price also increases.
2. Trading view RSI crossing up
Note: Wait for long signal, then enter a trade on the rocket emoji
Strategy Sell Conditions:
1. Sentiment is at Extreme Greed and Greed , as this decreases the price also decreases.
The current code/ strategy supports 55 coins from Binance for spot / futures trading.
Here are the list:
SHIBUSDT
AAVEUSDT
ADAUSDT
AKROUSDT
ALGOUSDT
ATOMUSDT
AUDIOUSDT
AVAXUSDT
AXSUSDT
BANDUSDT
BATUSDT
BLZUSDT
BTCDOMUSDTPERP
BTCUSDT
CTKUSDT
EGLDUSDT
EOSUSDT
ETHUSDT
FLMUSDT
FTMUSDT
GALAUSDT
IOTAUSDT
IOTXUSDT
KAVAUSDT
KLAYUSDT
LITUSDT
LRCUSDT
LUNAUSDT
MATICUSDT
MTLUSDT
NEARUSDT
NEOUSDT
ONTUSDT
ROSEUSDT
RUNEUSDT
SANDUSDT
SKLUSDT
SOLUSDT
THETAUSDT
WAVESUSDT
XRPUSDT
ZECUSDT
HBARUSDT
ONEUSDT
GRTUSDT
DOTUSDT
CTSIUSDT
VETUSDT
LINKUSDT
SRMUSDT
OGNUSDT
MANAUSDT
Reminding again, please use 1HR TF only when using this strategy.
Wait for long signal, then enter a trade on the rocket emoji
Message me for access.
-CodeFather

Stairs Gain Strategy - MGI will explain step by step.
1- The position order filtering option is used to filter out duplicate positions.
2- The reason I use an ATR multiplier is to balance the ATR value that differs in instruments.
3- ATR lower limit and ATR upper limit values are to reduce unnecessary transactions and commission expenses in the horizontal market.
4- Strategy take profit and stop loss levels are calculated as percentages. The reason why there is no point account is that it can be used in the stock market.
5- Developer friends can get a more efficient result in forex market instruments by converting this to a point account.
Notice :
Variables are different in each instrument. Therefore, this strategy should be optimized for each instrument used.

Follow the Crypto ShortsThis script allows to test the impact of variations in the number of BTCUSD Shorts Positions on its price. In particular, it compares the number of short positions with its moving average to decide if shorts are being liquidated. In case the number of short positions crosses below its moving average, it will generate a Long Position, which will be closed if shorts crosses above its moving average.

BTC Sentiment analysis RSI 2xEMAThis is a CRYPTO correlation strategy, which is using BTC sentiment with BITFINEX long and short ratios.
WIth them we are making from one side 2 RSI, one for long and another for short. And from another side, we are going to make multiple EMA's, using the ratios for long and short.
Rules for entry
For this scenario I created a long only strategy.
The long entry condition is : we have a crossover of the rsi long ratio with rsi short ratio and long ratio from BITFINEX is above the long EMA and short ratio from BITFINEX is below short EMA.
We exit when we get the opposite condition, in this case we have a crossunder of the rsi long ratio with rsi short ratio and long ratio from BITFINEX is below the long EMA and short ratio from BITFINEX is above short EMA.
If you have any questions, let me know !

Sentiment analysis combined with multiple MA types for CRYPTOThis is a strategy made from price action combined with multiple moving averages calculations used for the candle histograms.
In this case we calculate the bear and the bull candles based on the next criteria :
Bull candle : ((CLOSE - LOW ) + (HIGH -OPEN) / 2 ) / Candle length
Bear candle: ((HIGH - CLOSE ) + (OPEN-LOW ) / 2 ) / Candle length
Once we have the candle we use moving average to smooth the process, and then we calculate the differece between the bull ma and bear ma.
The result is going to be our histogram.
Once we have the histogram we can start setting up rules for entries and exit.
If you have any question, please let me know!

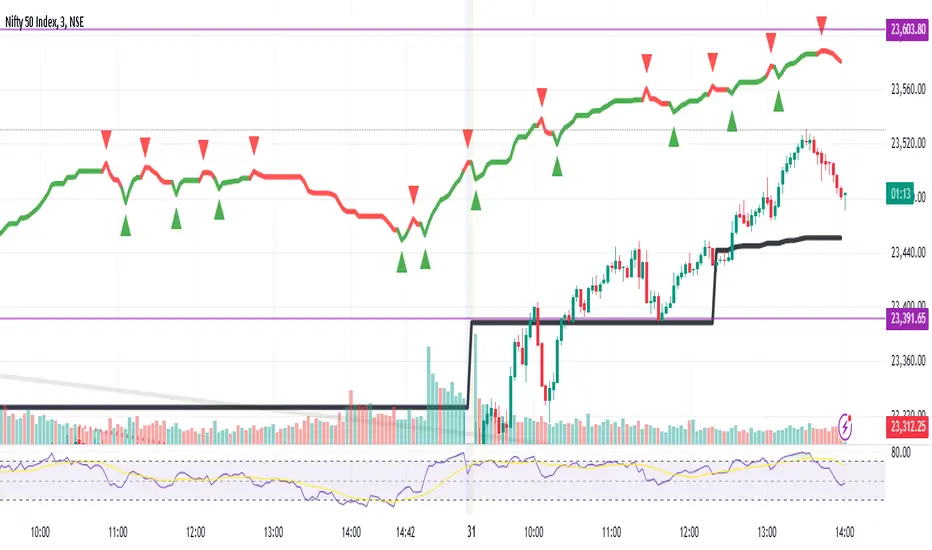
Sniper RSniper entry can be used on any time frame and is a continuous process of possible trend changing signals based on pure price action.
This script is a depiction of a change in trend and not a recommendation from the publisher. Do consult your financial advisor if you need to get into a trade. It is not a recommendation to trade and needs to be used as a reference along with other analysis that you may already be doing currently.
Sniper entry is a graphical expression in terms of a trend change based on price action only. You may want to combine this with other indicators to bring out best results as per need.
Sniper entry can be used on a multi time frame and is not limited to one trading day and can continue into the next day to depict a change in trend.
Note: This is not a recommendation of a buy or a sell but a study of most recent trends depending on time frame selected. Please do contact your financial advisor before placing the trade.
Trade smart, trade right.
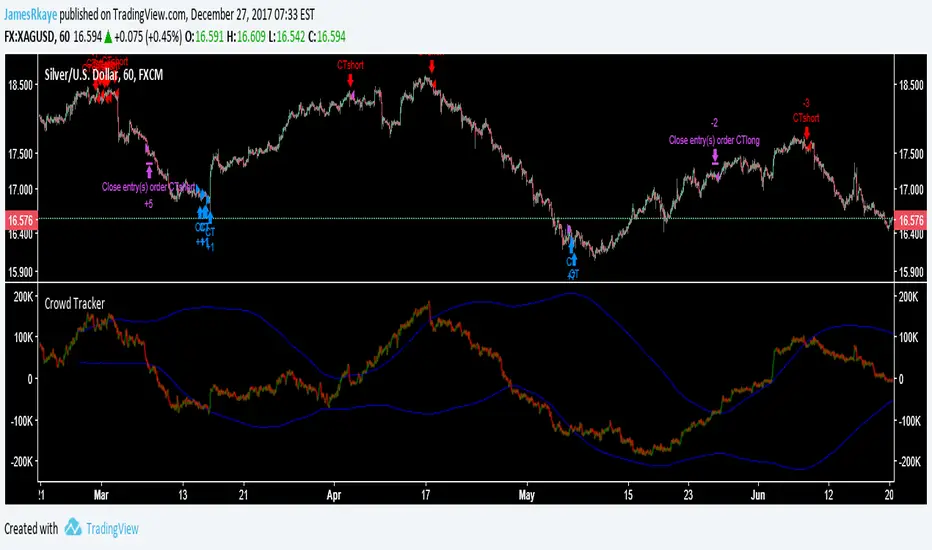
Crowd Tracker (work in progress)This indicator/strategy should be used similarly to how you would analyse sentiment data, when the crowd is bullish look to be short, when the crowd is bearish look to be long. It is also is inspired by Elliott wave, as it is looking for ending waves. The crowd tracker uses volume and price data to estimate how many people went long or short in a candle, then adds the candles over a 500 candle period together. A spike in bullishness on the indicator indicates that a bull trend may be over because ending Elliott waves, for example 5s and Cs, are when the crowd are most on board with the trend. The blue lines are a standard deviation (Bollinger Band), between these lines is where a healthy trend would be found. When the Crowd Tracker leaves and re-enters the blue lines this is a sign of a change in trader psychology, as they have reached their maximum confidence in a trend then reversed.
This is still work in progress because I want to find a better way to find the tops and bottoms of the Crowd Tracker, so it is set to invite only, after I have completed it I will probably release it in protected so follow me if you want to use it later on :) It is good at spotting entries for cryptos and stock indexes however the exits still need work.