SetSessionTimesIndiaLibrary "SetSessionTimesIndia"
This library might be useful to code an indicator or strategy that requires to call Indian trading sessions at NSE and MCX.
SetSessionTimes()
Session

Market Sessions [Kaspricci]A simple indicator to show you the opening hours of the main markets in London, New York, Tokio and Sydney. It is not shown in your main chart window and as such does not make the chart more difficult to read.
You can turn each market on and off individually and also change the start and end time, if you wish so. All based on GMT timezone, but will be translated into your local timezone.
Happy to receive your feedback.

Tradesharpe Session BiasThis script is designed for traders who want help defining their session bias it is for people who trade in sessions which will most likely be 1 4h candle. The way I trade using Price action to get my daily bias, to either look for sells or buys or both I look at the previous daily candle close and previous 4hr candle close before analyzing the structure on the lower time frames to get my session bias of bullish/bearish. so this indicator compares the daily and 4hr candles to develop a bias for example
previous daily bullish + Previous 4hr Bullish = BULLISH BIAS
previous daily Bearish + Previous 4hr Bearish = BEARISH BIAS
if Daily bullish 4hr bearish = MIXED SESSION
if daily bearish 4hr bullish = MIXED SESSION
MIXED SESSION = Can argue both buys and sells
BEARISH SESSION = Best to look for Sells only based on my trading style
BULLISH SESSION = Best to look for Buys only based on my trading style

[FrizLabz]PB OLvlsDisplay Market Open and/or Premarket Open
Labels are offset to the right of Lines
You can adjust the number of opens back to display
If you want to change the format of the label please read the tool tip
Hope you enjoy
FrizLabz

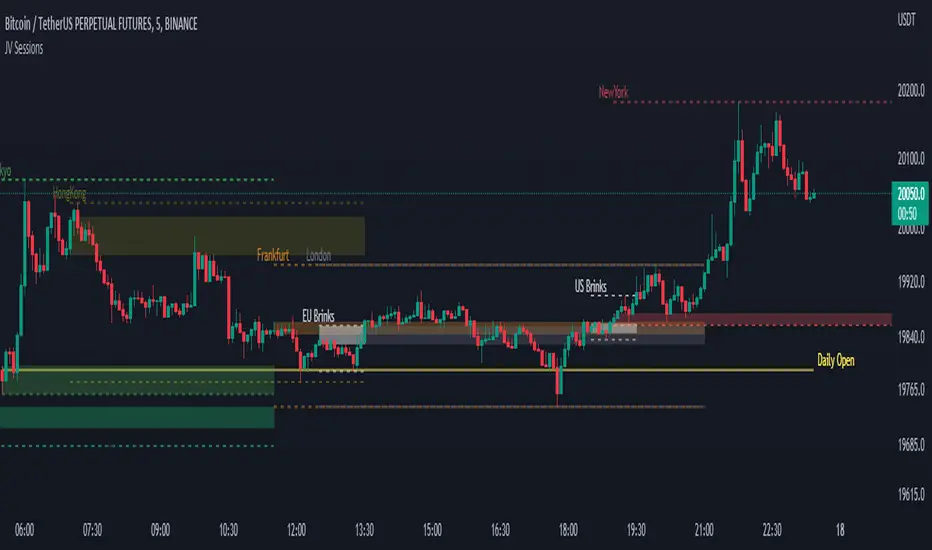
JV SessionsThis indicator serves as the Tradingview equivalent of an MT4 indicator suite.
It differentiates from existing TV indicators in its style and total feature set (most notably PVSRA and PVSRA Override)
It was originally designed for forex markets, and it will work for crypto as well, but it has not been tested on stocks.
List of Forex Market:
Market boxes (NY/JP/ HK /UK/ FR and Brinks Boxes)
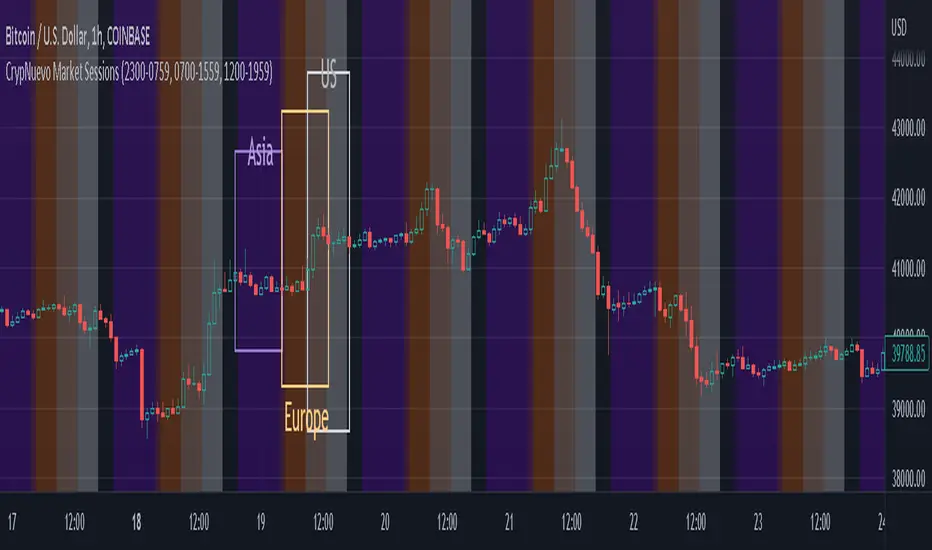
CrypNuevo Market SessionsExperimental script showing a different background color per market session. The session hours and colors can be customized. Note that the session hours can overlap.
Based on a thread by CrypNuevo on Twitter.
Exchange sessionsThe Exchange sessions indicator allows you to show world trading sessions on the chart, taking into account working hours in the corresponding time zone .
>> For traders:
The settings set the working hours of the exchange, and the indicator itself automatically binds it to the time zone of the selected exchange location - this allows you not to get confused about the correctness of the entered time ranges for any type of chart - stock, futures, index, forex or crypto. By default, the valid working hours are set and no further configuration is required.
In addition, you can select those zones that you want to highlight (using the marker to the left of the session name), and you can also highlight the beginning of each trading session - the start marker.
>> For encoders:
In the code, you can see how to set the session time and bind its control to the time zone from the IANA time zone database.
Also, in the code you will find a way to align the description of input parameters using Unicode Spaces.
I hope that my script will benefit the community and provide a quality result in my work!
All profit!
=========================================================================================
Индикатор Exchange sessions позволяет показать на графике мировые торговые сесси с учётом рабочего времени в соответствующм часовом поясе .
>> Для трейдеров:
В настройках выставляется рабочее время биржи, а индикатор сам автоматически привязывает его к часовому поясу выбранной локации биржи - это позволяет не путаться в корректности введённых временных диапазонов при любом типе графика - stock, futures, index, forex или crypto. По умолчанию задано действующее рабочее время и дополнительная настройка не требуется.
Кроме этого - можно выбирать те зоны, которые нужно подсветить (с помощью маркера слева от названия сессии), а также можно выделить начало каждой торговой сессии - маркер start.
>> Для кодеров:
В коде Вы можете посмотреть как задавать время сессии и привязать его контроль к временной зоне из базы данных часовых поясов IANA.
Также, в коде Вы найдёте способ выравнивания описания входных параметров с помощью Unicode Spaces.
Я надеюсь, что мой скрипт принесёт пользу сообществу и предоставит качественный результат в своей работе!
Всем профита!

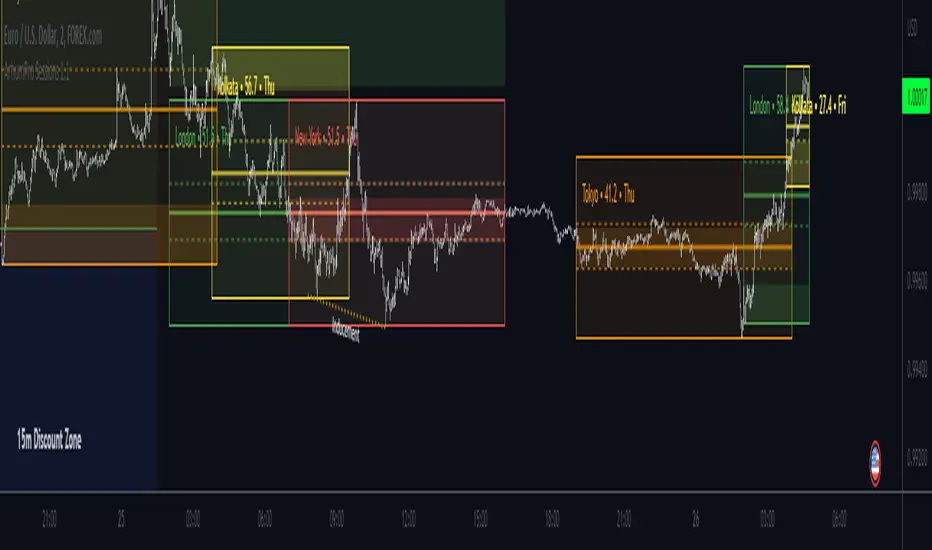
Trading Sessions [ArtiumPro]ArtiumPro Sessions is packed with tons of features and alerts to help you with your trading. It is public so enjoy it!
- History - Yes or No, No will show the most current session only.
- Pre-Sessions Range with Opening Range Breakout Alerts
- Pre-Sessions Range Can Be Listed From 15 minutes To 4 hours
- Sessions Line Style - Solid, Dash, or Dots
- Sessions Box - Default 1 Can Be Increased
- Sessions Closed Icon - Yes or No, No will show an icon on all previous sessions not active
- Pip Session Ranges
- Lookback (minutes) will color code opening range settings which you can also use for testing previous sessions ranges to help with strategies
Sessions Alerts
- Sessions Start/End
- Opening Range Breakouts
- Price Crossed Session's High/Low After Session Closed
Time Zones Supported:
- America/Los_Angeles - America/New_York - America/El_Salvador - America/Chicago - America/Argentina/Buenos_Aires
- Europe/London - Europe/Berlin - Europe/Moscow
- Asia/Dubai - Asia/Bangkok - Asia/Hong_Kong - Asia_Tokyo
- Australia/Bribane - Austalia/Sydney
- India/Kolkota
New York Session
London Sessions
Asian Sessions
Indian Sessions
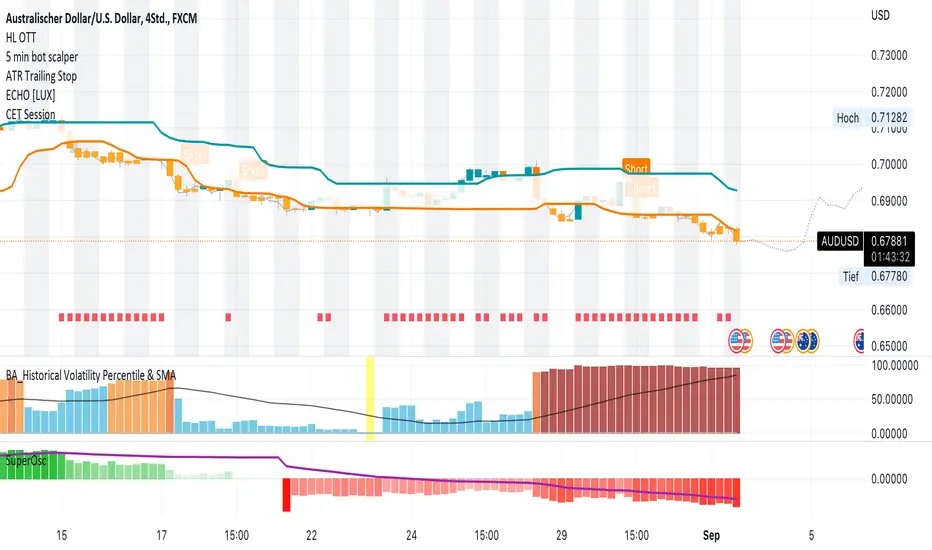
CET SessionI created a simple indicator to color the background of the chart during the respective CET timezone.
All-In-One Sessions, Weekly, Monday, Previous Highs/LowsWe are forever drawing key levels on our charts with saved drawing templates, but finding the levels, adding the labels, is all tedious stuff. We have indicators, but we have multiple different ones at a time.
What if you could just tick a box on/off?
Well now you can.
This all in one 'levels' indicator is designed to show all the key highs and lows from previous weeks, Monday, the current week, as well as an option to highlight the market sessions and their highs and lows.
There are lots of options available for extending lines and choosing their colors, so once you have set it up how you want, don't forget to save YOUR defaults.
Oorah.

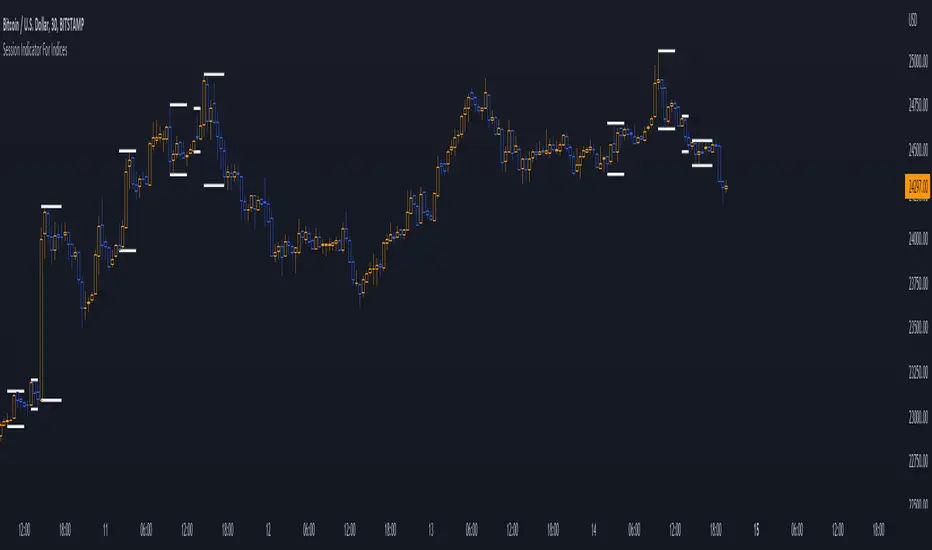
Session Indicator For Indices | @Jonas58328410Welcome guys,
I want to show you the session indicator for indices.
It is an easy, clean, and fast-loading indicator for indice sessions.
The indicator shows you the active sessions and plot those with high lines at the top and low lines at the bottom.
You can modify everything in the settings :
⚙️ Firstly you can modify the timezone, where you live to all supported timezones that tradingview has.
⚙️ Lines can be modified with "line width" and a special tool for backtesting is integrated (max lookback is 500).
⚙️ You can modify all session-related things in the last category.
⚙️ There is a Dashboard, where you can track active sessions.
❗ Note, if you change your timezone, it's recommendable to change the session settings too.
❓If you have any problems, questions, or new feature requests, please send a message in the tradingview comment section!
👌Feedback is greatly appreciated!
👾 Have fun!
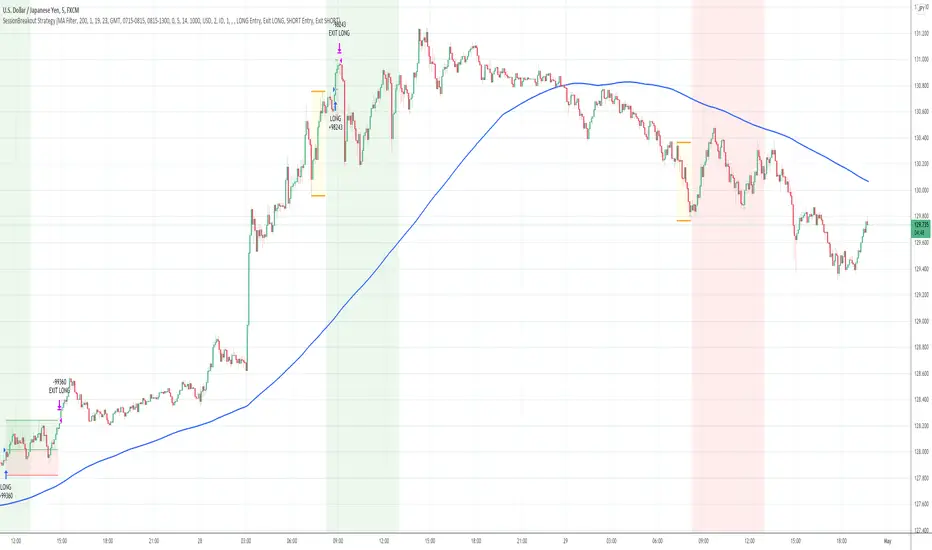
Session High Low
This indicator shows Session High Low line and prices.
1: Session range is adjustable based on your timeframe. Nomore confusing timezone settings.
You can choose your timezone then set your Session start and end time.
Script will show you the following session high and low lines which is extendable until next session.
2: All historical lines and price levels are can be partially or fully hidden.
And line colors are adjustable so you can use suitable color on your chart.
Based on session you choose this script can be used as a session break strategy AKA (Asian session break, London session break strategy).
You can create your own trading Session and high lows.
Personally I monitor how price reacts on London session high lows during the NewYork trading session.
In this chart Session starts at 8am (London open) and closes at 12:30 (NewYork open). Script is showing high lows only in this session range.
Always double confirm with your trading style. It's not a Financial advice.
Inputs:
1: Hide history - Hides all historical lines and prices that means you can see only todays session.
2: Show price - Shows price level of session high lows. You can hide price level if you want to see only lines.
3: Session time - You can set your time range of session.
4: Start time - Session start time. You can see vertical line on your chart or you can hide line.
5: End time - Session end time. You can see vertical line on your chart or you can hide line.
6: Line extend time - End of the high low lines. You can draw line until the end of the session or you can draw short line.
7: All line and price colors are optional.
Thank you.

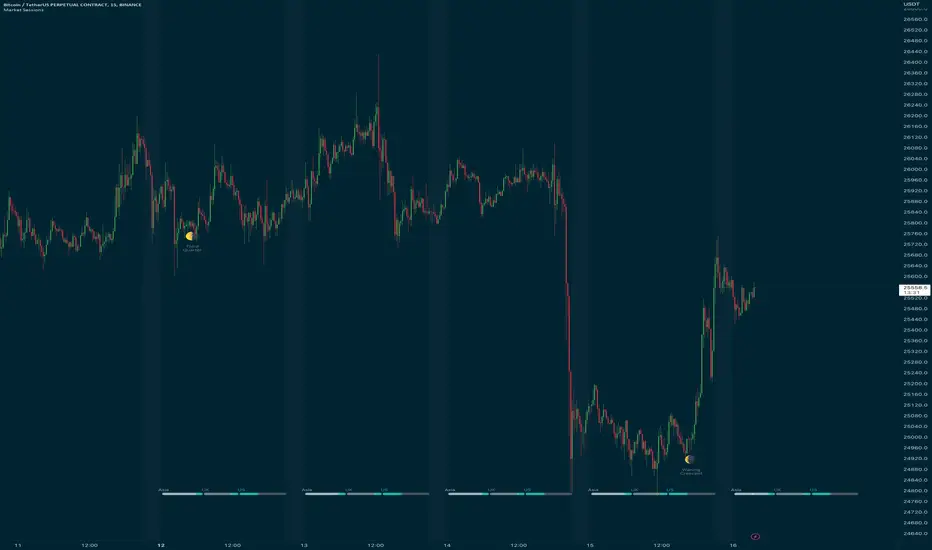
Market Session TimesThis indicator is released by the Trade Travel Chill community and uses the Trade by Design Method. It has the following features:
Pre-defined alerts
Moon Cycles
Asian, UK and US Market open times visual indicators
Trading day visual separator
All these features are highly customisable and configurable.
Fx Session RangeHello traders ,as you know the session timing plays a major role in trade execution.
I was searching for a good session indicator for a very long time but I was not satisfied with the indicators which are already available on Trading view. So I decided to code one my self.
This indicator is based on the timing provided by the website www.forex.timezoneconverter.com and time is set according to Ney York time zone.
I have added almost all major sessions including (Sydney , Tokyo and Frankfurt) and almost all features which I could.
I hope you guys 👍this indicator .
Incase you notice any bug or want any features added, let me know in comment section or you can Dm me as well.
Thank you all , enjoy :D
Hotch SessionSimple Session timer with separate session for Asia, Europe, and the Americas plus an extra custom session timer. each can be turned on and off separately.
The indicator also plots the highs and lows of each session.
This code was modified from the Session timer code found in the original "The Arty" by PheonixBinary but expanded to better include all trading sessions.
The code was written in a manner to be as compact as possible. I had looked at many other Session timers and found entire input sections that were longer than the entirety of this indicator.
Please feel free to use this code in any manner you choose permission not required.

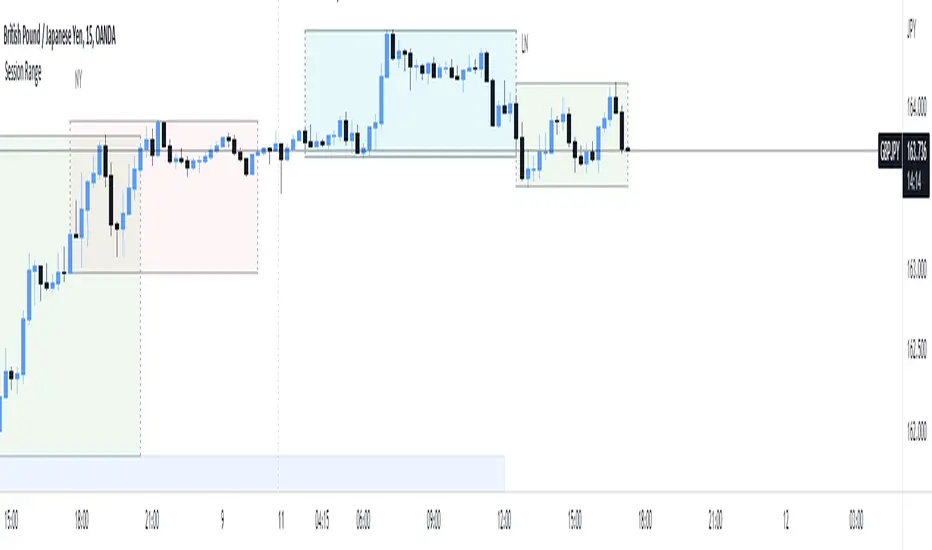
Forex Session by PThis session indicator is set according to UTC+5:30 (Kolkata, India)
L = London
N = New York
T= Tokyo
FF = Frankfurt
NYSE = New York Stock Exchange
Square in Bottom
With characters are Start of the Session
Without Characters are End of the Session specified with the color.

Intraday rejection levels3 supports, 3 resistances and an equilibrium price per day displayed at 9am (GMT+2), calculated on the dynamic study of the market at its opening over a certain period that we could qualify as "first opening interventions"
Method: We are interested in the first reaction of the market when it discovers one of the levels.
The red and green zones (from levels R2 to R3) are the zones of rejections/daily overextensions with large RRs of which we will appreciate a rejection for the US opening (where the zones are more opaque, the Killzone!), because the session US is known to either accompany the London session or completely break the trend.
Equilibrium, on the other hand, is a retest zone that can be traded in several directions, ideal for capturing the first retracement / retest of a recently broken structure:
Activate "EL" to display an ideally early morning rejection area so levels can be scalped! They correspond to opportunistic areas above the high and below the low of a custom Asian session ignoring part of the London open - which I consider to be liquidity :):
FIRST SETUP: Confluence R1/R2 with the EL!
SECOND SETUP: The price does not frequent the R2/R3 zone during London but only during the killzone:
Anticipate rejection zones, put them in confluence to find the best opportunity!
Tips:
I'm only interested in the first reaction on these levels
You can measure the difference between R1 and EQ: on average on the EURUSD it must be 20 to 30 pips! Apart from these values, I deduce that the market is unbalanced: I lower my risk on my scalps and I am more cautious.
It is possible to use the previous day's levels to look for correlations
Ideally, the Asia range Custom should not take the high/low of the day before (see "LIquidity maps" indicator on our profile for optimal use)
As an option you can display the standard pivot, and activate the "crypto" mode to be able to use it on your favorite crypto :)

Sessions & ICT Killzones (0xCryptoVince)Sessions and ICT Killzones
All in one session and killzone script for FX or Crypto markets. It includes London, New York and Asia Sessions and Killzones.
Features
Uses UTC timezone so no timezone correction needed
Includes London, New York and Asia sessions
Includes ICT killzones
Optionally include weekends for session or killzone separately
Customize line style, width and color
Customize colors for sessions and killzones
Session highs/lows displayed on chart as a line or a box
Killzones displayed on top or bottom
Session Opens - Asia, London, NY - VtrendThis script is designed to show the market session opens, for Asia, London and New York.
I couldn't find anything that fit my requirements so I decided to code one up!
You can either have symbols below, LO, AO and NYO - or background colors representing open times.. Or indeed both!
There are no alerts currently coded in, will update this one if i get enough requests.
Timeframe wise, works best under 1 hour, will not plot above that.
Also it does not plot the weekend open times.

Price Action All In One IndicatorIf you are the one who is "Price Action" style & does not want to use many indicators or complex indicators or you are an ICT (The Inner Circle Trader)
student or ICT charter, this simple beautiful All In One Indicator is right for you.
The indicator has the following functions.
TIME ZONE SETTING
The default timezone is New York Time GMT-4, if you leave the time zone setting blank, it will use the symbol timezone. Note that the trading time changes with one hour delay in winter. so if you just trade forex, and leave the time zone setting blank, TradingView will adjust the symbol timezone automatically for you or don't forget to change the timezone setting GMT-4 or GMT-5 depending on daylight saving time.
STATISTIC PANEL
You can choose which panel to show through settings.
Session Info Panel : pips info of ADR, Asian, London, and New York sessions.
Trend Panel : showing trend (up/down) of
5m/15m/1h/4h/D/W time frames (TF)
4MA (default values: SMA with lengths: 20–50–100–200)
Money Management Panel : in trading, money management is very important. Just put the % risk, & stop loss value below, the indicator will calculate a suitable size/amount for each trade.
Size by Lots: input stop loss in pips
Size by Units: input stop loss in % (of price)
(*)Units size is calculated by % stop loss & current bar close price. You have to determine a stop-loss price to convert to % stop loss by yourself.
TIME SEPARATORS
We can choose which time separators we want to display. The indicator has 5 options: Anchor Time/Day/Week/Month/Quarter. Of course, we can choose to show just one or all 5 of them.
With Anchor Time you can choose which time you want to draw a vertical line for better timing analysis. This can show up to 2 Anchor Time lines. The default values are 00:00 (New York Midnight Opening) and 08:30 (New York Session Opening). You also have an option to show the past lines or not.
About Day Separator, cause TradingView has supported Session Breaks in Setting but if you don't like to use it or when enabling, it distracts you, you can use mine. My favorite trading dates are Tuesday & Wednesday.
PRICE LEVELS
For intraday trading, the high/low/close of the previous day, the previous week, ADR (default period is 5) are very important key levels. You can choose which one you like to show for better analysis. Of course, you can change the color & style of the lines. This is also my favorite indicator.
This indicator also has an option to show up to 2 price lines at a specific time, you can choose the price type (high/low/close/open) that you want to display. The default time values are:
Specific Time 1: 0:00. (New York Midnight Opening Price)
Specific Time 2: 8:30 am. (New York Session Opening Price)
ACCUMULATION ZONE
The market tends to reprice the higher/lower to the old high/low or imbalance/fair value price to promote buy/sell stops or to provide smart money pricing for long/short entries. Typically, it redistributes quickly and you must learn to anticipate them at key levels intraday. Weak short/long holders will be squeezed in the retracement.
Except for the open price, the price changes continuously until the closing time, so the accumulation area can also be changed in real-time, but if you combine it with other information when analyzing, you can predict/determine whether the zone has been established or not with high probability. In short, price needs time to be accumulated, I usually don't pay attention to this daily zone till London open/close or New York sessions
Not only daily zone, but the indicator also supports higher timeframes accumulation zone from
SESSION & STD
There are 3 sessions: Asian, London, New York. The default values are below (New York Time).
Asian: 19:00 ~ 00:00
London Open (London KillZone): 01:00 ~ 05:00
New York Open (New York KillZone): 07:00 ~ 10:00
If you do not want to show the label, just leave the label values blank or change them to whatever you want.
This is one of my favorite functions. I use it on 15m, 30m, 1h TF for Forex intraday trading. My favorite trading sessions are London Open & New York Open.
You also can choose to show or not Standard Deviations (STD). The default values are set for Asian Range STD and max STD levels can be shown are 5. I use the following 3 types of STD (New York Time):
CBDR (Central Bank Deviations) STD: 14:00 ~ 20:00
Flout STD: 15:00 ~00:00
Asian Range STD: 19:00 ~ 00:00
LOOKBACK HIGH/LOW/MID
Can show high/low/mid of the data ranges on the daily/4h chart. The default values are:
- 20–40–60 days back from today for daily TF.
- 30–60–90 bars back from the latest bar for 4h TF.
The default anchor bar for calculating the lookback is the latest one but with:
- 4h TF: we can change the lookback from the 1st day of the week.
- Daily TF: we can change the lookback from the 1st day of the month.
The indicator also has options showing the high/low/mid (equilibrium level) lines for better analysis. Especially, on daily TF, we have the option that can show up to 4 lines (25% for each one) of the data range.
Of course, you can change the colors or the style of the high/low/mid lines.
The lookback can be shown on the lower TFs for better detection when the market structure is shifted.
MAGIC BARS
Fractal bar : The bar's color is changed when the divergence occurs between the price & RSI. You can change the RSI period (default value is 14) & RSI source. (open/high/low/close,…)
Imbalance bar or liquidity void or fair value gap - whatever you call it. This is my favorite indicator when trading on all TFs.You can choose to extend the last n imbalance bars if you like in the settings. I make sure I covered all cases of imbalance/fair value gap.
OLD HIGH/LOW
First, this function is not used as the common Support & Resistance that retail traders usually use, so I call it Old High/Low. I usually use it in 2 ways:
Detect the next buy/sell stops that Market Makers aim to manipulate.
Detect whether market structure shifted or not (Break of structure)
In settings you can:
Set the period to detect high/low levels, the default value is 10. My other favorite values are 6 & 2.
On a lower time frame, you might want to set it to a large number to remove noise.
On a higher time frame, a small number is enough, I think.
Choose the numbers of the last lines you want to show on your chart.
Of course, the style of lines can be changed easily.
TRENDLINES
A very simple trendline with default pivot left strength is 10.
By default, trendline uses high/low price but you have the "Using close price" option.
LINEAR REGRESSION CHANNEL
The Linear Regression Channel is a three-line technical indicator used to analyze the upper and lower limits of an existing trend. It is a statistical tool used to predict the future from past data and is used to determine trend direction or when prices may be overextended.
You can choose
To fill the background or not
To show inner/outer lines or not
To change the colors/line styles of upper zone, lower zone, upper lines, lower lines, midline
DIRECTION BOX
Working on all TFs, this looks like the same with lookback function but if you would like to display them in a box for easily focusing/comparing with other symbols or for detecting divergence in a specific period. The indicator also has a setting to show or hide lines connecting between lows or highs.
Another example of how I use High/Low connecting lines to detect divergence between S&P 500 and NASDAQ 100.
ZIG ZAG
Can show up to 2 ZigZag lines.
This is suitable for traders who have difficulty in detecting key levels (recent high/low) of the prices to confirm market structure or just for drawing Fibonacci easily at those levels.
MA (Moving Average)
I believe that this is one of the most used indicators for every trader. There are 5 types of MA to choose from: EMA, SMA, WMA, VWMA, SMMA(RMA).
This can show up to 4 MAs. You can choose the source (close/high/low,…) for each one. My favorite values are 34 & 89 EMA.
This indicator also supports MA Bands. You can select which MA you want to display the bands, and the "width" of the bands can be changed via the settings.
WATERMARK
It's just a simple function but I think it's very useful for those who want to add Copyright info to the chart, to prevent others from copying it.
Others/known issues/limitations
In forex or stock (things that are traded only on weekdays), TradingView's does not include the latest bars till Monday so the Day Separator cannot fill that space. Because TradingView deals with those bars as Sunday's ones so I set the color of Sunday the same as Friday for good UI/UX. On Crypto charts, the indicator shows without problems.
If you see "Internal server study error", please try closing the current TradingView tab in your browser and reopening it in a new tab. The error will disappear.
Because TradingView does not provide any detailed error information when such "general error" occurs. It's very difficult to detect which function is causing this error or is there something that caused TradingView "overloaded" through a long time running/loading on that tab? Honestly, I don't know exactly the cause, but in my experience, this error often occurs in the following cases:
When you have the TradingView Tab open for hours. In my case, I usually leave TradingView tab open overnight & when I come back the next day, this error might appear. (I'm a Mac user & I almost never shut down my Mac)
When you change settings too many times, especially settings of drawing objects like line width in a using session, it might cause this error.
So, after changing the setting or when you come back for the next trade, please save & close that TradingView tab, and then open a new one, everything will work fine.
You can see the images below that show I have tested my indicator from 1-minute time frame, enabled all functions, change every setting to max values & everything still works fine.

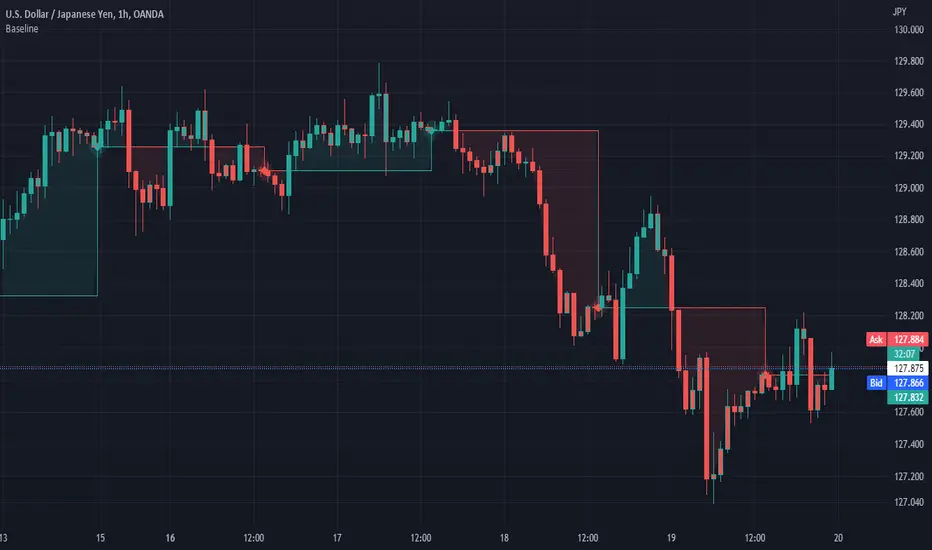
Baseline (BL)My baseline study lets you compare price to the previous days close. You can select the time frame for this baseline. I have included the ability to use a custom period length or your own anchor value. Custom anchor values are great for comparing the price to your cost average. The features I have included are bar color and background color.
I liked the idea of the 'baseline" chart but I didnt like the implementation.
Enjoy
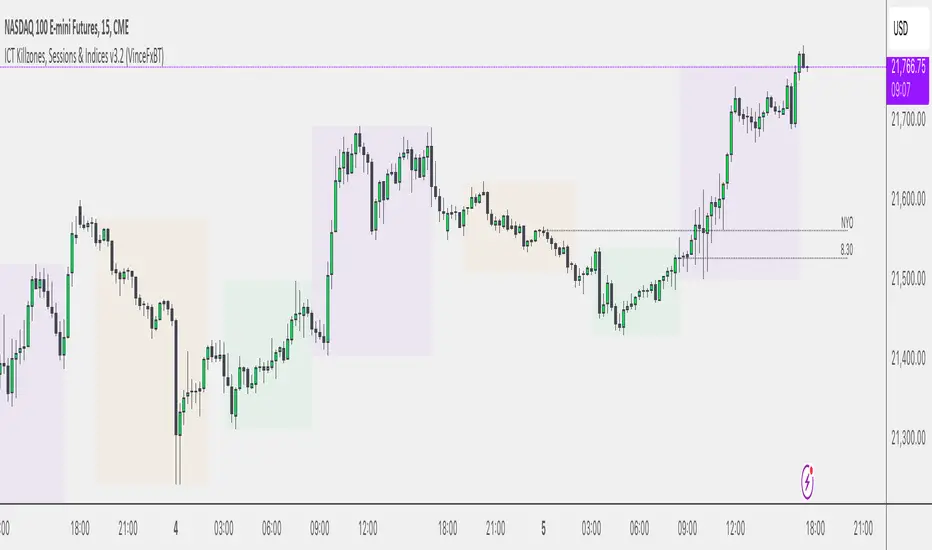
ICT Index Futures Session LinesICT Index Futures Session Lines
Description:
The script is based on one of ICT's concepts on trading Index Futures. The script lays out the daily range from an intraday basis.
Range:
00:00 - New York Midnight
08:30 – New York Open (News events come out)
12:00/13:00 - New York Lunch (No trade time period)
13:30 - (Algorithm)
16:30 - Close
* The open, high and low lines are plotted from 00:00 to 08:30
How To Use:
You will need to check the daily bias. Prior to 8:30 you are to look for previous swing points where liquidity may exist. During the open you want to see if a high or low is taken out, and then wait for an energetic break/displacement for a potential FVG/imbalance retracement entry.
Strategy is for LTF (1 to 15m)
Default time zone is set to America/New_York (UTC New York), so lines will be plotted correctly regardless of user’s local UTC chart setting.

Session Breakout Strategy [Kintsugi Trading]What is Session Breakout Strategy?
This premium indicator was inspired by my desire to find and place high probability forex trades in any market, direction, or time of day.
Why Forex?
The Forex markets operate 24 hours, 5.5 days a week
Access to meaningful leverage
Ability to easily trade long or short
High liquidity
How to use it!
----- First, start by choosing a Range Session and Trade Session. -----
- Range Session = Period of time you believe will be predictive of future price action. I like to overlay 'FX Market Sessions' by boitoki to target timeframes in which forex market sessions overlap. This period is indicative of buyers and sellers battling it out in an effort to choose a direction.
- Trade Session = Period of time you believe the price will act on the information gathered from the range session.
----- Next, we filter the Range Session by information that will help further predict price movement in the Trade Session. -----
Our tools are:
Moving Average Filter
Average RSI Filter
RSI Decision Level
None
Each parameter is customizable.
----- Next, we set our risk. -----
Enter the "stop pip size' you desire.
Enter the 'target profit pip size' you desire.
We can set out ($) dollar risk-per-trade in the inputs. The script does not know your actual account balance, so if you want to risk $100/trade you would enter '$10,000' in the account balance section and '1' in the Risk Per Trade% section.
For example, an '8' stop and an '8' tp would indicate a 1:1 risk-reward. *Note - although you may generate a higher win percent with a less favorable RR, it is rarely worth it.
----- Finally, we backtest our ideas. -----
After using the 'Strategy Tester' tab to thoroughly backtest your predictions you are ready to take it to the next level - Automated Trading!
This was my whole reason for creating the script. If you work a full-time job, live in a time zone that is hard to trade, or just don't have the patience, this will be a game-changer for you as it was for me.
Auto-Trading
When it comes to auto-trading this strategy I have included two options in the script that utilize the alert messages generated by TradingView.
*Note: Please trade on a demo account until you feel comfortable enough to use real money, and then please stick to 1%-2% of your total account value in risk per trade.*
AutoView
PineConnector
Good luck with your trading!