Improved RSI Trend Sniper | JeffreyTimmermansImproved RSI Trend Sniper
This indicator, the "Improved RSI Trend Sniper" is a sophisticated tool designed to enhance market trend analysis by integrating customizable RSI thresholds with advanced moving average options and refined visual enhancements.
Key Features
Advanced Moving Average Options:
The indicator now supports multiple moving average types: SMA, EMA, SMMA, WMA, VWMA, LSMA, HMA, and ALMA, offering greater flexibility in trend analysis.
Users can customize the moving average length for precise momentum detection.
Enhanced Momentum Detection:
Upgraded to allow dynamic calculation of momentum based on user-selected moving averages.
Conditions for bullish or bearish momentum now consider changes in the chosen moving average rather than a fixed EMA, improving accuracy.
Visual Upgrades:
A gradient-based trend fill with multiple opacity layers provides a visually appealing representation of bullish and bearish trends.
New dashboard integration displays key market information, including the ticker, timeframe, and current trend (bullish or bearish).
Improved Signal Customization:
Customizable colors and labels for bullish and bearish signals ensure easy identification on the chart.
Enhanced settings for showing or hiding labels and trend fills
Refined Alerts System:
Alerts are now generated for bullish and bearish conditions with customized messages for better responsiveness.
Alerts can be triggered once per bar close, making them more reliable.
What's New:
RSI and MA Customization: Users can define thresholds and moving average settings, providing more control over trend analysis.
Dashboard Integration: Displays real-time updates directly on the chart for improved situational awareness.
Visual Enhancements: Introduced gradient fills for trend regions, making trends more distinct.
Expanded Moving Average Options: Allows for tailored strategies using various MA calculation methods.
Alert Messaging: Streamlined notifications for actionable insights.
How It Works
Momentum Analysis:
Bullish momentum is detected when the RSI crosses above the bullish threshold and the moving average is increasing.
Bearish momentum is flagged when the RSI falls below the bearish threshold, and the moving average is decreasing.
Trend Visualization:
Bullish trends are highlighted with gradient shades of green, while bearish trends use shades of red.
Labels appear on the chart to mark key turning points.
Tailored for Different Trading Styles
The Improved RSI Trend Sniper is versatile and adaptable, catering to traders with various time horizons:
Long-Term Adjustments: For traders focusing on long-term trends, increasing the RSI length and moving average period allows the indicator to smooth out minor price fluctuations and highlight sustained momentum. Selecting slower-moving averages like the SMA or LSMA further filters out short-term noise, ensuring signals align with broader market trends.
Medium-Term Adjustments: Swing traders can use a balanced RSI length (e.g., 14–20) and a medium moving average period (e.g., 20–50) to capture actionable signals within the mid-range market cycles. The inclusion of options like EMA or SMMA ensures quicker reactions to price changes while maintaining moderate sensitivity to reversals.
Short-Term Adjustments: For day traders or scalpers, using a shorter RSI period (e.g., 7–10) alongside faster moving averages such as the HMA or ALMA can provide quicker signals for high-frequency trading. These adjustments enhance the ability to react swiftly to immediate market shifts, ideal for fast-paced trading environments.
By customizing the indicator’s settings to align with your trading timeframe, the Improved RSI Trend Sniper ensures accurate and relevant insights, empowering traders to optimize their strategies across any market condition.
Dashboard Details
Provides an at-a-glance view of market data for the current ticker and timeframe.
The Improved RSI Trend Sniper takes the original tool to the next level, offering a more comprehensive, customizable, and visually intuitive approach to market trend analysis. Perfect for traders looking to refine their strategies with actionable insights.
-Jeffrey
Short-term

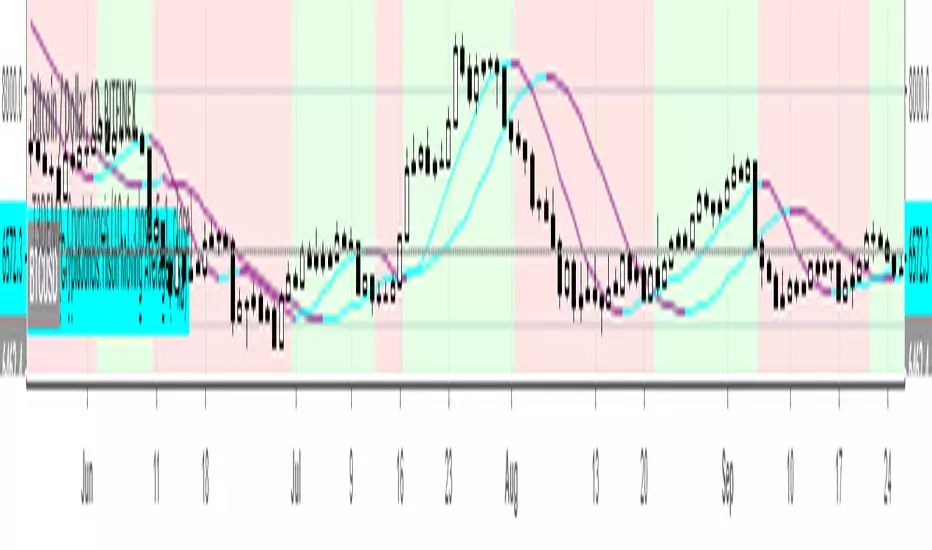
CCT - CryptoCoin TraderEnglish:
------------------
Mostly tested on Crypto Currencies
2 different usages for 2 different situations
For high volatity, use light color thick lines. Ignore the dark ones.
For standard, use dark and thick lines.Ignore the light ones.
When price bar's high hits the red line = sell
When price bar's lowhits the green line = buy
Wait for the lines keep horizontal before use it for signal.
Türkçe:
Çoğunlukla kripto para grafiklerinde test edilmiştir.
2 tip kullanımı vardır.
Volatil piyasa için açık renkli kalın çizgileri kullanın.
Normal piyasa için için koyu renkli ince çizgileri kullanın.
Fiyat barının yüksek değeri kırmızı çizgiye değdiğinde = sat
Fiyat barının düşük değeri yeşil çizgiye değdiğinde = al
Sinyal olarak kullanmak için, Çizgiler yataya bağlayana kadar bekleyin.

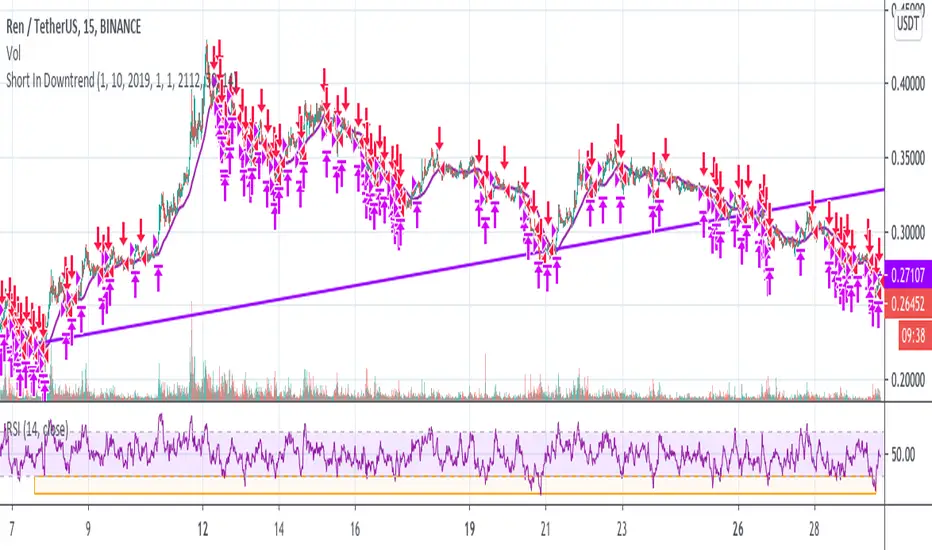
Short In Downtrend Below MA100 (Coinrule)This is a simple strategy to take advantage of downtrends. It's useful to run such a strategy as a hedge in times of market uncertainty.
The Sell Condition - Entry
The sell signal triggers when:
the coin has MA (100) greater than the price in a timeframe of 15 minutes, meaning that the coin is in a short-term downtrend.
the coin has an RSI greater than 30 in a timeframe of 15 minutes, indicating that it didn't reach oversold conditions yet, so there is still room for a further price drop.
On Coinrule, you can launch the strategy on real market conditions, setting up multiple sequential sell orders. The strategy would keep selling while the price stays below the MA(100). In that case, it's advisable to set low amounts for the sell orders. the position will grow gradually while the downtrend intensifies. Set a minimum time interval between the sell orders will also help to have control over the overall position size.
The Buy Condition - Exit
The bot connects to each trade a stop loss and a take profit. The percentages are optimized for short term trades on mid-cap coins. You can adjust the percentages depending on the specific coin you are trading. A ratio of 1:1.5 between the stop loss and the take profit could work as the strategy trades in the same direction of the trend.
Stop loss at 3% from the entry price
Take profit at 2% from the entry price
A slightly larger stop loss allows tolerating more volatility to reduce the case of stops triggering when it shouldn't.
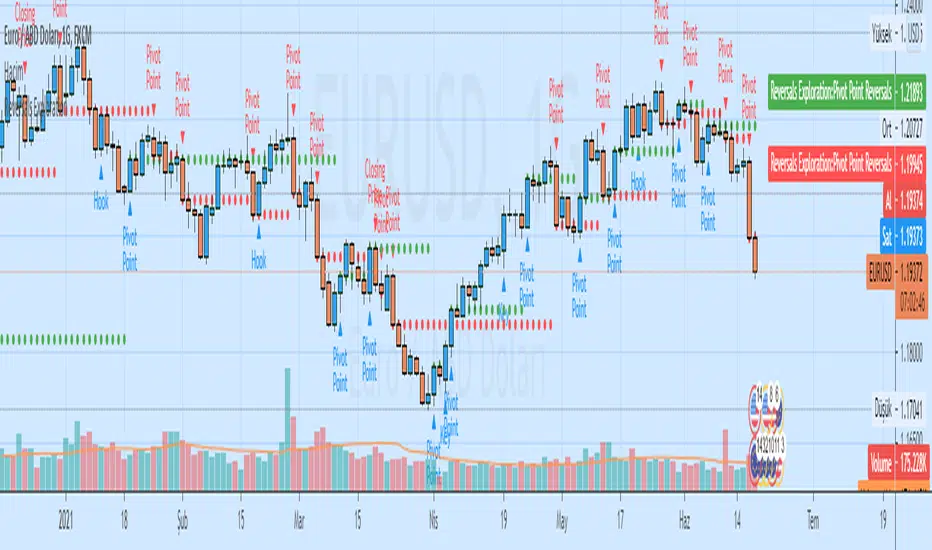
Auto Analysis Short-term Reversals ExplorationAuto Analysis Short-term Reversals Exploration
Based on a study by Larry Lovrencic
Closing Price Reversals Automatic Analysis
Hook Reversals Automatic Analysis
Island Reversals Automatic Analysis
Key Reversals Automatic Analysis
Open/Close Reversals Automatic Analysis
Pivot Point Reversals Automatic Analysis
Trend TradingThe strategy has two scripts coded in it. It uses $10,000 capital, 1 Share is the default quantity, commission of 0.0018.
As you can notice in the AMD chart,
The coded script can do four actions because there are two scripts together.
First script:
A-Buy on red bars
B-sell on green candles.
Second script:
A-buy on red background
B-sell on green background
(This is just to show you the statistics of both scripts).
The way my strategy works is there are multiple weights to gains from certain highs and lows using Fibonacci ratios.
The reason I combined both is I need to know what the trend is to avoid trading against it.
The background color tells me what the trend it.
The bar colors are for entries.
How I filter the signals:
When the background is red, then a down trend. However, my entry would be on green bars.
When the background is green, an uptrend, However, my entry would be on red bars.
The strategy can be used for multiple time frames, please test profitability rate and trade based on your judgment. The indicator is not perfect, and Your skills are important in the decision making. Do not depend solely on the indicator.
Other signals,
1-After a wide green background(uptrend). You could see one a red that could be an entry instead of a downtrend and vice versa.
2-In a wide red background, you could see green bars eventually that could be an overbought condition for a rally and vice versa.
The indicator can help you but will not trade for you. I suggest that you follow the certain conditions I have mentioned (How filter the signals).
If you are interested, please send me private message.

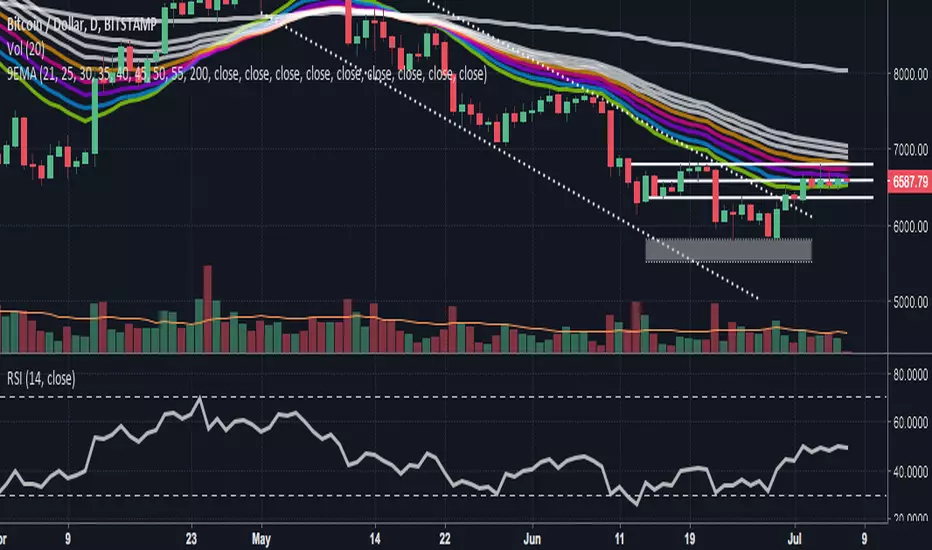
DK-Invest-Multi-Indicator-Background Color Signals-Testing OnlyThis is currently categorized as an "Invite Only" script and is being tested by a small number of users in the community. The goal is to release to the general community in the near future. The script will likely remain protected due to the amount of time invested in its development. This may change at some point in the future!
This script is unique in that it not only combines multiple indicators and multiple resolutions into a single view, but the source data is not derived directly from price. Rather it is built on a weighted point scale utilizing SMA trends and crosses spanning multiple resolutions. This point scale provides a slightly different and more predictive approach than typical indicators that are reacting to price changes.
Can be viewed with reliable buy/sell signals on any resolution from 5s to 480m. It depends only on preference and whether the goals are short-term or long-term trading.
<<< Please make sure to review Trading View's documentation regarding the use of alerts on scripts that span multiple resolutions. A reminder/warning will be generated for each new/updated alert because of this. Note: As TV explains, it's not a bug, it's just the nature of the beast when dealing with indicators that combine multiple resolutions onto a single chart. >>>
I will be adding some images of the backtesting results shortly. The script is showing some extremely good ROIs. Want to get through another round of QA testing prior to releasing results. Stay tuned.
An Alt coin version will also be added soon. BTC is a bit unique in its volume and timing of buy/sell signals, which is why there is a separate script for now.
Thank you for your understanding. Questions please add a comment. Still getting use to checking for comments, so apologies if there is a delay in responding!
DK Investments (just me right now :->)

JooNim_LS/AlertsXBTUSD _ BITMEX
SMA와 TSI를 사용해서 만든 지표입니다.
An indicator created using SMA and TSI.
비트코인 차트 15분봉 / 30분봉 / 1시간봉 / 4시간봉에서 주로 사용이 됩니다.
This use bitcoin chart in 15M / 30M / 1H / 4H
제가 설정한 2개의 값이 서로 크로스 해서 발생하게 되는 값입니다.
The two values that I set are crossed into each other.
L = 롱을 매수하는 시그널 입니다.
L = Long Signal
S = 숏을 매수하는 시그널 입니다.
S = Short Signal
반대 포지션이 뜨게되면 스위칭 및 손절을 하면 됩니다.
If the opposite position is raised, you can switch and lose.
얼러트기능을 추가하였습니다.
얼러트는 봉마감을 기준으로 설정하시면 됩니다.
You have added the Alerts feature.
You can set the Alerts based on the closing date.
언제든지 댓글을 달아주시기 바랍니다.
Please leave comments anytime.
신청하시는분 누구든지 승인해드리겠습니다.
I'll approve it to anyone who applies.
댓글이 안달리시는 분들은 저에게 메세지를 보내주십시오.
If you don't have any comments, please send me a message.
또한, 새로운 아이디어나 추가됐으면 하는 아이디어가 있다면 메세지나 댓글 주셔도 좋습니다.
Also, if you have a new idea or idea that you want to add, you can send a message or comment.

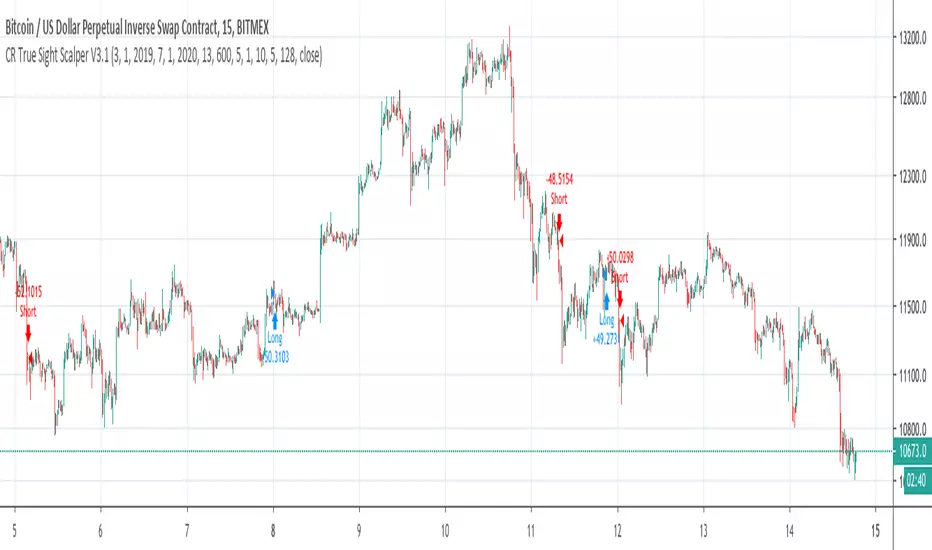
CR True Sight Scalper V3.1True Sight Scalper V3.1 is an incompatible update to V3.0, with much smaller losses.
$100,000 Initial capital.
From 2019-04-04 to 2019-07-14
CR True Sight Scalper V3.0At last, my True Sight Scalper V3.0 is here!
$100,000 Initial capital.
From 3/1/2019 to 7/3/2019.
For 2 weeks of free trial just DM me.

Hucklekiwi Pip - HLHB Trend-Catcher SystemThe strategy was authored by Hucklekiwi Pip back in 2015 and is still being updated today. She says that the system was designed to simply catch short-term forex trends. At its heart, the system is a simple EMA crossover strategy with a couple of other indicators used for confirming entries.
Strategy Rules
See her original post here:
www.babypips.com
Be sure to check out the updates and tweaks over the years!
HOW TO USE
For full information on how to use this strategy and how to correctly set the exit time, see this post:
backtest-rookies.com

Short-Term Trend MasterThis is a short-term trend-following trading strategy.
Buy when there is a moving average crossover and green background signal.
Sell when there is a moving average crossover and red background signal.
Try different timeframes to find the best one.
Cheers!

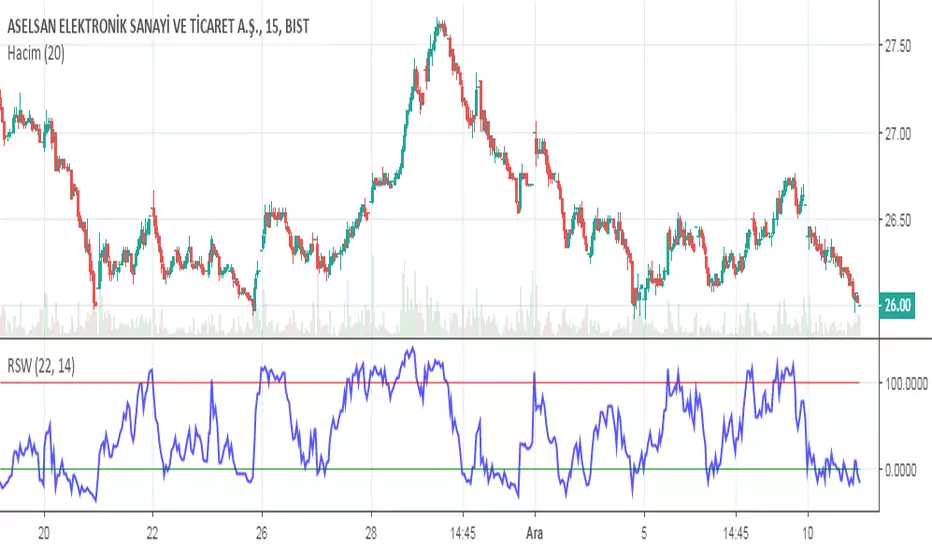
RSW - Realise Short WavesEnglish:
Works better in short term graphs, like 5mins, 15mins.
RSW aims to give you daytrading and stoploss signals.
Usage:
If crosses zero upwards: buy signal
If crosses zero downwards: stop signal
If crosses 100 upwards: buy signal
If crosses 100 downwards: sell signal
Türkçe:
Kısa vadeli grafiklerde daha verimli çalışır , mesela 5-15 dk.lık
RSW günlük al-sat-stop sinyalleri vermeyi amaçlar.
Kullanımı:
Sıfırı yukarı keserse: al sinyali
Sıfırı aşağı keserse: stop sinyali
100ü yukarı keserse: al sinyali
100ü aşağı keserse: sat sinyali
T3DMA Trend DirectionI am using T3 moving averages to generate the idea of what kind of bias I should take in a current market.
So, how does this works?
When the close is higher than T3EMA10, the trend direction is upwards,
When the close is lower than T3EMA10, the trend direction is downward.
Using this, we can assume that there is higher probability for market to continue it's trend up or down, hence trade only in that direction. T3EMA5 is used to exit any open positions before trend changes it's direction.
Have a nice day trading and enjoy.
Dumb Indicator 9 - Bitfinex Shorts X LongsThis is a way to study how the crypto market is going on Bitfinex, you can see the diference between the Long and Short terms on most popular pairs.

2EMA + 2SMAUsing EMAs allows to see whether the market is forming a trend, the 13-EMA & 48-EMA have the ability to determine a trend direction. SMAs help to identify if a trend is forming a continuation pattern, using the 100-SMA & 200-SMA, this can be seen.

2EMA + 2SMAUsing EMAs allows the ability to work out trends in the short-term, the 13-EMA & 48-EMA determine whether the market is forming specific trend. SMAs are used to identify whether a trend is in a continuation pattern, and with the help of the 100-SMA & 200-SMA, this can be seen.
Short Term StrategyMy Short Term Strategy,
works best on low time frames (3min - 5 min).
But keep an eye on low TR, as it will tend to trend too much.
As always, keep it safe.
Ciao!


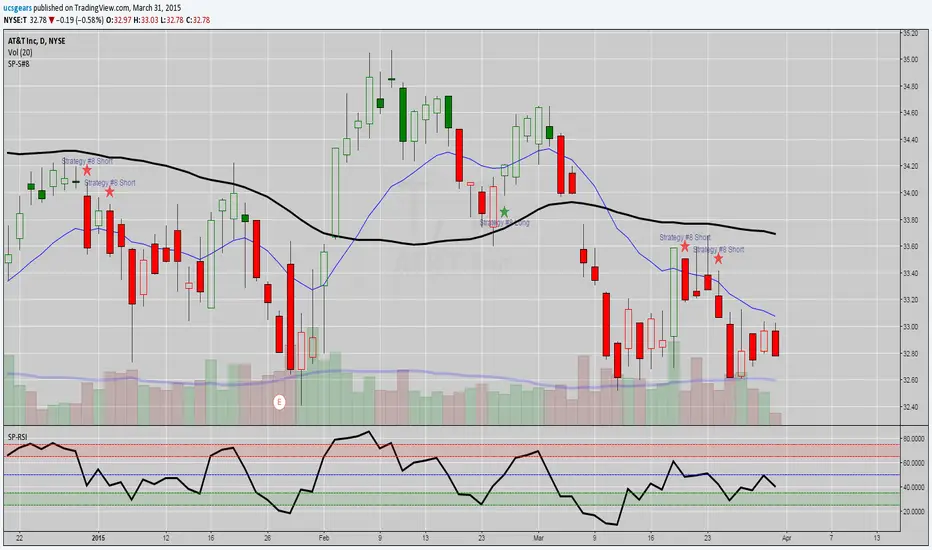
UCS_S_Steve Primo - Strategy #8Hello Fellas,
Hope you are trading fantastic and fine. Here is another setup from Steve Primo (Stocks) Setups. He claims this can be applied on any market, and you can. Primarily focused on Stocks and Futures market.
NOTE : I DID CODE THE BOTTOM INDICATOR, NOT PUBLISHING IT, ITS JUST RSI(5)
What did I change, ofcourse I don't publish what I find, There is a bit of me in the codes.....
1. Setup only shows up at meaningful levels, Stringent Filter
Myself and tradearcher will keep this upto date. As he has volenteered to help with the track record of steve primo strategies.
docs.google.com
This is more like catching a freight train after a mini pullback.
AGAIN, This is not a holy grail, but this fits my personality of trading, Buying pullbacks on stronger stocks. Because it is harder to get a UCS_momo_Oscillator to signal a setup, primarily because of the smoothing, you can use this as an alternative to catch the excitement trade.
Do not sit on it for more than T+4 days, Unless another setup triggered in your way.
Rule - Buy/Sell the candle breakout next day after the setup - in the direction it is setting up
- Close the Position @ 100% candle extension or RSI Oversold.