OnTheMoveWith this plot one is able to compare the different % change in the given time frame. It calculates the sma of a given period (defval = 7) for the close/open.
Strategy would be to choose (trade) from one to other asset in order to get higher rates when pumping or lower when dumping.
The Symbol & exchange has to be specified.
defSymbols = BTC, ETH and LINK
defExchange = BINANCE
簡單移動平均線(SMA)

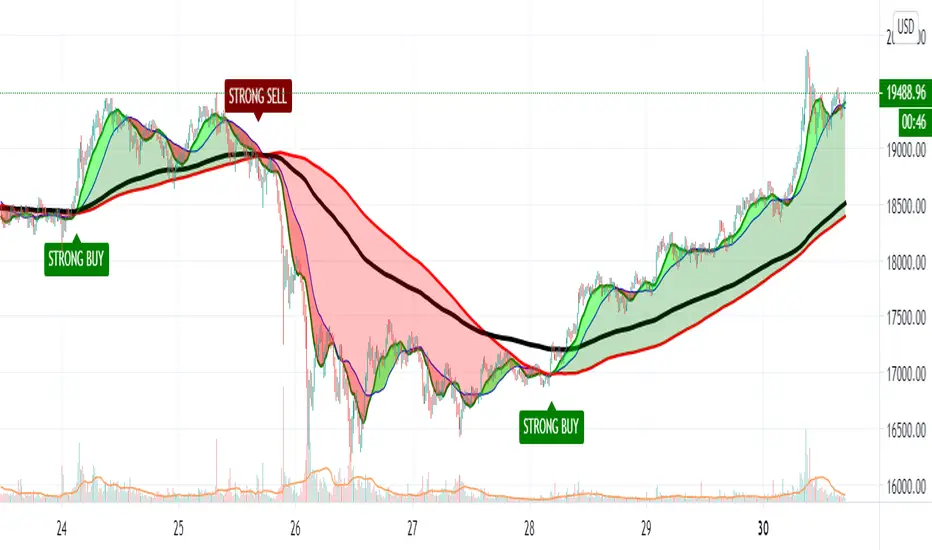
REDWOOD King Bishop MA'sREDWOOD King Bishop MA's
This indicator is based around moving averages to show short term and long term trends and possible trend reversals.
There are a lot of factors in this indicator so I will explain how best to take trades depending on your trading strategy.
Default MA settings are set and are one of the 2 recommended settings (other recommended settings are in the inputs for this indicator)
These show short term swings and changes, while coloring the fill with the short and long term trends.
Default labels show the Buy and Sell labels, along with the Strong Buy and Strong Sell labels. Buy labels should be taken as a tell that we could be reversing the trend, these labels will also allow you to get into trades earlier before a major trend change.
For the most part I recommend trading on the Strong Buy and Sell labels, these are telling you the strong trend changes that are taking affect, giving the "last call" for good entry or sell signals.
There is a long MA (Black) plot that is used as a support and resistance and when it is in the middle of the fill, this is telling you we are in the midst of the bull or bear run the indicator is showing. Times it is above or below the fast or slow MAs is taken as risky entries. you should only trade on these if other indicators are showing a reversal or entry themselves along with this indicator.
I recommend using this indicator with the RSI or MacD, specifically the REDWOOD MTF MacD or REDWOOD Stochastic RSI.
All MA fills are colored to show what is happening in the short term and also the long overall trend. A color change of the fast ma's while the overall trend is stable, lets you know of potential dips or exit positions.
There are lots of settings that you can utilize with this indicator and they are as follows..
You can customize all MA lengths
There are Scalp labels you can toggle on to show good scalp entries on both long and short sides. These are risky and only to be taken as potential exits or entries
You can toggle all labels, buy/sell, StrongBuy/StrongSell, Bullish, Bearish, Pivots, and Scalp
Pivot labels with this indicator are very risky, but can give you the best entries on a reversing market. These work best with a confirming indicator working along with these labels.
Bullish and Bearish labels show when the overall trend has crossed the support or resistance, these are good trades to take if you are swing trading or want to see or be alerted of a change of overall trend.
By default, which you can turn off, Bars are colored with the trend of the market, blocking out candles that could be opposite of the trend, reassuring a position.
---------------------
Swing Trading : Buy on Strong Buy signals and Sell on Strong Sell signals
Alternate Strategy : Buy on Bullish signals and Sell on Bearish signals
MacD or RSI or Stoch RSI confirming the trend change on these will give you the best entries and exits possible.
Scalp Trading : Buy and Sell on Scalp signals after turning them on.
Alternate Strategy : Buy when the 2 Fast Ma's cross changing the color on the fill lime, and Sell when the Fast Ma's cross and change the fill color red.
Alternate Strategy : Buy on Scalp on Buy or Sell Scalp signals and sell when Fast Ma's cross and change opposite your position, bullish or bearish.
Again, a confirming indicator will help with entries and exits.
Day Trading : Buy on Buy labels and Sell on Sell Labels
Again, a confirming indicator will help with entries and exits.
----------------------
All settings, colors, and plots can be customized, and all are labeled to make it easy for you.
Alerts for each label or trend change has been incorporated, so you never miss a trade opportunity!
This can be a very useful indicator, and I'm sure some may find settings that work even better
than the default or recommended settings.
This indicator works on all markets, forex, cryptocurrency, and stocks.
For access to this and all indicators available, please DM me here or See profile.
We are here to help each other succeed! The more one succeeds the more we all succeed! We are all in this
together and every person deserves to be financially independent and confident when taking trades
and investing.
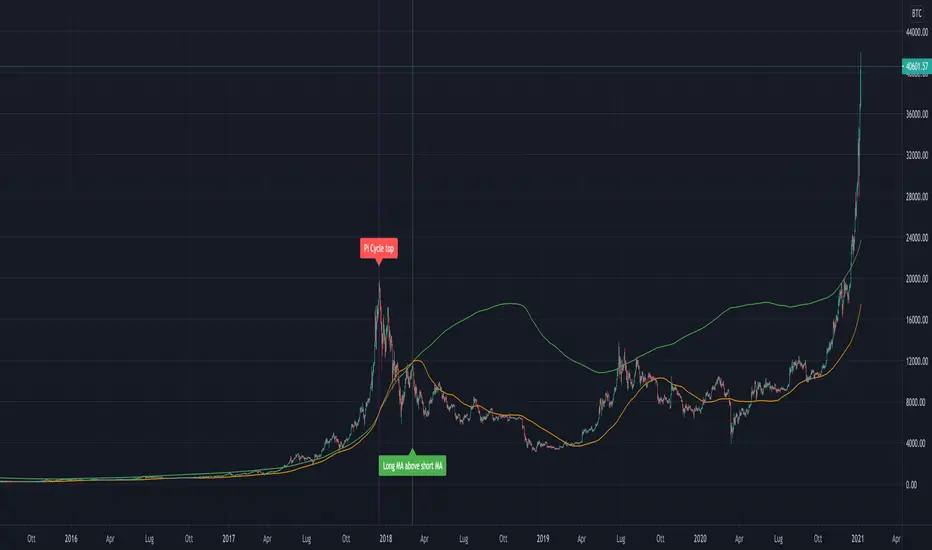
Pi Cycle Bitcoin Top IndicatorThe script implements the Pi Cycle Top indicator
This indicator identifies tops in the bitcoin market cycle. Historically, the Pi Cycle Top indicator has called out tops in the price of bitcoin within three days.
The script is very easy to use and it is possible to change the following parameters:
the time interval (default value is day);
the days of long moving average (default value is 365)
the days of short moving average (default value is 111)
show the moving average plots
show the Pi Cycle Top label highlighting the cross-point
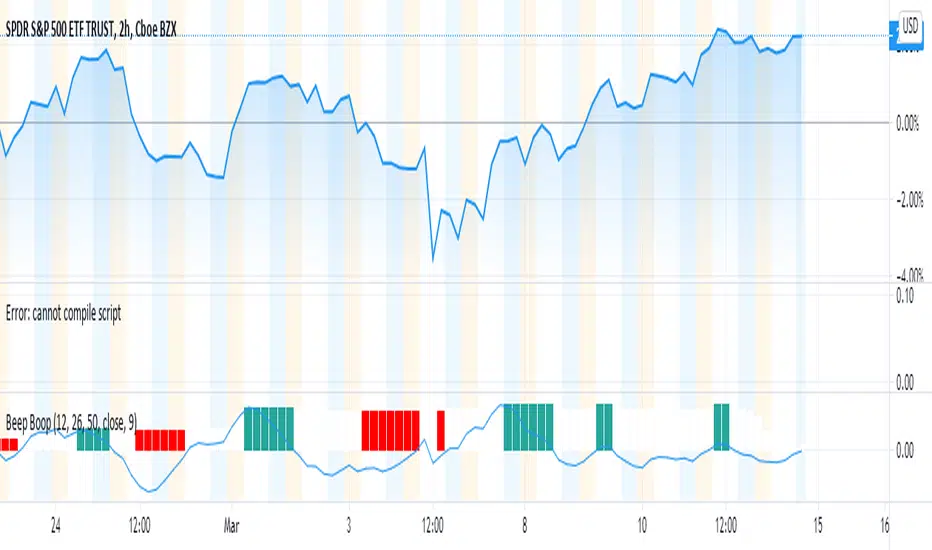
Beep Boop(Improved) Beep Boop Indicator for Trending Markets originally written by Trading Rush.
It is originally based on the MACD 12-26 and the 50 bar EMA.
The macd hist is color coded with green as buy and sell as red.
I added an option to use a couple of lower lag ema's (See line 13 - ema_signal).
Crypto EMA+MA+MACS by hobbeLeThis is an indicator that includes several EMAs and MAs (Used in Cryptotrading).
In addition, the Golden and Death Cross are also displayed.
Used MAs
MA 7 - Orange Line
MA 21 - Yellow Line
MA 25 - Grey Line
MA 99 - Blue Line
MA 200 - Green Line
Used EMAs
EMA 200 - Grey Dotted Line
EMA 222 - Pink Dotted Line
Golden Cross
Crossover MA25 + MA200
Death Cross
Crossunder MA25 + MA200
What is a Moving Average (MA) ?
A moving average (MA) is a widely used indicator in technical analysis that helps smooth out price action by filtering out the “noise” from random short-term price fluctuations.
Moving average is a trend-following, or lagging, indicator because it is based on past prices. The most common applications of moving averages are:
to identify the trend direction
to determine support and resistance levels
The two basic and commonly used moving averages are the simple moving average ( SMA ), which is the arithmetic average of a security over a defined number of time periods, and the exponential moving average ( EMA ), which gives greater weight to more recent prices.
What is a Golden Cross?
The golden cross is a candlestick pattern that is a bullish signal in which a relatively short-term moving average crosses above a long-term moving average. The golden cross is a bullish breakout pattern formed from a crossover involving a security's short-term moving average (such as the 15-day moving average) breaking above its long-term moving average (such as the 50-day moving average) or resistance level. As long-term indicators carry more weight, the golden cross indicates a bull market on the horizon and is reinforced by high trading volumes.
What Is a Death Cross?
The death cross is a technical chart pattern indicating the potential for a major selloff. The death cross appears on a chart when a stock’s short-term moving average crosses below its long-term moving average.
Source; Investopedia

Candle Body SizePlot bar size compare to SMA 50 bars back
1. Big Bar Size can be used as Support resistent level.
2. Working fine for futures market

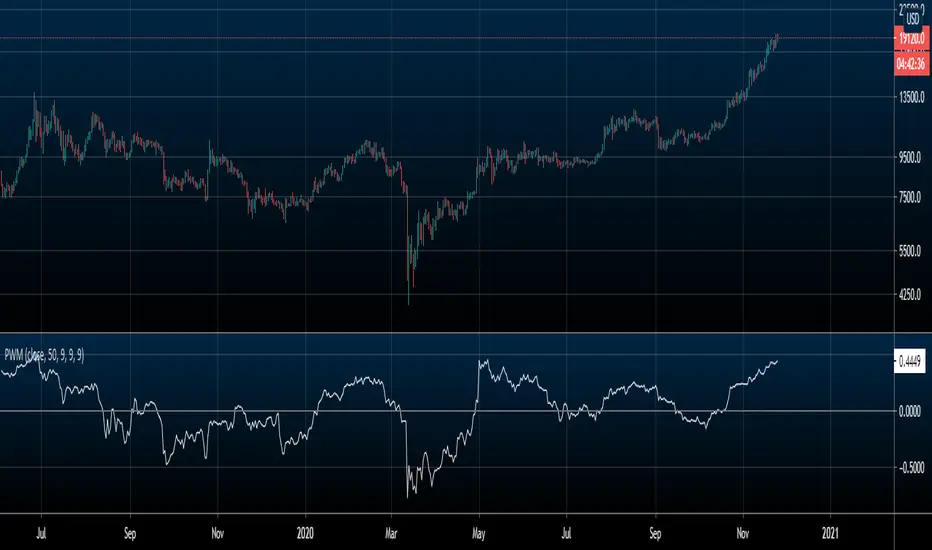
Price Weighted MomentumThis indicator is a momentum indicator that is standardized by price. A.K.A (momentum / price)
The purpose of this indicator is to compare momentum between different assets regardless of price.
EX: Bitcoin will always have more momentum than XLE because it's price is $19000 (as of writing this) compared to XLE's price of $40 (as of writing this). But if you divide the momentum by price, you get a standardized value to better compare the 2.
This indicator can be used to compare everything on TradingView.
HOW TO USE/INTERPRET
Positive values denote an uptrend
Negative values denote a downtrend
A value of 0 (or very very close to 0) denotes sideways price action
WHAT'S INCLUDED
Price Weighted Momentum (Unsmoothed by default)
Optional smoothing with either a simple or exponential moving average
Side note: I only added functionality of smoothing for EMA and SMA for my personal uses, but if you want a version of this with another way of smoothing (e.g. HMA, SSMA, etc.) that you would like, the cost of me adding that for you is a follow on Twitter. Just DM me there :)
TrendsniperTrendsniper is an indicator built with MTF / 3D capability from the seconds to the weekly chart. It uses 2 key simple moving averages for MTF; the 20 and 21 with the zone fill using the 8 21 cross. We have incorporated the sma to avoid the whipsaw factor that an ema has so one can allow to stay in a trade while the trend remains as noted on the higher time frames and visible with MTF.
The longer time frame MTF moving averages give you a picture of the overall trend allowing trader to objectively trade using them to measure potential reversals and price strength. You will see that every SMA has time designations such as "15S1M" which would mean that that specific SMA is for the local time frame of 15seconds with 1M mtf inclusion. 15M60M would mean that that SMA is for the 15M local time frame chart with 60M mtf inclusion; meaning you're able to see the 60M (60minute) SMA on your 15M (15minute) chart. The same goes for the other SMAs noted in Trendsniper.
You will also notice that moving averages function as support and resistance and MTF moving averages may clearly note that on the chart.
A simple moving average is a technical indicator that can aid in determining if an asset price will continue or if it will reverse a bull or bear trend. We have used the 8, 20, 21 SMAs in this indicator to assist one with identifying the existing trend and exiting a trade when his/her conditions as a trader are met.
MA+ADX+DMICOINBASE:BTCUSD
BINANCE:BTCUSDT
Use long and short moving average to look for a potential price in/out. (default as 14 and 7, bases on the history experience)
ADX and DMI to prevent the small volatility and tangling MA.
Test it in 4HR, "BINANCE:BTCUSDT"
From 12/1/2017- 11/1/2020 (Mixed Bull/Bear market)
Overall Profit: 560.89%
From 1/1/2018 - 1/1/2019 (Bear market)
Overall Profit: -2.19%
From 4/1/2020 - 11/1/2020 (Bull Market)
Overall Profit: 274.74%
Any suggestion is welcome to discuss.

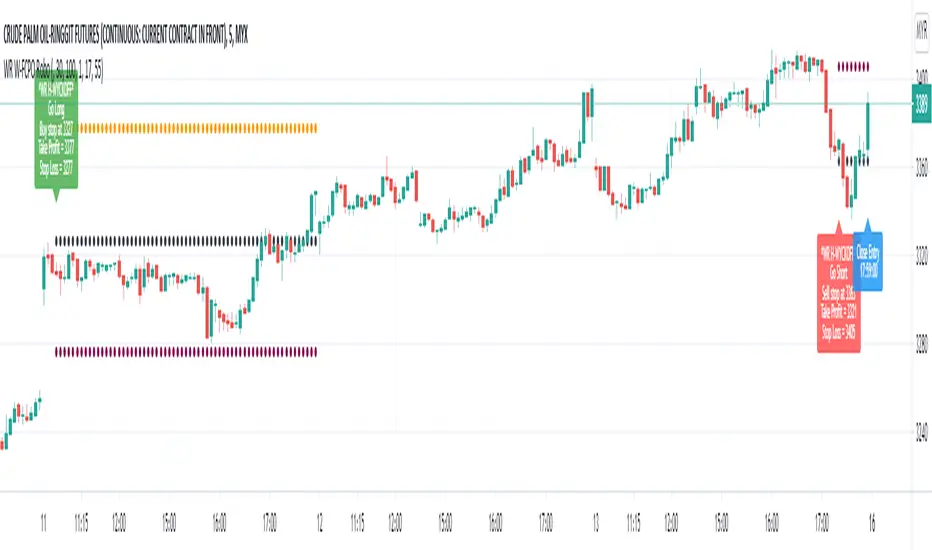
WR W-FCPO RoboFCPO trading robot is build based on one of the WR FCPO Trading Strategy.
The script will identify accumulation candle , Small candles (Min 2) inside Big Candle with Simple Moving Average (SMA) to identify trend Up or Down for Long or Short Entry condition at specific timeframe and will advice entry value and calculate advice take profit and stop loss based on % settable in the preset.
Once entry is confirm, script will popup one label with detail of Long Entry Condition or Short Entry Condition.
This is an accumulation candle being identified by the script :
This is an example of indicator produced :
This is an example of Long Entry Condition :
This is an example of Short Entry Condition :
Recommended Chart Settings:
Asset Class: FCPO Active Contract
Time Frame: 5 Minute
Long Entry Conditions:
a) Green Label with information of Buy Stop value, Take Profit Value and Stop Loss Value
b) Buy Stop value will be plot with Black Circle symbol on the chart
b) Take Profit value will be plot with Orange Cross symbol on the chart
b) Stop Loss value will be plot with Red Cross symbol on the chart
Short Entry Conditions:
a) Red Label with information of Sell Stop value, Take Profit Value and Stop Loss Value
b) Sell Stop value will be plot with Black Circle symbol on the chart
b) Take Profit value will be plot with Orange Cross symbol on the chart
b) Stop Loss value will be plot with Red Cross symbol on the chart
Take Profit and Stop Loss value can be change based on user risk management.
The entry label will appear once WR Q-Wyckoff Technique is valid (Accumulation Candle).
Exit Conditions:
a) Stop loss level is hit
b) Take profit level is hit
c) Last candle at the end of the day (at 17:59:45 or earlier)
Disclaimer:
This is a FCPO trading strategy that involves high risk of equity loss, You agree to use this script at your own risk.
If you have any suggestions, comments or interested to use this script, kindly PM us to obtain an access.
Array SMACalcuating SMA on an Array
In this script i show you how to calculate SMA on an array.
Several values are plotted just for illustration.
Steps to follow:
- make sure you have an array with values (source array)
- create a blank array (pref. with the same size)
- call the function array_sma
This function fills the empty array with the SMA values of the source array.

Easy Loot Golden CrossGolden/Death Cross Moving Average Indicator
30, 100 & 200 period Simple Moving Average (SMA).
30 = Yellow
100 = Green
200 = Black
Black crosses mark the 'golden crosses' as well as the 'death crosses'. These black crosses appear when the 30 crosses the 100 & when the 100 crosses the 200. These black crosses don't tell you when to buy/sell, but simply indicate interest in the market.
This code is open-source so feel free to add this indicator to your chart and play around with the different moving average timeframes & color schemes.
Golden Cross
The golden cross occurs when a short-term moving average crosses over a major long-term moving average to the upside and is interpreted by analysts and traders as signaling a definitive upward turn in a market. Basically, the short-term average trends up faster than the long-term average, until they cross.
There are three stages to a golden cross:
A downtrend that eventually ends as selling is depleted
A second stage where the shorter moving average crosses up through the longer moving average
Finally, the continuing uptrend, hopefully leading to higher prices
Death Cross
Conversely, a similar downside moving average crossover constitutes the death cross and is understood to signal a decisive downturn in a market. The death cross occurs when the short term average trends down and crosses the long-term average, basically going in the opposite direction of the golden cross.
The death cross preceded the economic downturns in 1929, 1938, 1974, and 2008.

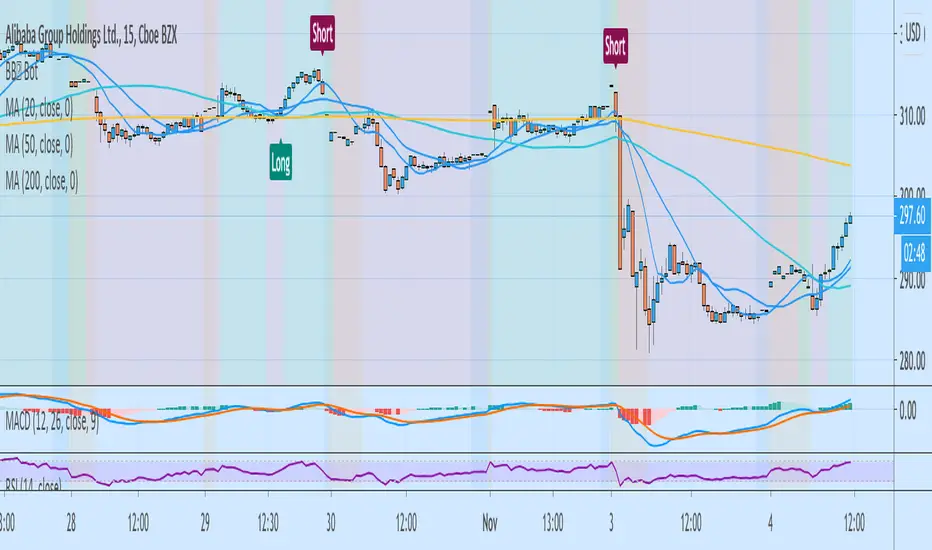
BB™ Bot V.1BB Bot, uses volatility indicators, moving averages, MACD, and other complex technical indicators alike to plot the "Bull" and "Bear" signals on the chart. BB Bot is able to plot the "Bull" and "Bear" signals for stocks, crypto, forex, and futures. Personally, I like to use this strategy for swing trades as that is my preferred trading style, although you can use this for day trades as well. This indicator was made so can automatically get notified when my technical setup has occurred on a stock that I like.
Bear and Bull alerts can be easily set to any financial asset that you prefer.
Key:
Bull - Long
Bear - Short
If you have any suggestions as to how we can improve this indicator, please provide me with some feedback. I will be releasing more indicators for different trading styles specifically for lower time frames and such.
This indicator will be updated over time to compensate for user feedback.
If you have any questions feel free to comment/dm me here on TradingView.
-------
DISCLAIMER
IT SEEMS TO WORK WELL BUT STILL NO GUARANTEE ON PERFORMANCE.
RISK WARNING
PAST PERFORMANCE IS NOT NECESSARILY INDICATIVE OF FUTURE RESULTS. TRADERS SHOULD NOT BASE THEIR DECISION ON INVESTING IN ANY TRADING PROGRAM SOLELY ON THE PAST PERFORMANCE PRESENTED, ADDITIONALLY, IN MAKING AN INVESTMENT DECISION, TRADERS MUST ALSO RELY ON THEIR OWN EXAMINATION OF THE PERSON // OR ENTITY MAKING THE TRADING DECISIONS.
Public & Pro ActionBased on Larry Williams Pro-Go logic for public and pro actions. This indicator works on all timeframes.
The public action is previous close to today's open.
The pro action is today's close to today's open.
The series is smoothened with a simple moving average.
It works best after the candle is formed.

Bollinger Band+ Multi EMA, SMAHello Everyone.
I make Bollinger band , 3 ema and 3 sma combined.
I think this indicator can use all timeframe.
--------------------------------------------------------------
Indicator will show you
1. Trend follow
2. Pullback catch
2. Market bounce.
1. Trend Follow
- Trend Follow for I used 3 terms. They are short, Mid and Long Trend.
2. Pullback Catch
- EMA for Save, take care, alert Zones.
- Mid Term Trend can be catch also.
3. Market Bounce
- Bollinger Band will show you market re-bounce point.
Final Notes
Indicator will show Trend, Pullback, Market bounce and some support and resistant level.

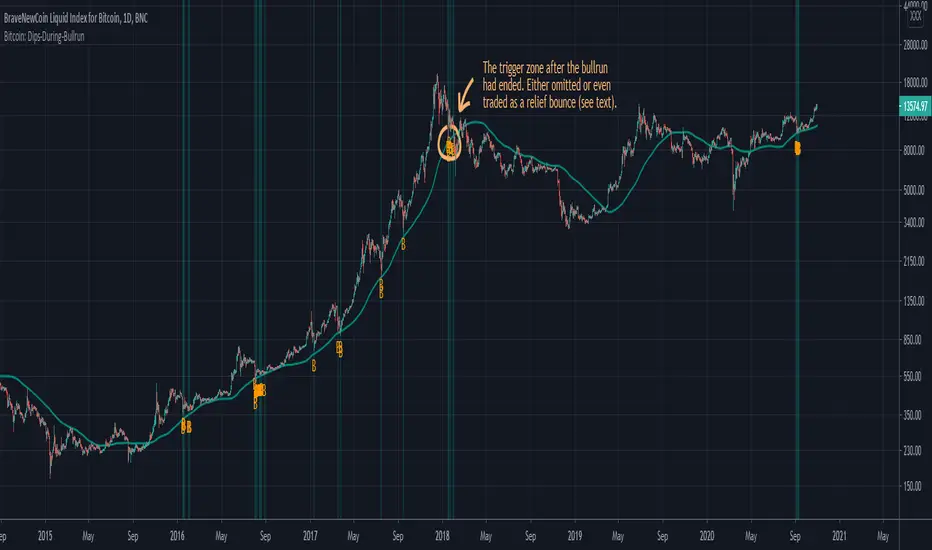
Bitcoin: Dips During BullrunThis script is designed to show dips during Bitcoin bull markets, assuming that Bitcoin finds its local low points in that market phase mostly around the MA(20W=140D) while having a low RSI value. Some other condition is also used to really only trigger after a distinct uptrend has begun. This indicator should only be used on the daily (D) timeframe, and preferably for the BraveNewCoin Liquid Index for Bitcoin (BLX). It's mostly for convenience as people could also just track the MA and the RSI closely, and additionally watch for evidence of a starting bull market. It is yet to be seen if Bitcoin really finds its local bottoms in this bull cycle based on those rules, but the latest price action looks promising. The indicator triggered a few weeks ago, so that the start of the next parabolic run of Bitcoin might be just around the corner.
Note that this algorithm is rather rudimentary, and it will also trigger in one more zone after the bullrun has already ended (marked on the chart above), as the first retest of the MA(20W) shows similar behaviour in the RSI as during bullrun dips. However with other indicators DeanTrader provides (as e.g. the "Bitcoin: Price Action Integrals", and the "Bitcoin: Top & Bottom Mini-Algo" indicators), it should be possible to determine when the bullrun has roughly ended to then discard this indicator until the next bull phase starts sometime in the future. Also some people might even want to trade the relief bounce based on that after-bullrun trigger.
You can hide the MA, as well as the green overlay and/or the plotted "B"s, if you only want to see some part of this indicator on your chart.
For access please contact me via DM on TradingView or on Twitter (linked on my TradingView profile and in my signature).
Fib Cross Moving AveragesThe white line is the main 200-candle MA. The fibonacci ratio MAs are relative to that 200-day MA. Some lines change color based on the trend shown by this indicator.
So 61.8% for example, the orange/red line golden ratio MA is a 124 candle MA (~68% of 200). There is also a weighted 124 candle MA that works along-side the 100 candle MA.

Pisani BandsThis indicator is based on Historical Volatility.
It's plot the simple moving average with a upper and a lower band.
The bands are calculated like this:
UpperBand = 20 Simple moving average + 20% * Historical volatility
LowerBand = 20 Simple moving average - 20% * Historical volatility
But, you can change the paramters. I use the 200SMA with 100% of Historical Volatility either.
How to use:
If the price are negociating out of the bands, it's dangerous to trade this stock.
Hope you like it.

EOD TraderMy EOD (End of Day) system for trading on the daily timeframe with minimum stress. Just pair the built-in alerts with the bot of your choice and then let the indicator do the rest. It'll determine the current trend, filter out as much noise as possible and then take you from long to short.
There are options to toggle the following:
Auto fibonacci levels with alerts for the look-back period of your choosing
Auto support and resistance with alerts
Alerts for the price closing above/below the 50MA
A coloured background to show the trend direction (green = up, red = down)
The fib and support levels can be handy when trying to determine when best to take profit or even exit the trade entirely.
Important: I personally use Heikin Ashi candles with this script to further filter entries. An option is available within the script settings to toggle this on/off should you wish to do the same.
This is a premium script. Please DM me for access.


Improved On balance volume with BB channel and double MAThis is an improved version of the on balance volume indicator.
I made it inside a bollinger band channel, so we can define better the zones. At the same time I applied 2 moving averages on OBV, to get a better idea of the trend and at same time that change direction of the trend.
Green - > uptrend - > we look for buy positions
Red - > downtrend -> we look for sell positions.
At the same time we have to be aware of crosses on bollinger bands, which can indicate a change in the trend .

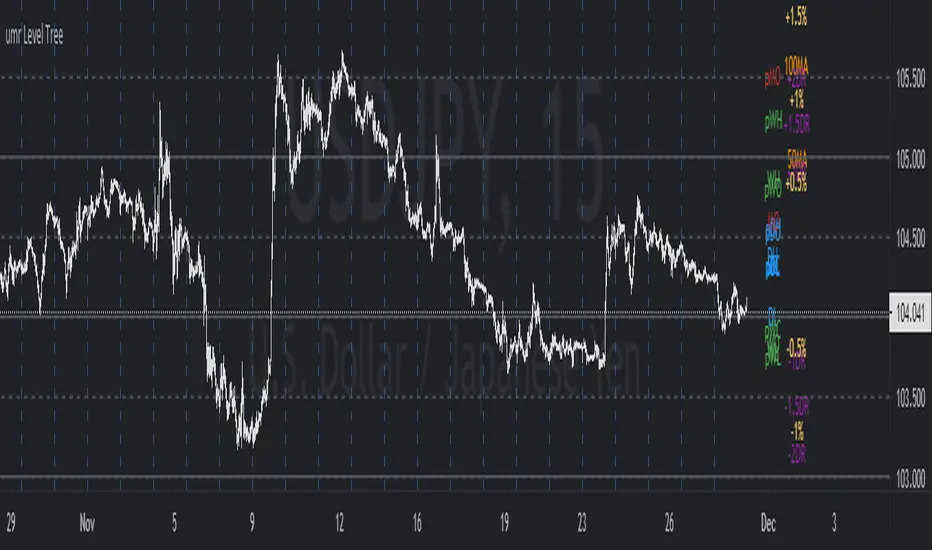
umr Level TreeShows following levels and labels (which can be individually controlled):
OHLC levels of Today, Yesterday, This week, Last week, This Month, Last Month
Daily Simple Moving Averages (50, 100, 200)
Horizontal Grid on 50, 100 pips for FX instruments.
(to do) Add ATR or Std Deviation
(to do) Add Daily Change levels % i.e. 0.5%, 1%, 2%
(to do) Add Daily change in pips levels (for fx) i.e. 50 pips, 100 pips etc