Percent above or Below Moving Average Candle colourFilter:
If green candle is 'x' % above moving average than colour of candle is turn in blue colour.
If red candle is 'x' % below moving average than colour of candle is turn in orange colour.
Sma

TradingCube : Moving Average : Data tablePlots moving average both EMA as well as SMA on Multiple timeframes at once in a Tabular Format
for rapid indication of momentum shift as well as slower-moving confirmations.
Displays EMA/SMA 5 8, 13, 21,34,55,89,100,200,400 by default as well as provide the users the flexibility to choose the timeframe as per their set up.

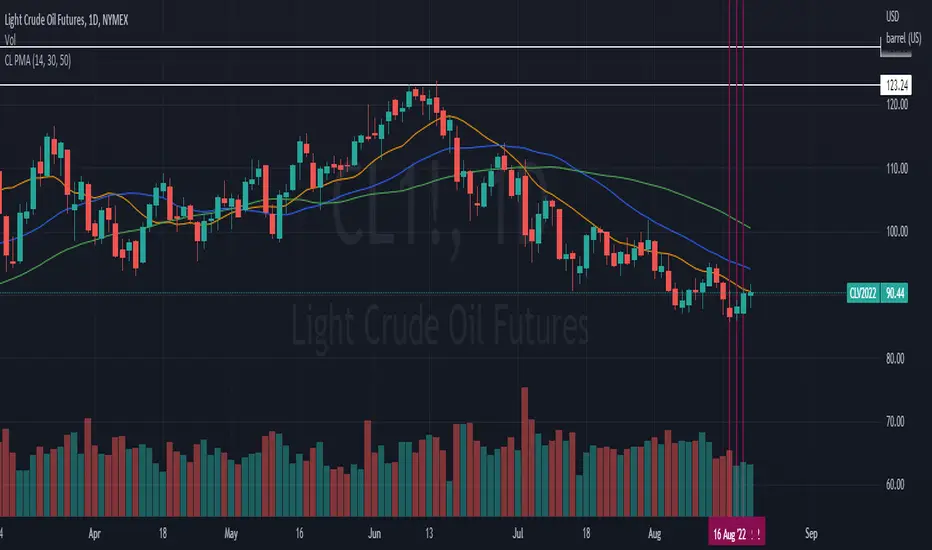
CL PMAPivot moving averages useing SMA's. This study is just a tweak from the study already done by @QUANTCT. I just cleaned it up and used SMAs instead of EMAs so he deserves most credit.
Multiple Daily SMA EMA on Intra 1min 5min 15min ChartsThis script is helping you auto plot daily SMA EMA and extensions when you are looking at intraday charts. The script is customizable where user can select which ever levels they are interested in viewing. These daily lines act as support and resistance levels for intraday
The green line represent 20 EMA Daily
The yellow line represent 50 SMA Daily
The olive line represent 200 SMA Daily
The red line is upper Bollinger Band Daily
The black line is lower Bollinger Band Daily
To help you understand which lines are what I would recommend you add this indicator and select "D" timeframe and then see which lines you would like to view for your 1min chart or 5 min chart you can customize from the setting options which plot color you would like to view.

Hodrick-Prescott Extrapolation of Price [Loxx]Hodrick-Prescott Extrapolation of Price is a Hodrick-Prescott filter used to extrapolate price.
The distinctive feature of the Hodrick-Prescott filter is that it does not delay. It is calculated by minimizing the objective function.
F = Sum((y(i) - x(i))^2,i=0..n-1) + lambda*Sum((y(i+1)+y(i-1)-2*y(i))^2,i=1..n-2)
where x() - prices, y() - filter values.
If the Hodrick-Prescott filter sees the future, then what future values does it suggest? To answer this question, we should find the digital low-frequency filter with the frequency parameter similar to the Hodrick-Prescott filter's one but with the values calculated directly using the past values of the "twin filter" itself, i.e.
y(i) = Sum(a(k)*x(i-k),k=0..nx-1) - FIR filter
or
y(i) = Sum(a(k)*x(i-k),k=0..nx-1) + Sum(b(k)*y(i-k),k=1..ny) - IIR filter
It is better to select the "twin filter" having the frequency-independent delay Тdel (constant group delay). IIR filters are not suitable. For FIR filters, the condition for a frequency-independent delay is as follows:
a(i) = +/-a(nx-1-i), i = 0..nx-1
The simplest FIR filter with constant delay is Simple Moving Average (SMA):
y(i) = Sum(x(i-k),k=0..nx-1)/nx
In case nx is an odd number, Тdel = (nx-1)/2. If we shift the values of SMA filter to the past by the amount of bars equal to Тdel, SMA values coincide with the Hodrick-Prescott filter ones. The exact math cannot be achieved due to the significant differences in the frequency parameters of the two filters.
To achieve the closest match between the filter values, I recommend their channel widths to be similar (for example, -6dB). The Hodrick-Prescott filter's channel width of -6dB is calculated as follows:
wc = 2*arcsin(0.5/lambda^0.25).
The channel width of -6dB for the SMA filter is calculated by numerical computing via the following equation:
|H(w)| = sin(nx*wc/2)/sin(wc/2)/nx = 0.5
Prediction algorithms:
The indicator features the two prediction methods:
Metod 1:
1. Set SMA length to 3 and shift it to the past by 1 bar. With such a length, the shifted SMA does not exist only for the last bar (Bar = 0), since it needs the value of the next future price Close(-1).
2. Calculate SMA filer's channel width. Equal it to the Hodrick-Prescott filter's one. Find lambda.
3. Calculate Hodrick-Prescott filter value at the last bar HP(0) and assume that SMA(0) with unknown Close(-1) gives the same value.
4. Find Close(-1) = 3*HP(0) - Close(0) - Close(1)
5. Increase the length of SMA to 5. Repeat all calculations and find Close(-2) = 5*HP(0) - Close(-1) - Close(0) - Close(1) - Close(2). Continue till the specified amount of future FutBars prices is calculated.
Method 2:
1. Set SMA length equal to 2*FutBars+1 and shift SMA to the past by FutBars
2. Calculate SMA filer's channel width. Equal it to the Hodrick-Prescott filter's one. Find lambda.
3. Calculate Hodrick-Prescott filter values at the last FutBars and assume that SMA behaves similarly when new prices appear.
4. Find Close(-1) = (2*FutBars+1)*HP(FutBars-1) - Sum(Close(i),i=0..2*FutBars-1), Close(-2) = (2*FutBars+1)*HP(FutBars-2) - Sum(Close(i),i=-1..2*FutBars-2), etc.
The indicator features the following inputs:
Method - prediction method
Last Bar - number of the last bar to check predictions on the existing prices (LastBar >= 0)
Past Bars - amount of previous bars the Hodrick-Prescott filter is calculated for (the more, the better, or at least PastBars>2*FutBars)
Future Bars - amount of predicted future values
The second method is more accurate but often has large spikes of the first predicted price. For our purposes here, this price has been filtered from being displayed in the chart. This is why method two starts its prediction 2 bars later than method 1. The described prediction method can be improved by searching for the FIR filter with the frequency parameter closer to the Hodrick-Prescott filter. For example, you may try Hanning, Blackman, Kaiser, and other filters with constant delay instead of SMA.
Related indicators
Itakura-Saito Autoregressive Extrapolation of Price
Helme-Nikias Weighted Burg AR-SE Extra. of Price
Weighted Burg AR Spectral Estimate Extrapolation of Price
Levinson-Durbin Autocorrelation Extrapolation of Price
Fourier Extrapolator of Price w/ Projection Forecast

Moving Averages RefurbishedIntroduction
This is a collection of multiple moving averages, where you can have a rainbow of moving averages with different types that can be defined by the user.
There are already other indicators in this rainbow style, however certain averages are absent in certain indicators and present in others,
needing the merge to have a more complete solution.
Resources
Here there is the possibility to individually define each moving average.
In addition, it is possible to adjust some details, such as themes, coloring and periods.
Regarding the calculation of averages, credit goes to the following authors.
What I've done here is to group these averages together and allow them to combine.
Credits
TradingView
PineCoders
CrackingCryptocurrency
MightyZinger
Alex Orekhov (everget)
alexgrover
paragjyoti2012
Moving averages available
1. Exponential Moving Average
2. Simple Moving Average
3. Relative Moving Average
4. Weighted Moving Average
5. Ehlers Dynamic Smoothed Moving Average
6. Double Exponential Moving Average
7. Triple Exponential Moving Average
8. Smoothed Moving Average
9. Hull Moving Average
10. Fractal Adaptive Moving Average
11. Kaufman's Adaptive Moving Average
12. Volatility Adjusted Moving Average
13. Jurik Moving Average
14. Optimized Exponential Moving Average
15. Exponential Hull Moving Average
16. Arnaud Legoux Moving Average
17. Coefficient of Variation Weighted Exponential Moving Average
18. Coefficient of Variation Weighted Moving Average
19. * Ehlrs Modified Fractal Adaptive Moving Average
20. Exponential Triangular Moving Average
21. Least Squares Moving Average
22. RSI Moving average
23. Simple Triangular Moving Average
24. Triple Hull Moving Average
25. Variable Index Dynamic Average
26. Volume-weighted Moving Average
27. Zero-Lag Exponential Moving Average
28. Zero-Lag Simple Moving Average
29. Elastic Volume Weighted Moving Average
30. Tillson T3
31. Geometric Moving Average
32. Welles Wilder Moving Average
33. Adjusted Moving Average
34. Corrective Moving average
35. Exponentially Deviating Moving Average
36. EMA Range
37. Sine-Weighted Moving Average
38. Adaptive Moving Average TABLE
39. Following Adaptive Moving Average
40. Hilbert based Kaufman's Adaptive Moving Average
41. Median
42. * VWAP
43. * Rolling VWAP
44. Triangular Simple Moving Average
45. Triangular Exponential Moving Average
46. Moving Average Price Correlation
47. Regularized Exponential Moving Average
48. Repulsion Moving Average
49. * Symmetrically Weighted Moving Average
* fixed period averages

Moving Averages Proximity Oscillator [LuxAlgo]This indicator returns the percentage or count of prices greater than simple moving averages with periods in a user set range, as well as the moving average period that is the closest to price values.
Settings
Minimum Length: Minimum SMA period
Maximum Length: Maximum SMA period
Smooth: Control the degree of smoothness of the indicator outputs
Normalized: Normalize the indicator outputs in a range (0, 100)
Src: Input source of the indicator
Usage
The indicator returns two outputs.
The "Price Above MA's" output returns for a current price value the number of times this one is greater than simple moving averages with periods ranging from Minimum Length to Maximum Length . This oscillator can be expressed as a percentage if Normalized is selected.
This oscillator allows identifying the direction of an underlying trend in the price. Higher Minimum Length and Maximum Length settings will return indications regarding longer term price variations, while shorter ranges will return less detailed outputs. This can be seen in the chart above where Minimum Length = 80 to Maximum Length = 100 .
The "Proximity Index" output on the other end does not return information regarding the direction of an underlying trend but the period of the simple moving average with periods ranging from Minimum Length to Maximum Length that is the closest to the current price value.
For various simple moving averages of differing periods, we can see that SMA's with shorter periods will tend to stay closer to the price, when price start reverting it will reach higher periods moving averages.
As such, this second indicator output can help identify the start of new trends, with higher values indicating price is reverting toward longer-term moving averages, suggesting a new trend forming.

J-AutomationJust a simple automation for FX trading.
This strategy goes long if the MACD histogram and the MACD momentum are both above zero and the fast MACD moving average is above the slow MACD moving average. As additional long filter the recent price has to be above the SMA 200. If the inverse logic is true, the strategy goes short.
SMA VWAP BANDS [qrsq]Description
This indicator is used to find support and resistance utilizing both SMA and VWAP. It can be used on lower and higher time frames to understand where price is likely to reject or bounce.
How it works
Rather than using the usual calculation for the VWAP, instead this script smooths the volume first with the SMA and then respectively calculates the smoothed multiplication of high, low and close price with the volume individually. These values are then divided by the smoothed volume to find individual VWAP's for each of the sources. The standard deviations of these are calculated, resulting in an upper, lower and middle band. It is essentially VWAP bands with some smoothed calculations in the middle.
How to use it
I like to use the bands for LTF scalping as well as HTF swings.
For scalping:
I tend to use either the 5m or 15m TF
I then set the indicator's TF to 1m
I will take a scalp based on the bands confluence with other PA methods, if price is being either supported or rejected.
For swings:
I tend to use a variety of TFs, including: 30m, 1H, 4H, D
I then set the indicator's TF to "Chart"
I will take a swing based on the bands confluence with other PA methods, if price is being either supported or rejected.
I also tend to use them on perpetual contracts as the volume seems to be more consistent and hence results in more accurate support and resistance.

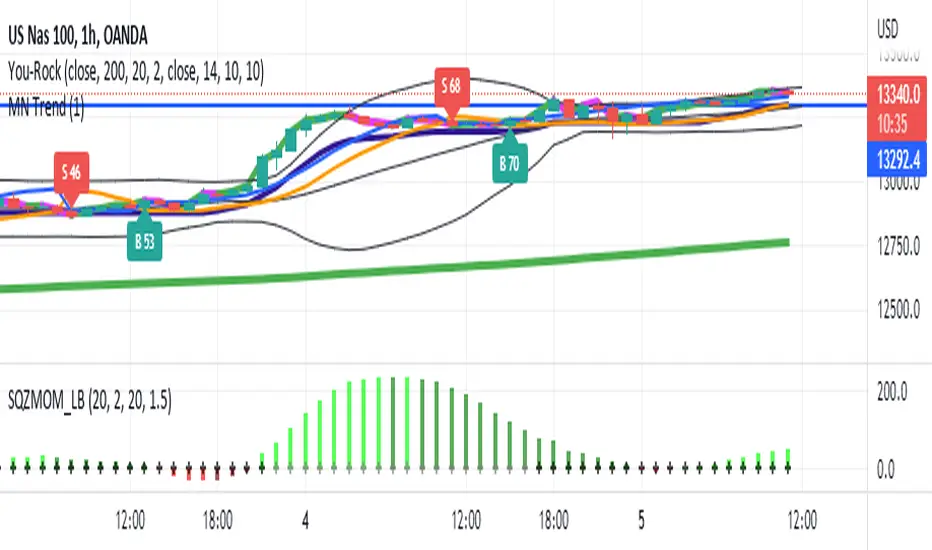
Gate Signal by Market yogiThis indicator is made by Nischay Rana (Market Yogi)
How to use this Indicator
This is simple group of 8 moving averages, which can be configured in various ways according to your trading requirement.
1. moving average ribbon
2.moving average channel
3.moving average gate signal
4.This indicator has bonus indicator of bollinger bands inbuilt.
Logic:
As price has tendency to get closer to their moving averages. The logic behind this indicator is to use the contraction and expansion concepts of moving averages to find best entry exit points.
This nature of Price action is use to capture the big move after the convergence of all moving averages.
CAUTION : Do not blindly trade the gates as gate has tendency to break out on either side. So use this indicator in confluence with price action and other technical analysis to capture bigger moves.
Higher the gate width more gates are found. Similarly lesser the gate width less gate are found. i.e. Tight squeeze of all the moving averages.
"ENJOY HAPPY TRADING.."
Truly Yours Market Yogi

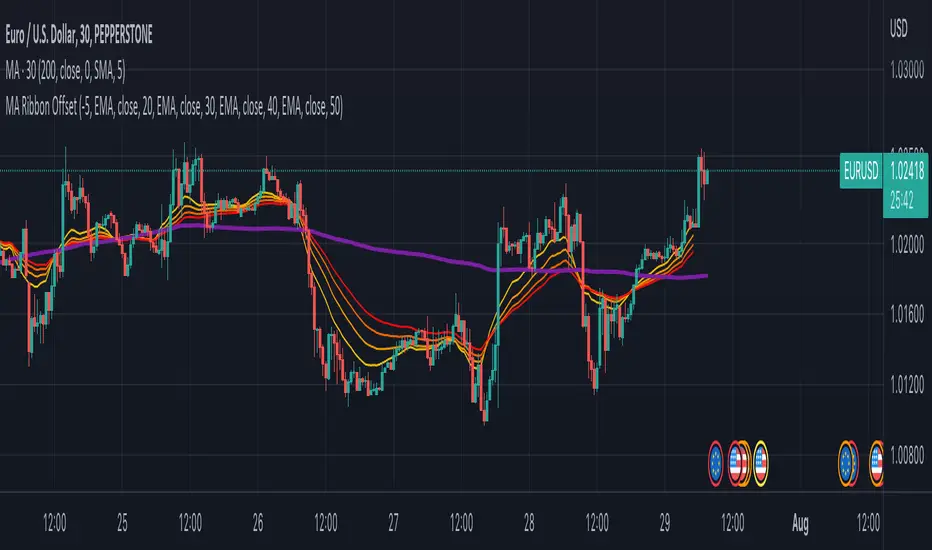
Moving Average Ribbon with OffsetHello,
this script is the same as the built-in Moving Average Ribbon. I just added the offset for all 4 the MAs.
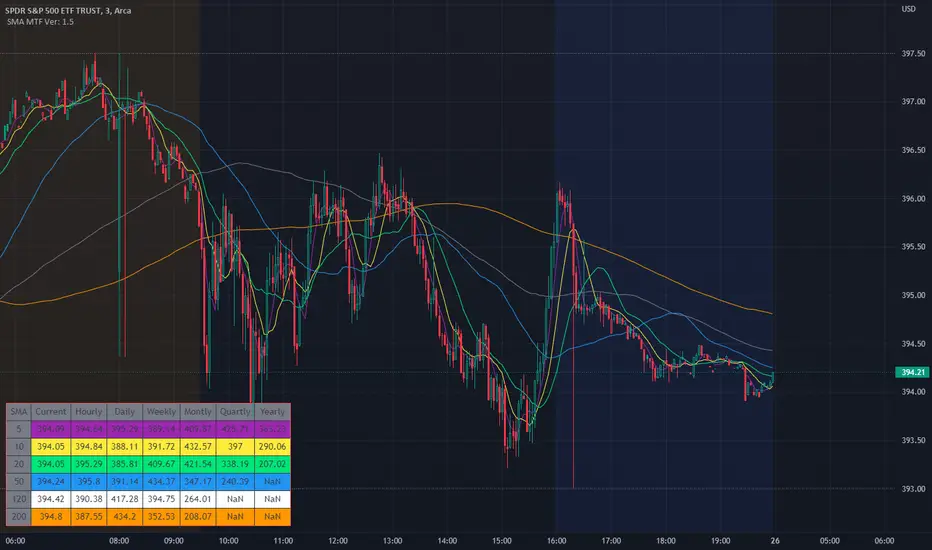
SMA Multi Time Frame Table V1.5Since I couldn't find a script like this I made one so here is what it does.
The script will plot on the chart as well as post the related data into the table.
The default Simple Moving Avg are 5, 10, 20, 50, 120, 200 which can also be changed to whatever SMA you would like. The SMA values are then plotted on the charts so that quickly check to see where they are and how the candles are reacting to the SMAs.
Not only does the script plot the SMAs but it also places higher time frames into the table that is in the script, from current price, to daily, weekly, monthly, quarterly (3 months if you don't have it added) and yearly. The reason why was it price action of the stock does interact and can be rejected or find support from SMA on a higher time frames.
I still use this script so that you can quickly capture the values so that short-term, and long-term resistance and support can be determined during market hours.
Another good thing is that when you change the values in the script settings it also applies those settings to the table as well.
Now it will take a little bit for the table to show up, so please be patient. I have tested it with stocks, forex, and crypto.
I wanted to get this published and I am still working on the background to try and get EMAs. Where you can flip over to EMA to also see the EMA plots and table values for the MTF.
EMA ON MA SETSOORY FOR MY EINGLISH
ITS NOT MY NATIVE AND IM NOT GOING TO GOOGLE TRANSLATE THIS
this is a beuaitful indicator that plot EMA that gat is calc from another ma and length for your choise so you will get an = 'ema on ma '
it can plot you more beautiful results and more smoothing results
i added golden/death cross for all ma
enjoy !
היי חברים זה בעצם אינדיקטור של ממוצע נע על ממוצע נע לנוחיכותכם
הפלט הראשי הוא EMA
הוא לוקח את החישוב שלו ממוצע אחר והאורך שתגדירו
נותן תוצאה יותר חלקה של ממוצעים נעים
הוספתי חתיוכים בין ההמוצעים
תהנו.

Month/Month Percentage % Change, Historical; Seasonal TendencyTable of monthly % changes in Average Price over the last 10 years (or the 10 yrs prior to input year).
Useful for gauging seasonal tendencies of an asset; backtesting monthly volatility and bullish/bearish tendency.
~~User Inputs~~
Choose measure of average: sma(close), sma(ohlc4), vwap(close), vwma(close).
Show last 10yrs, with 10yr average % change, or to just show single year.
Chose input year; with the indicator auto calculating the prior 10 years.
Choose color for labels and size for labels; choose +Ve value color and -Ve value color.
Set 'Daily bars in month': 21 for Forex/Commodities/Indices; 30 for Crypto.
Set precision: decimal places
~~notes~~
-designed for use on Daily timeframe (tradingview is buggy on monthly timeframe calculations, and less precise on weekly timeframe calculations).
-where Current month of year has not occurred yet, will print 9yr average.
-calculates the average change of displayed month compared to the previous month: i.e. Jan22 value represents whole of Jan22 compared to whole of Dec21.
-table displays on the chart over the input year; so for ES, with 2010 selected; shows values from 2001-2010, displaying across 2010-2011 on the chart.
-plots on seperate right hand side scale, so can be shrunk and dragged vertically.
-thanks to @gabx11 for the suggestion which inspired me to write this

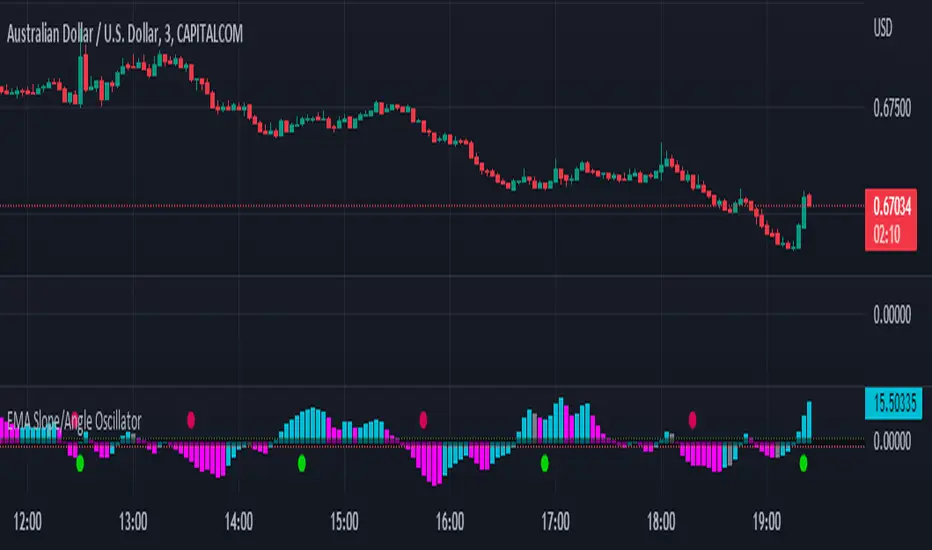
EMA Slope/Angle OscillatorEMA Slope/Angle Oscillator, Multiple Moving Average Oscillator, Multiple type
Moving Averages HMA,EMA,WMA,SMA, VWMA,VWAP provided.
The angle is calculated between the Slow MA and Fast MA and the difference between the angle is plotted as Histogram.
Additionally Buy Sell Signals are plotted as green and red Dots.
its very easy to judge the movement of price Bearish/Bullish.
Bearish if price below 0 line
Bullish if price above 0 line
Zero crossing is Moving Average Crossover.
Trend Filter is provided to filter opposite signals.
Angle Threshold is provided to filter low angle false signals.
Dead zone is plotted around Zero Line. Trades can be taken after Threshold angle or Dead zone is crossed
Its interesting to see how different Moving Averages move along with price Action.
SMA - SSL Hybrid - HalfTrendSMA - Halftrend Signal - SSL Hybrid ichi signal indicator
This indicator is actually a combination of several indicators to get the right signal in the direction of the market and gain profit
At first, there are some simple moving averages called MA, which are used only to display the simple moving average in different time frames.
Then we have the combination of a Halftrend indicator which is set in such a way that if the three Halftrend lines are green, it will issue an ascending signal, and if all three lines are red, it will issue a descending signal.
In the following, we have Tenkasen from Ichi Moko with SSL Hybrid, if the candlesticks are above Tenkasen and SSL Hybrid issues an upward signal, it is a suggestion to enter into a buy transaction, and if the candles fall below Tekasen and SSL Hybrid A bearish sign above the candle means a sell offer
It is more optimal to place the candlestick display in Heiken Ashi mode

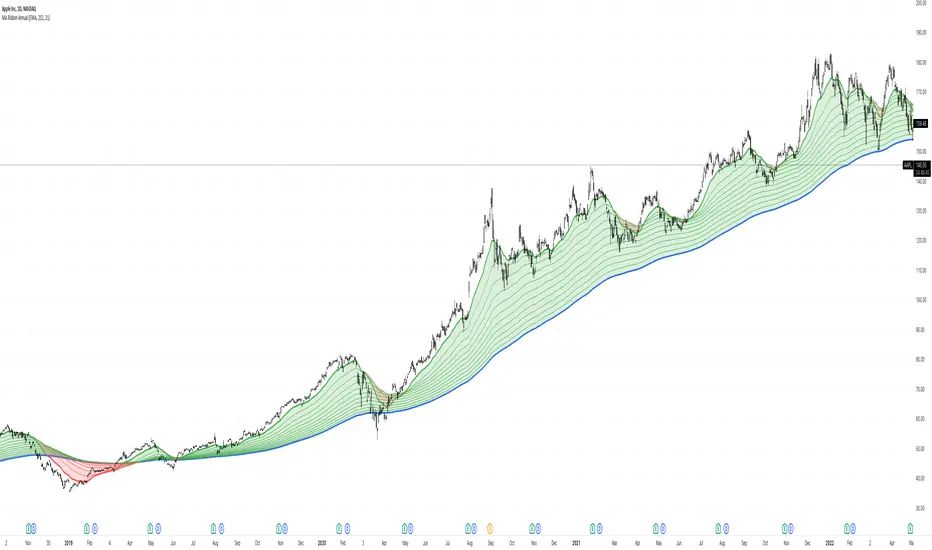
MA Ribbon AnnualThis script starts with the 252 E(S)MA and steps it down 21 days per MA. The starting ribbon (Annual Moving Avg Length) and step-downs (Monthly Step Downs) are adjustable.
The goal of this script is to quickly see if prices respect a certain MA length more than another. Monthly lengths were chosen because of their relation to earnings and other reports.
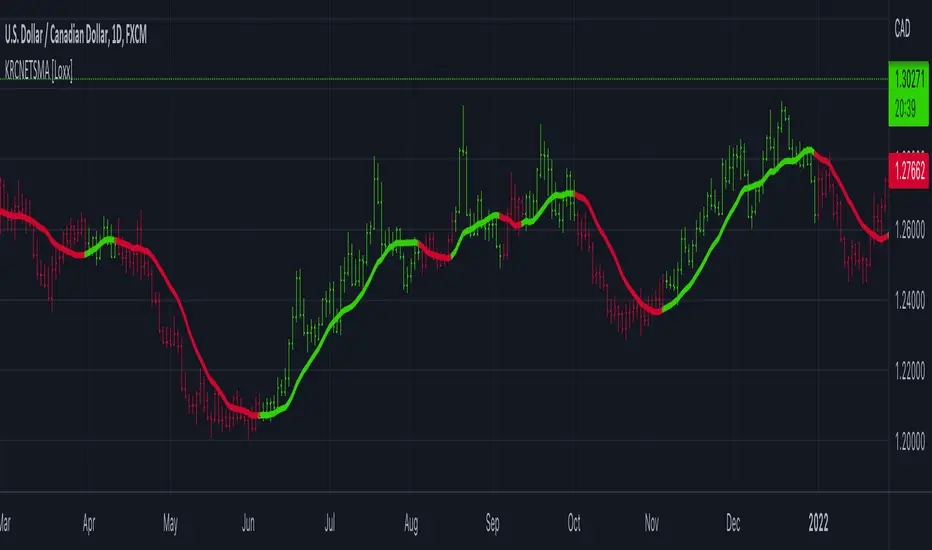
Kendall Rank Correlation NET on SMA [Loxx]Kendall Rank Correlation NET on SMA is an SMA that uses Kendall Rank Correlation to form a sort of noise elimination technology to smooth out trend shifts. You'll notice that the slope of the SMA line doesn't always match the color of the SMA line. This is behavior is expected and is the NET that removes noise from the SMA.
What is Kendall Rank Correlation?
Also commonly known as “Kendall’s tau coefficient”. Kendall’s Tau coefficient and Spearman’s rank correlation coefficient assess statistical associations based on the ranks of the data. Kendall rank correlation (non-parametric) is an alternative to Pearson’s correlation (parametric) when the data you’re working with has failed one or more assumptions of the test. This is also the best alternative to Spearman correlation (non-parametric) when your sample size is small and has many tied ranks.
Kendall rank correlation is used to test the similarities in the ordering of data when it is ranked by quantities. Other types of correlation coefficients use the observations as the basis of the correlation, Kendall’s correlation coefficient uses pairs of observations and determines the strength of association based on the patter on concordance and discordance between the pairs.
Concordant: Ordered in the same way (consistency). A pair of observations is considered concordant if (x2 — x1) and (y2 — y1) have the same sign.
Discordant: Ordered differently (inconsistency). A pair of observations is considered concordant if (x2 — x1) and (y2 — y1) have opposite signs.
Kendall’s Tau coefficient of correlation is usually smaller values than Spearman’s rho correlation. The calculations are based on concordant and discordant pairs. Insensitive to error. P values are more accurate with smaller sample sizes.
Included:
-Toggle on/off bar coloring
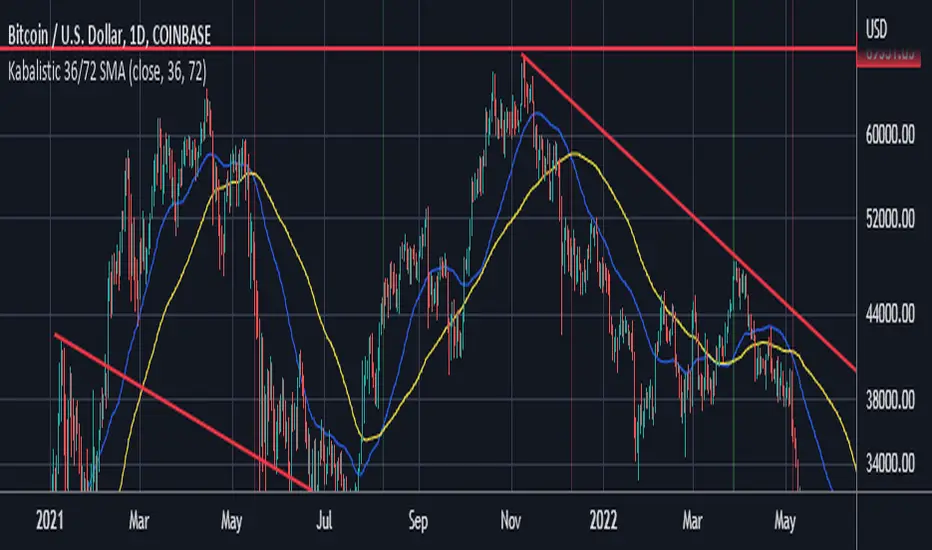
Kabalistic 36/72 SMAThe Kabalistic 36/72 SMA
This is a experimental indicator to identify potential changes in the market:
The short SMA:
If the price fall beneath the Short SMA, THEN I SHORT
The Long SMA:
If the price is found beneath the Long SMA, THEN I LONG.
Joe's Ultimate MA Ribbon (w/ Crossover Triggers)Tired of having to add multiple moving average indicators to your chart? Well, stop doing that.
Here's a sweet moving average ribbon (with 1-10 moving average lines!) that will make your charts look much cooler 😎.
Not only that, it also includes triggers for MA crossovers. So, yeah...you can pick which MA crossovers trigger for longs and shorts separately. Yup, you read that right.
Options:
Show/Hide MA Lines: Only show the lines you wanna see. No more. No less.
MA Type (can be different for each line!): EMA, SMA, SMMA (RMA), WMA, VWMA
MA Source (for each line): open, close, high, low, hl2, hlc3, ohlc4, hlcc4
MA Length (for each line): any number between 1 and 4999
Line Colors: Ooh, pretty.
Triggers: On or Off
Crossover Long Triggers: When _______ crosses over _______ on timeframe _______
Crossover Short Triggers: When _______ crosses over _______ on timeframe _______
Trigger Characters and Location

Infiten's Return Candle OscillatorInfiten's Return Candle Oscillator is an oscillator which shows the percentage return on the open, high, close and low over a customizable period in the form of candlesticks. It may be helpful for seeing volatility, swing trading, or mean reversion trading.
The RCO consists of two plotted elements :
RCO Candles (short length): candlesticks which are plotted with low = the product of the percentage changes in the low over a period, high = the product of the percentage changes in the high over a period, close = the product of the percent changes in close over a period, and open = the product of the percentage changes in return over a period. Similarly to with standard candlesticks, if the percentage change on the close is higher than the percentage change on the open, the candlestick is green, otherwise it is red.
Smoothed RCO Line (long length) : a moving average of the average of the low, close, open and high calculated for the RCO Candles. The line's transparency is determined by the percentage difference between the RCO and the highest or lowest RCO over the long length. A more transparent line means that the RCO is closer to the highest or lowest RCO, and may be indicative of a reversal, or weakening trend.

Highlight DeductionHighlighting deduction OHLC bar make traders easier to observe SMA direction. This indicator will highlight the deduction area(width can be set by yourself) and draw dotted line of deduction value. Since this indicator comes from SMA, it plot SMA(up to 2) too.

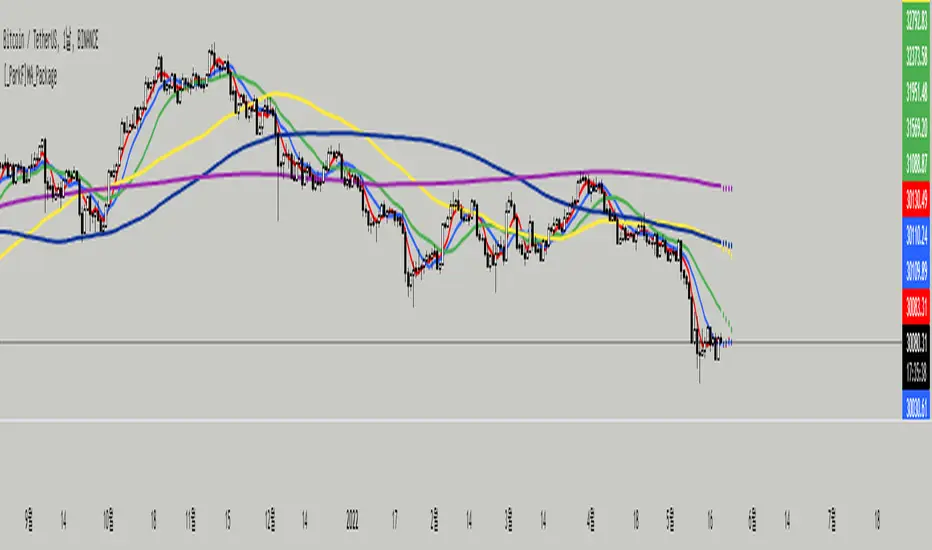
[_ParkF]MA_PackageThis indicator is a comprehensive set of moving averages.
All settings are handled in the input menu.
1. 6 moving averages are included.
2. You can edit the source of 6 moving averages.
3. You can change the type of each moving average line.
4. You can change the period value of each moving average line.
5. You can change the color of each moving average line.
6. You can change the thickness of each moving average line.
7. The predictive value of each moving average line will be displayed as a dot, and this value will be changed according to the type of the moving average line.
--------------------------------------------------------------------------------------------------------------------------------------------------------------------------------------------------------
이 지표는 이동평균선의 종합선물세트 입니다.
모든 설정은 input 메뉴에서 다뤄집니다.
1. 6개의 이동평균선이 포함 되어 있습니다.
2. 6개의 이동평균선의 소스를 수정할 수 있습니다.
3. 각각의 이동평균선의 타입을 변경할 수 있습니다.
4. 각각의 이동평균선의 기간값을 변경할 수 있습니다.
5. 각각의 이동평균선의 색상을 변경할 수 있습니다.
6. 각각의 이동평균선의 두께를 변경할 수 있습니다.
7. 각각의 이동평균선의 예측값이 점으로 표시될 것이고 이 값은 해당 이동평균선의 타입에 맞춰 변경됩니다.