Market Structure External/Internal with BOS/CHoCH/FTC [zazenio]You're staring at a chart trying to figure out one thing: which way is price going? You see a move up—is it a new trend or just a pullback? You spot what looks like a swing low, but is it real or will price slice right through it? And even if you get the direction right, where do you enter?
This market structure indicator can help answer these questions.
Market Structure 2.0 tracks swing points and tells you when they actually break—not when a wick pokes through, but when price closes beyond the level. That close is what matters.
CHoCH (Change of Character) – Your signal that trend direction may be flipping. If price has been making lower lows then suddenly closes above a swing high, that's a CHoCH. Doesn't guarantee reversal, but the character of the move has shifted.
BOS (Break of Structure) – Confirms trend continuation. In an uptrend, when price closes above the previous swing high, that's a BOS. Buyers are still in control.
FTC (Failure to Close) – Price wicked beyond a pivot but couldn't close there. Someone defended that level. A warning sign that the move might stall or reverse.
External vs Internal Structure
External structure is your CTF (current timeframe) trend—the main swing points that define overall direction.
Internal structure tracks price action forming within the current pivot range. It auto-resets each time external structure breaks, keeping your chart clean.
External is more important for trend direction. Internal gives you insight into what's happening between those major swings—useful for timing entries on pullbacks.
The BOS Counter
A dashboard tracking consecutive BOS counts with color-coded trend state:
Green – Trending bullish, price holding above CHoCH level
Red – Trending bearish, price holding below CHoCH level
Gray – Sideways/ranging, price has crossed back through CHoCH but no new break yet
** Gray means caution—what was trending is now in question.
Premium & Discount Zones
Zones based on the range between the most recent external swing high and low:
Premium – Top 25%, look for shorts
Discount – Bottom 25%, look for longs
50% line – Equilibrium
** Optional alerts when price enters either zone.
What Makes This Different
Most pivot indicators mark swings after a fixed bar count. This indicator only confirms a pivot when price breaks structure the other way. That swing low isn't real until price closes above the swing high. Until then, it shows faded—potential, not confirmed.
Every element is fully customizable—colors, styles, labels, positioning. Make it fit your setup.
━━━━━━━━━━━━━━━━━━━━━━
Features v2.0
Automatic swing high and swing low detection
Structure-based pivot confirmation (closes beyond level, not fixed lookback)
Customizable pivot markers (style, size, colors)
Adjustable swing width sensitivity
Dual-layer analysis (External CTF trend + Internal structure within pivot range)
BOS lines for trend continuation
CHoCH lines for potential reversals
FTC lines for failed breakouts / level rejections
Fully customizable structure lines (colors, styles, widths, labels)
Real-time BOS counter dashboard with trend state (trending vs sideways)
Premium zone (upper 25% of range)
Discount zone (lower 25% of range)
50% equilibrium line
Zone entry alerts (Premium & Discount)
Internal structure auto-resets on external breaks
Provisional structure lines (live preview before bar close)
Unconfirmed pivots displayed faded until validated
━━━━━━━━━━━━━━━━━━━━━━
Disclaimer : This script is provided for educational and informational purposes only. It is not financial advice and does not constitute a recommendation to buy or sell any financial instrument. Always do your own research and trade at your own risk.
Smcconcepts

Perfect EQHs + EQLsPerfect EQHs + EQLs: High-Precision Liquidity Mapping
Identifying Equal Highs (EQH) and Equal Lows (EQL) is critical for traders who focus on liquidity, Internal Range Liquidity (IRL), and stop-hunts. This indicator is built for surgical precision, ensuring that only "mathematically perfect" levels are identified and projected until they are actually mitigated by price.
Key Features
Real-Time Mitigation: Lines are not static. As soon as price crosses a detected level (invalidating the liquidity), the line and label are instantly removed from the chart.
Dual Extension Modes: * Full Right Edge: Projects levels across the entire chart background for a clean, institutional look.
Bar Count: Extends lines a specific number of bars into the future (customizable).
Dynamic Sensitivity: Choose between a Dropdown Mode (pre-set for High, Medium, or Low sensitivity, including time-based filters for 1H and 4H+) or a Manual Bar Lookback to define exactly how many bars must separate the two points.
Smart Labels: Features "EQH" and "EQL" labels that anchor perfectly to the right edge of your lines, regardless of your zoom level or extension settings.
How to Use
Spot Liquidity Pools: Use the projected lines to identify where retail buy-side or sell-side liquidity is "resting."
Targeting: Use EQHs and EQLs as high-probability targets for your take-profits.
Entry Confirmation: Watch for price to sweep these levels (liquidity grab) before looking for a Market Structure Shift (MSS) in the opposite direction.
Customization Settings
Appearance: Full control over line colors (default Green for Highs, Red for Lows), thickness, and styles (Solid, Dash, Dotted).
Lookback Length: Define how far back the script scans for matches (supports up to 5,000 bars for deep historical analysis).
Label Visibility: Toggle labels on/off and adjust text size to fit your screen resolution.
Technical Note
Unlike basic fractal-based indicators, this script uses array-based state management to track every individual level. This ensures that the chart remains uncluttered by deleting old levels that are no longer relevant to current price action.

Ultimate Futures Daytrade Suite v1 - The Strategy GuideHere is the complete **Strategy Guide** translated into English.
---
# 📘 Ultimate Futures Daytrade Suite – The Strategy Guide
### 1. The Visual Legend (What is what?)
Before you trade, you need to understand the hierarchy of your lines. Not every line has the same importance.
* **🟣 Daily EMA 50 (Neon Violet):** The **"Big Boss"**. It determines the **Macro Trend**.
* *Price above:* We are primarily looking for Longs.
* *Price below:* We are primarily looking for Shorts.
* **🟢 4h EMA 50 (Neon Green):** The **"Swing Trend"**. Your most important level for **Pullback Entries** (Re-entries).
* **🟡 POC (Gold) & TPO:** The **"Magnet"**. Price often returns here.
* *Rule:* Never open a trade directly *on* the POC (Risk of "Chop"). Use it as a **Target** (Take Profit).
* **🟠 IB High/Low (Orange Lines):** The **"Daily Structure"**.
* A breakout from the IB (Initial Balance) often indicates the trend direction for the day.
* **🟥/🟩 Boxes (Supply/Demand):** Resistance and Support zones from the 1h timeframe.
* **⬜ FVG Boxes:** "Gaps" in the market that are often filled.
---
### 2. The Trading Workflow (Top-Down Method)
Go through this mental checklist before every trade:
#### Step 1: Trend Check (The Traffic Light)
Look at the **Violet Line (Daily)** and the **Green Line (4h)**.
* **Bullish:** Price is above Violet AND above Green. -> *Focus: Buy dips.*
* **Bearish:** Price is below Violet AND below Green. -> *Focus: Sell rallies.*
* **Mixed:** Price is between Violet and Green. -> *Caution! Market is undecided (Range Trading).*
#### Step 2: Location (The Context)
Where is the price currently located?
* Are we at a **Green Demand Zone**?
* Are we testing the **4h EMA 50 (Green)** from above?
* Are we at the **VWAP**?
* *Never trade in "No Man's Land"!* Wait until the price touches one of your lines.
#### Step 3: Trigger (The Execution)
Now zoom into your lower timeframe (e.g., 5min or 15min).
* Wait for a reaction at the zone.
* Use the **EMA 9 (Yellow)** as a momentum trigger. If price breaks the EMA 9 and closes above/below it, that is your "Go".
---
### 3. The Setup Blueprints
Here are the two most profitable scenarios you can trade with this script:
#### A) The "Golden Trend" Setup (Long)
* **Context:** Price > **Daily EMA (Violet)**.
* **Preparation:** Price corrects (drops) back to the **4h EMA 50 (Green)** or to the **VWAP**.
* **Confluence:** Ideally, there is also a **Demand Zone (Green Box)** or an **FVG** at that level.
* **Entry:** As soon as a candle touches the zone and closes bullish again (or reclaims the EMA 9).
* **Stop-Loss:** Below the 4h EMA 50.
* **Take-Profit:** Next **Supply Zone (Red)** or the **IB High (Orange)**.
#### B) The "Daytrade Breakout" (Intraday)
* **Context:** Price opens inside yesterday's Value Area.
* **Signal:** Price breaks through the **IB High (Orange)** with momentum.
* **Filter:** Price must be above the **VWAP**.
* **Entry:** On the retest of the IB High or directly on the breakout.
* **Target:** Price often trends in that direction for the rest of the day.
---
### 4. Warning Signals (When NOT to trade)
1. **The "Concrete Ceiling":** If you want to go Long, but the **Violet Daily EMA 50** is running directly above you. This is massive resistance. Better wait until it is broken.
2. **The "POC Dance":** If price is dancing sideways around the **Gold Line (POC)**. This is a "No-Trade Zone". Day traders lose the most money here due to fees and whipsaws.
3. **Overextension:** If price is extremely far away from the **4h EMA 50 (Green)** (Rubber Band Effect). Do not enter in the trend direction here; wait for a pullback to the line.
### Summary
Your chart is now telling you a story:
* **Violet** tells you the Direction.
* **Green** gives you the Entry.
* **Red/Green Boxes** show you the Obstacles.
* **Yellow (EMA 9)** gives you the Timing.
Good luck with the Suite! This is a setup similar to what institutional traders use.

GOLD QUANTUM MASTER🥇 GOLD QUANTUM MASTER 🥇
━━━━━━━━━━━━━━━━━━━━━━━━━━━━━━━━━━━━━━━━━━━━━━━━━━━━━━━━━━━━━━━━━
A high-performance technical analysis suite engineered for institutional-grade precision on Gold (XAUUSD) and Bitcoin (BTCUSD). This Core Edition focuses on raw analytical power without external API overhead.
🚀 KEY FEATURES:
• INSTITUTIONAL FOOTPRINT: Advanced volume-to-MA filters to identify "Big Money" participation.
• HTF REVERSAL SCANNER: Specialized logic for 30m, 1H, and 4H charts to detect Pinbar and Engulfing reversals.
• LIQUIDITY FLOW ANALYTICS: Detects and highlights Previous Day High (PDH) and Low (PDL) sweeps.
• TREND EXHAUSTION FILTERS: Built-in RSI divergence logic to prevent entries at trend peaks or bottoms.
• PREMIUM DATA LABELS: Real-time on-chart display of Signal Mode, Quality Score, and dynamic targets.
• NEON VISUAL SYSTEM: High-contrast, glassmorphic layout for maximum clarity during trading sessions.
BEST FOR: Technical Analysts, Manual Traders, and High-Performance Charting.
━━━━━━━━━━━━━━━━━━━━━━━━━━━━━━━━━━━━━━━━━━━━━━━━━━━━━━━━━━━━━━━━━
The best work on Higher time frames, I still not tested on lower time frames, but should be also precise.
Feel free to adjust the settings to your own needs.
Make your own decisions when you trade, do not put all confidence into a script, it may fail also.

USS SMC Basic + MagicBoxThis is the indicator which carries 2 different functionality in 1 indicator, basic but important factor of "Smart Money Concept" and "Sideway Detection" with additional features, which is rare to find.
Let's talk about Smart Money Concept (SMC) first.
For SMC, I have enabled BoS & CHoCH detection not only for current chart timeframe but also for higher timeframe simultaneously. You can choose higher timeframe according to you taste. For e.g. if you are trading on 15m and also want to check BoS & CHoCH structure on 1H time frame, you can do it by selecting 1 Hour for HTF Timeframe in INPUTS section. If you want you can enable/disable HTF structure for BoS & CHoCH. You can even customise colors. So all parameters are fully customizable. So with the help of this indicator you don't have to put efforts to identify market structure.
Now let's discuss about MagicBox (Sideways Detection) .
It will draw a rectangle box whenever Sideway market appear. So you don't have to put hard efforts to identify sideway market. This indicator do it for you automatically. Up/Down both breakout from Box is displayed by different colored candle to notice easily. Whenever there will be a successful retest of the box, candle will get displayed with Yellow color. You can choose color of your choice for all three candles (Up Break, Down Break & Retest Candle). Candles will always take the reference of most recent rectangle box.
I hope you will enjoy it.

ICT HTF/BIASICT HTF/BIAS — Full Guide
What this indicator does
ICT HTF/BIAS plots multi-timeframe ICT PD Arrays (FVGs + Order Blocks) and provides a compact bias table that helps you quickly determine directional context across your selected timeframes.
It is designed to stay simple, readable, and ICT-based, while avoiding misleading signals.
Key features
1) ICT PD Arrays included
FVG (Fair Value Gap): classic ICT 3-candle imbalance (gap).
Order Blocks (OB): detected via BOS logic + pivot structure, then searching back for the last opposite candle as the OB anchor.
2) HTF confirmed zones (non-misleading behavior)
Zones are added only on the HTF close (confirmed higher timeframe bar).
This avoids “in-progress HTF candle” noise and reduces false/temporary zones.
3) SHOW vs CALC (decoupled by design)
Each TF has two independent depth controls:
Max SHOW = how many zones you want to draw on the chart (keep your chart clean).
Max CALC = how many zones the table/bias is allowed to analyze (keep your bias logic robust).
This prevents a common problem: changing how many boxes you display changes your bias output.
In this script, your bias can remain stable even if you hide most boxes.
4) Compact Bias Table (fast read)
The table shows:
FVG status: IN / OUT / N/A
OB status: IN / OUT / N/A
BIAS: ↑ / ↓ / “-”
GLOBAL bias: weighted across TF1..TF4
How to read the bias
Per-Timeframe Bias rules (ICT-based, simple)
For each timeframe:
If price is IN an OB (within CALC depth) → bias = OB direction
Else if price is IN a FVG (within CALC depth) → bias = FVG direction
Else fallback to the most recent direction (OB preferred, otherwise FVG)
GLOBAL bias (weighted)
The GLOBAL row uses a weighted sum:
TF1 weight = 1
TF2 weight = 2
TF3 weight = 3
TF4 weight = 4
Score > 0 → bullish global bias
Score < 0 → bearish global bias
Score = 0 → neutral
Chart TF “Guard” (prevents false LTF readings)
TradingView has limitations when requesting very low TF data from a much higher chart timeframe.
To avoid showing incorrect LTF (1m/5m/15m) statuses when you’re on a high chart TF, the script can display a small warning banner and treat certain LTF rows as N/A when appropriate.
Purpose: never show false information.
Recommended usage (most user friendly)
Step 1 — Choose your “Entry TF”
As a rule of thumb (ICT):
The lowest TF in your set should match your entry timeframe, or be close to it.
Examples:
Intraday / Scalping
TF1=1m, TF2=5m, TF3=15m, TF4=1H
(Use chart TF 1m–15m for best LTF accuracy.)
Higher timeframe trading
TF1=1H, TF2=4H, TF3=1D, TF4=1W
(Then you naturally don’t care about 1m/5m.)
Step 2 — Keep your chart clean with SHOW vs CALC
A practical approach:
Max SHOW: 1–2 (clean chart)
Max CALC: 3–10 (more stable bias/table logic)
Main settings (quick explanation)
Timeframes (Rows)
Enable TFx: enable/disable each row timeframe
Show Boxes TFx: show/hide zones for that timeframe
Max SHOW / Max CALC
Max SHOW FVG / OB: visual draw limit
Max CALC FVG / OB: depth used by table and bias
Box Width (Per TF)
HTF bars: width scales by HTF size
Chart bars: fixed width in chart bars
OB Logic
Pivot length (BOS): higher = stricter / fewer OBs
OB lookback: how many HTF bars to search for the OB anchor candle
Notes / limitations
This is a context + confluence tool, not a “signal generator.”
LTF accuracy depends on chart TF; the Guard exists specifically to prevent misleading outputs.
One-line summary
ICT HTF/BIAS: multi-TF ICT PD Arrays + a clean bias table with SHOW vs CALC separation, so you can keep charts minimal while keeping bias logic consistent.

The Samurai by MonedaFX (Beta)🥷🟪 The Samurai By MonedaFX
"The Samurai By MonedaFX" indicator a cutting-edge trading strategy designed to help traders identify precise trades within the markets. Developed exclusively for Moneda Lifestyle LTD, this indicator offers clear entry and exit logic along with stop-loss (SL) and take-profit (TP) templates, enabling traders to practice trading effectively and simplify their trading plan.
🔑 Key Features:
- Trade Generation: Accurately identifies and plots potential buy and sell opportunities following the pre-determined strategy.
- Risk Management: Automatically calculates and displays the stop-loss levels for each trade following the pre-determined strategy.
- Visual Aids: Incorporates graphical buy/sell plots for clear visualisation of every trade.
🌐 Visit us at: monedafx.com
---
How to Use the The Samurai By MonedaFX
1️⃣ 📖 Add the Indicator to Your Chart:
- Open your TradingView chart.
- Click on "Indicators" at the top of the screen.
- Search for "The Samurai By MonedaFX" and add it to your chart.
2️⃣ ⚙️ Select the correct timeframe & pair:
- Choose the 5 minute timeframe.
- Select one of the approved pairs.
3️⃣ 🚦 Follow the strategy:
- Be active inside the MonedaFX Discord Community.
- Watch the full video course on how to use this strategy to it's maximum potential!
---
❗ Important Information ❗
# The Samurai By MonedaFX
📲 Contact Information
- Email: info@monedafx.com
- Phone: +44 7367 106550
- Website: monedafx.com

Price Action ICT SMC - Crypto Lidya (Lite)Price Action • ICT • SMC — Crypto Lidya (Lite)
Short title: PA Lite — Crypto Lidya
ONE CHART. ONE FLOW. TEXTBOOK PA + ICT + SMC.
This is not “more drawings”. It’s a structured, rule-based framework that merges:
Market Structure + Liquidity + Confirmation → into a single decision flow.
Core textbook sequence:
Liquidity → (IDM) → Displacement → CHoCH / BOS → Return to PD / OB / FVG / BPR
Built for traders who want clean context, multi-timeframe discipline, and professional-grade confluence
without turning the chart into a mess.
━━━━━━━━━━━━━━━━━━━━━━━━━━━━━━━━━━━━━━━━━━━
WHAT YOU GET (HIGHLIGHTS)
━━━━━━━━━━━━━━━━━━━━━━━━━━━━━━━━━━━━━━━━━━━
- Market Structure engine: CHoCH + BOS with configurable confirmation logic
- Liquidity context: EQH/EQL sweeps + deterministic “linking” to structure breaks
- HTF Bias (Regime Filter): optional direction gating for cleaner, textbook alignment
- TF Bias Table (Multi-TF dashboard): “at-a-glance” bias stacking with reasons
- PD Range (Premium/Discount): dealing-range alignment filter (OB / FVG or both)
- Displacement filter: impulse-quality confirmation (Body% / ATR / Close-position)
- Killzones / Sessions: time-window validation (London / NY AM / NY PM)
- FVG + BPR: imbalance mapping + balanced range overlap logic
- OB / BB engine: source models, refinement, quality filters, strength scoring, overlap pruning
- Alerts + Webhook-ready output: Human / JSON format, HTF gate, cooldown controls
“Structure + Liquidity + Confirmation in one workflow (no clutter).”
━━━━━━━━━━━━━━━━━━━━━━━━━━━━━━━━━━━━━━━━━━━
QUICK START (RECOMMENDED FLOW)
━━━━━━━━━━━━━━━━━━━━━━━━━━━━━━━━━━━━━━━━━━━
1) Performance
- Set Lookback Window (bars) to match your chart speed/history needs.
- View when “Lookback Window (bars)” is increased (with “Limit to Nearest” OFF / all zones visible).
- View when “Lookback Window (bars)” is decreased (with “Limit to Nearest” OFF / all zones visible).
2) Regime & Multi-TF Context (ICT)
- Enable HTF Bias if you want direction filtering.
- Use TF Bias Table to verify alignment across your chosen timeframes.
3) Timing Filter (Optional)
- Enable Killzones / Sessions to focus on high-liquidity delivery windows.
4) Confirmation Quality
- Enable Displacement filter to reduce range noise / weak breaks.
5) Structure Execution (SMC)
- Use CHoCH / BOS for the “break confirmation” layer.
- Use Buffers / Confirm Modes for stricter or faster validation.
6) Zones & Returns
- Use PD Range to validate where setups “should” form (Premium/Discount).
- Map FVG / BPR and OB / BB for return-to-zone models.
━━━━━━━━━━━━━━━━━━━━━━━━━━━━━━━━━━━━━━━━━━━
MODULES (TEXTBOOK EXPLANATION)
━━━━━━━━━━━━━━━━━━━━━━━━━━━━━━━━━━━━━━━━━━━
1) HTF BIAS (REGIME FILTER)
HTF Bias acts as your directional framework (macro context).
When enabled, signals can be suppressed if they conflict with the HTF direction.
Two professional ways to define bias (you choose via Trend Mode):
A) Swing Structure Bias (HH/HL – LH/LL) — “stable”
- Uptrend requires HH + HL confirmation
- Downtrend requires LL + LH confirmation
- Best when you want fewer, higher-quality flips
B) Legacy / Break of Extreme — “faster”
- Bias can flip as soon as a new pivot breaks the last major extreme
- Best for aggressive / fast markets (but can be noisier)
2) TF BIAS TABLE (MULTI-TIMEFRAME DASHBOARD)
The TF Bias Table is built for disciplined multi-timeframe execution:
- Answers “Are higher TFs aligned?” in seconds
- Helps you avoid taking LTF triggers against HTF context
- Can show reasoning text (optional) to keep the logic transparent
Bias calculation options (Table Bias Mode):
- Swing Structure Bias (HH/HL – LH/LL): more stable, flips later
- Structure-Scope Bias (msStructScope aligned): follows your chosen structure scope and flips faster
Hybrid rule is deterministic:
External dominates; if External is not ready, fallback to Internal.
Provisional Bias (UI only, optional):
- If pivots are not fully confirmed, the table can display a provisional bias based on HTF candle direction
- UI only (does not change signals)
3) PD RANGE (PREMIUM / DISCOUNT)
PD Range defines where price is “dealing” relative to its midpoint (50%):
- Bullish context → Discount is preferred
- Bearish context → Premium is preferred
You can apply PD filtering to:
- OB + FVG (default), OB only, or FVG only
Optional strict mode:
- Require the level/zone to remain fully inside the dealing range (more textbook)
“Discount buys / Premium sells with a clear dealing range reference.”
4) DISPLACEMENT (IMPULSE CONFIRMATION)
Displacement filter keeps breaks “honest”.
CHoCH/BOS confirms only if the break candle shows real intent:
- Body dominance (Body% rule)
- Volatility expansion (ATR multiple rule)
- Close position in break direction (optional strictness)
This is designed to reduce fake breaks in ranges and thin-liquidity periods.
“Impulse-quality break passes; weak range poke fails.”
5) KILLZONES / SESSIONS (TIME-WINDOW VALIDATION)
Session gating is a professional timing filter:
- Validate structure breaks/sweeps only inside enabled windows
- Focus execution during high-liquidity delivery hours (London / NY AM / NY PM)
“Cleaner signals when you trade only the active delivery windows.”
- Normal vs Killzone:
6) MARKET STRUCTURE (CHoCH / BOS)
CHoCH (Change of Character):
- Signals a character shift by breaking a key protected point (optionally)
BOS (Break of Structure):
- Confirms continuation breaks in the current structure direction
Confirmation controls:
- Close / Wick / Body / combined modes
- Optional buffers (Ticks or Percent) to reduce micro-noise
Optional Protected Swing Mode:
- Uses protected HL/LH as reference (closer to classic SMC)
7) LIQUIDITY (EQH/EQL SWEEPS + LINKING)
Liquidity sweeps identify stop-runs / grabs around equal highs/lows:
- Wick Only: faster tagging
- Wick + Close Back: more textbook (grab + rejection)
Link Window (bars) ties a sweep to the next CHoCH/BOS:
- Smaller window = stricter context
- Larger window = more permissive linking
8) FVG + BPR (IMBALANCE & REBALANCE)
FVG (Fair Value Gap):
- Shows active imbalances and mitigation behavior
- Optional size filter (Percent / ATR / Ticks / Absolute)
BPR (Balanced Price Range):
- Overlap zone formed by Bull FVG + Bear FVG
- Used as a confluence zone for rebalance and continuation models
9) OB / BB (ZONES)
Order Blocks (OB):
- Anchored to BOS/CHoCH breaks or derived from displacement candles (source mode)
- Refinement modes: Body / Wick / Mean Threshold
- Optional quality filter (Balanced / Strict, etc.)
- Strength scoring + confluence bonuses (FVG overlap, liquidity context)
- Overlap pruning keeps the chart clean and relevant
Breaker Blocks (BB):
- Derived from invalidated OBs
- Can show inherited strength % (optional)
- Cleanup options preserve performance without deleting open zones
10) ALERTS (REALTIME / WEBHOOK)
- Enable Alerts: master switch
- Choose Human or JSON message format
- Optional gates: HTF Bias alignment, cooldown (anti-spam)
TradingView setup tip:
Use alert condition = “Any alert() function call” for full detail messages.
━━━━━━━━━━━━━━━━━━━━━━━━━━━━━━━━━━━━━━━━━━━
LITE / COMMUNITY ROADMAP (IMPORTANT)
━━━━━━━━━━━━━━━━━━━━━━━━━━━━━━━━━━━━━━━━━━━
This is the free Lite / Community release.
To keep this project sustainable and continue improving it for the community:
- This Lite edition is planned to become limited to 3 symbols in a future update (e.g., BTC / ETH / SOL).
- The full, unrestricted version (all symbols + advanced upgrades) will be released separately as the PRO edition.
You’ll always see clear release notes before major changes.
━━━━━━━━━━━━━━━━━━━━━━━━━━━━━━━━━━━━━━━━━━━
DISCLAIMERS
━━━━━━━━━━━━━━━━━━━━━━━━━━━━━━━━━━━━━━━━━━━
- Educational / analytical tool only. Not financial advice.
- No guarantees. Always manage risk.
- “ICT / SMC” terminology is used as a category reference to commonly known concepts.
This script is not affiliated with any third-party educator or brand.

Inside Bar Detector
Inside Bar & Internal Structure
A precise tool for identifying Inside Bars and tracking price range breakouts with internal market structure visualization.
🎯 What It Does
This indicator detects Inside Bars (consolidation patterns) and classifies how price breaks out of established ranges. It helps traders identify:
• Consolidation zones where price is coiling
• Directional breakouts (up or down)
• Liquidity sweeps where price tests both sides before committing to a direction
📊 Key Features
Inside Bar Detection - Automatically identifies when current bar's range is contained within the previous range
Range Visualization - Draws dashed rectangle boxes around Inside Bar sequences
Breakout Classification - Categorizes breaks as: Break High, Break Low, or Expansion
Sweep Detection - Labels bars that sweep both sides of the range before closing directionally
Internal Structure Lines - Connects swing highs and lows to visualize market structure
Statistics Panel - Real-time count of Inside Bars and breakout types
🔧 How It Works
1. Price Range Tracking : The indicator maintains a dynamic price range (high/low) that updates on each breakout
2. Inside Bar Logic : A bar is classified as Inside Bar when its high ≤ range high AND low ≥ range low
3. Breakout Detection :
• Break High : Price closes above the range (bullish)
• Break Low : Price closes below the range (bearish)
• Sweep : Price tests both sides but closes directionally (labeled as Sweep↑ or Sweep↓)
• Expansion : Price breaks both sides but closes in the middle (neutral)
⚙️ Settings
Display Settings
- Show Inside Bar Box: Toggle rectangle visualization
- Show Statistics: Display count panel
- Show Sweep Labels: Mark liquidity sweep events
Internal Structure Settings
- Show Internal Structure Lines: Connect swing points
- Line Color & Width: Customize appearance
Color Settings
- Inside Bar Box Color & Transparency
📈 How To Use
• Trend Continuation : Look for Inside Bars forming after a strong move, then trade the breakout in the trend direction
• Reversal Setups : Watch for sweep patterns (Sweep↑/Sweep↓) at key levels - these often indicate liquidity grabs before reversals
• Structure Analysis : Use internal structure lines to identify the current market bias
⚠️ Alerts
The indicator includes 4 alert conditions:
• Inside Bar Detected
• Break High (includes bullish sweeps)
• Break Low (includes bearish sweeps)
• Dual Expansion (neutral)
📋 Notes
• Works on all timeframes and instruments
• Consecutive Inside Bars are merged into a single box for cleaner visualization
• Internal structure lines ignore Inside Bars to reduce noise

Daytrading Suite: Neon TPO + FVG v6.1Here is the summary of the code and the trading guide in English.
---
### 1. Code Summary: What does the chart show?
The script combines three dimensions of trading into a single chart:
* **The Context (TPO / Market Profile - Yesterday):**
* **Gold Zone (Center):** Yesterday's **POC (Point of Control)**. This was the "fairest price". It often acts as a magnet.
* **White Dashed Lines:** The **VAH (Value Area High)** and **VAL (Value Area Low)**. Yesterday, 70% of all trading volume happened between these lines. This is the area of "Balance".
* **The Structure (HTF - 1 Hour+):**
* **Red/Green Boxes (Right Edge):** Automatic **Supply & Demand Zones** based on the 1-hour chart (or your setting). They indicate major resistance and support levels.
* **The Timing (Entries):**
* **Neon FVG Boxes (Small):** "Fair Value Gaps". These represent imbalances in price. If price revisits these, it is often your **entry signal**.
* **Lines (VWAP, EMA, PDH/PDL):** Act as dynamic support and trend indicators.
---
### 2. Trading Strategy: How to use it
Do not just trade every colored spot. You must combine **Location (TPO)** with **Signal (FVG)**.
#### Step A: The Open (Where are we?)
In the morning (or at the US Open), check where the price is relative to the **white TPO lines**.
1. **Inside the White Lines (In Balance):**
* The market is undecided. Expect ranging/choppy behavior.
* **Strategy:** Buy at the bottom edge (VAL), Sell at the top edge (VAH). The target is often the Gold Zone (POC) in the middle.
2. **Outside the White Lines (Imbalance):**
* The market is seeking new prices. Danger of a Trend!
* **Strategy:** If price breaks above VAH and tests it from above -> **Long**. If it breaks below VAL -> **Short**.
#### Step B: The Setup (The High Probability Scenario)
Here is the "Rejection" Setup (Long Example):
1. Price drops to the lower white line (**VAL**) or into a green **Demand Zone**.
2. It bounces (shows a wick).
3. In the process, a small **green Neon FVG** is formed.
4. **Entry:** Limit Order at the top of the Neon FVG.
5. **Target:** The Gold Zone (POC) or the upper white line (VAH).
6. **Stop Loss:** Below the recent swing low.
#### Step C: Warning Signals (When NOT to trade)
* **In "No Man's Land":** If the price is sitting right in the middle between Gold (POC) and White (VAH/VAL), do nothing. The risk is 50/50. Wait until price hits an edge.
* **Against the Flow:** If EMA 9 and 21 are pointing steeply downwards, do not buy blindly at the VAL just because the line is there. Wait for confirmation (FVG).
### Pre-Trade Checklist:
1. **Level:** Am I at a white line (VAH/VAL) or the Gold Zone (POC)?
2. **Structure:** Do I have an HTF Demand/Supply Zone backing me up?
3. **Trigger:** Do I see a Neon FVG pointing in my direction?

Smart Risk - Three Institutional Models📘 Smart Risk – Three Institutional Entry Models
A precision-engineered institutional framework that blends liquidity, structure, and multi-time-frame confirmation.
🧠 Concept Overview
The Smart Risk indicator models how institutional traders and algorithms engineer entries around liquidity, imbalance, and structural shifts .
It unifies t hree distinct institutional entry models —each built around core Smart Money Concepts (SMC)—and enhances them with a Multi-Time-Frame Confluence (MTF) engine for directional alignment.
This tool doesn’t simply merge indicators.
It connects l iquidity sweeps, order-block reactions, breaker validation, and fair-value-gap mitigation into one cohesive trading logic—filtering every setup through trend, structure, and volume confirmation.
⚙️ How It Works
Setup #1 – Liquidity Sweep + Order Block Revisit + FVG Mitigation
Identifies engineered stop-hunts where price sweeps external liquidity and returns to a prior Order Block or Fair Value Gap (FVG).
Signals reversal-style entries with high probability of mean-reversion or mitigation.
Setup #2 – Supply/Demand + Mitigation / Breaker / FVG Continuation
Captures continuation trades inside trending structure.
When trend bias (via moving-average context) aligns with breaker or mitigation blocks, signals confirm institutional continuation sequences.
Setup #3 – Sweep + Classic FVG Reaction
Tracks clean displacement gaps following a liquidity sweep—ideal for scalpers and intraday reversals where imbalances act as magnets for price.
Each setup can be independently enabled or disabled from the panel.
A built-in signal-cooldown prevents repetitive triggers on the same leg.
🕒 Multi-Time-Frame Confluence
The new MTF module aligns lower-time-frame precision entries with higher-time-frame market structure.
When enabled, each setup only validates if the HTF trend confirms the same directional bias as the LTF pattern—e.g. a 5-minute bullish FVG signal requires a bullish 1-hour structure.
This ensures institutional logic respects global liquidity flow and avoids counter-trend traps.
MTF Controls:
• ✅ Enable MTF Confluence toggle
• ⏱️ Lower Time-Frame (LTF) selector (default 5 min)
• ⏱️ Higher Time-Frame (HTF) selector (default 1 hour)
• 🔄 Automatic SMA-based HTF trend detection
🎨 Visualization & Dashboard
• Order Block / Supply–Demand Zones — highlight institutional footprints
• Fair Value Gaps (FVGs) — reveal displacement inefficiencies
• Liquidity Sweeps (X / $) — mark engineered stops
• BOS & CHoCH — confirm structure continuation or reversal
• Compact Dashboard — live “Armed” state for each setup and MTF bias
Color-coded background cues emphasize active trade phases without clutter.
🧩 Core Algorithm Highlights
• Dynamic swing and pivot structure detection
• Breaker / Mitigation / Volume confirmation filters
• Fair-Value-Gap logic with directional alignment
• Cooldown control for signal throttling
• Multi-Time-Frame bias filter for contextual precision
⸻
📈 How to Use
1. Apply indicator to any asset or timeframe.
2. Select which institutional setups you want active.
3. Optionally enable MTF Confluence (5 min → 1 hr recommended).
4. Wait for BOS/CHoCH confirmation + zone alignment before entry.
5. Use OB and FVG zones for entry/exit planning with risk management.
⸻
💡 Originality Statement
This script introduces a multi-layered institutional logic engine that merges liquidity, mitigation, and imbalance behavior into a unified framework—augmented with time-frame synchronization and signal-cooldown management.
All logic, calculations, and visualization structure were built from scratch for this model.
It is not a mash-up of existing public indicators and offers measurable analytical value through MTF-aware trade validation.
⸻
⚠️ Disclaimer
This tool is intended for educational and analytical purposes only.
It does not provide financial advice or guaranteed trading outcomes.
Always back-test, validate setups, and apply proper risk management.

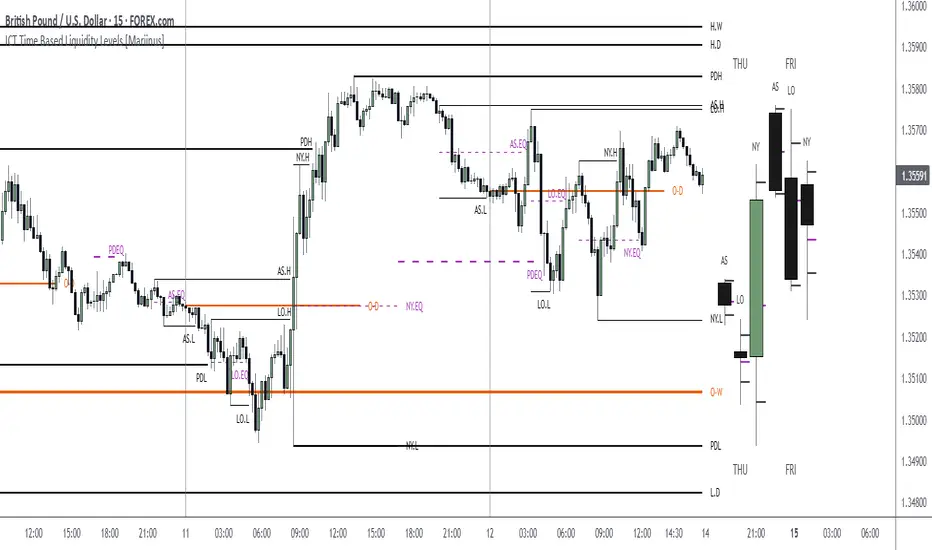
ICT Time Based Liquidity Levels [Mariinus]Indicator Overview – Inspired by ICT Concepts
This indicator helps you spot where liquidity rests and where major price moves are likely to begin or end — giving you clarity for both entries and exits.
Inspired by the teachings of the Inner Circle Trader (ICT), this tool builds on his philosophies and principles that have reshaped how traders view price action. One of the most powerful lessons that stuck with me personally is his quote:
"Time & Price, where it is Time first and then Price”
Another fundamental concept that underpins this tool is the idea that:
"Price is constantly moving in cycles from Premium to Equilibrium, from Equilibrium to Discount from Discount back to Premium."
With these core ideas in mind, this indicator was developed to help traders who are already using an ICT-based framework and focus on Kill Zones and by this on Time Based Liquidity.
In addition to plotting Session Highs and Lows on your chart, the ICT Time Based Liquidity Levels indicator also includes derived levels that provide deeper market insight. These include the Equilibrium of the full Session Range (High to Low) as well as the Equilibrium of the Wicks – offering a more nuanced view of price balance and potential turning points, in line with ICT’s core concepts.
To make sure your chart is not cluttered with lines, you can select which levels to show – and more importantly – you can plot Session Candles next to your Chart. Unlike standard time-based candles (e.g. 4H candles), these are “true” Session Candles that reflect the actual OHLC of trading Sessions, making it easier and clearer to see how Sessions interact with each other.
Next to Intraday Highs and Lows, the indicator will also plot Daily and Weekly Liquidity Pools above and below the Market, giving you insights to where Price is most likely heading towards.
You can set Alerts that trigger whenever one of these key levels is tagged, so you stay focused without staring at the screen all day.
⚠️ Important Disclaimer:
This is not a standalone trading plan.
This is not a buy or sell signal generator.
Instead, this tool is designed to support traders who follow ICT principles by helping them identify higher-probability PD Arrays – the key levels where setups are more likely to occur. If your trading plan includes looking for specific PD Arrays and structural frameworks taught by ICT, then this indicator is a visual aid to refine and focus your attention on the areas where your framework has a higher probability of playing out.
⚙️ Explanation of the Settings
You can combine up to 6 Sessions to monitor their respective levels while operating on a lower timeframe. You can define the timings and a long and short naming of those Sessions.
In the Days Section you can Set a lookback period to control how far back you want to calculate levels. Next to that you can select which Daily and or Weekly Levels you want to have shown on your Charts together with choosing their coloring, style and width.
In the Candles Section you can define how the Session Candles will look like which are plotted next to your Chart. When you have multiple Days of Session Candles it can come in handy to mirror image the Candles which will plot the Candles from right to left instead of the default left to right. In addition you can control how far the distance is between the Candles and your chart, the distance between Candles and Days and the thickness of those Candles. Next you can show or hide the Equilibrium of the total Session Range and the Equilibrium of the Wicks.
In the Lines Section you can specify which Session Levels you want to see on your Chart together with choosing their coloring, style and width.
In the Labels Section you can specify which Labels you want to show and how you want to show them.
In the Openings Section you can specify to show the Midnight Open and or Weekly Open. In addition you can add a divider to be able to distinguish between multiple Days or Weeks.
In the Alert Section you can specify for which Sessions you want to get notified when Key Levels are tagged. After setting this up, you need to set an alert via the Tradingview Alert function to really activate the Alert Function. Be aware that when you change your Alert setup, you need to setup the Tradingview Alert function again.
💡 Example Use Cases
These examples are for educational purposes only. This tool is not financial advice and should always be used in conjunction with your own trading plan—whether it involves Fair Value Gaps, Order Blocks, or a custom combination of ICT-based elements.
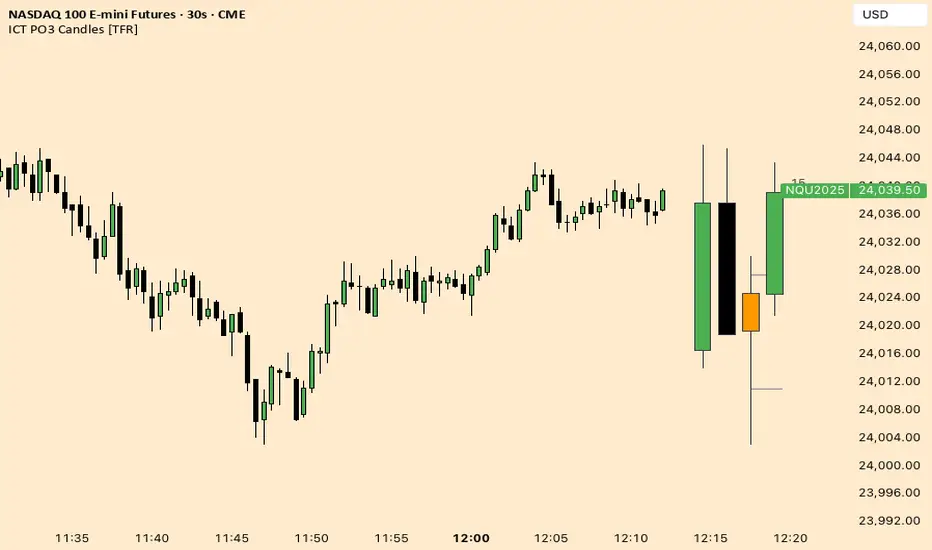
ICT Fractal HTF Candles [TFR]ICT HTF Fractal Candles
This indicator overlays higher timeframe (HTF) candles directly on your current chart for better multi-timeframe analysis. It plots up to the last 4 candles from a user-selected timeframe (5m, 15m, 1h, 4h, or 1D) with customizable body and border colors.
Features:
Displays the last 4 higher timeframe candles (open, high, low, close) on your current chart.
Customizable bullish, bearish, and inside close candle colors.
Optional midpoint wick lines (top and bottom) for precision reference, with extendable length for clarity.
Optional candle midpoint line for additional confluence.
Overlay mode allows you to see HTF structure without switching chart timeframes.
Timeframe label display so you always know which HTF is being plotted.
Offset control for shifting candle position.
Use Case:
This tool helps traders apply ICT concepts like PO3, midpoint reference levels, and multi-timeframe confirmation without constantly switching between charts. It’s particularly useful for identifying liquidity zones, midpoint reactions, and higher timeframe market structure while executing on a lower timeframe.
SMC Suite - OB . Breaker . Liquidity Sweep . FVGSMC Suite — Order Blocks • Breaker • Liquidity Sweep • FVG
What it does:
Maps institutional SMC structure (OB → Breaker flips, Liquidity Sweeps, and 3-bar FVGs) and alerts when price retests those zones with optional r ejection-wick confirmation .
Why this isn’t “just a mashup”?
This tool implements a specific interaction between four classic SMC concepts instead of only plotting them side-by-side:
1. OB → Breaker Flip (automated): When price invalidates an Order Block (OB), the script converts that zone into a Breaker of opposite bias (bullish ⇄ bearish), extends it, and uses it for retest signals.
2. Liquidity-Gated FVGs : Fair Value Gaps (3-bar imbalances) are optionally gated—they’re only drawn/used if a recent liquidity sweep occurred within a user-defined lookback.
3. Retest Engine with Rejection Filter : Entries are not whenever a zone prints. Signals fire only if price retests the zone, and (optionally) the candle shows a rejection wick ≥ X% of its range.
4. Signal Cooldown : Prevents spam by enforcing a minimum bar gap between consecutive signals.
These behaviors work together to catch the sequence many traders look for: sweep → impulse → OB/FVG → retest + rejection.
Concepts & exact rules
1) Impulsive move and swing structure
• A bar is “ impulsive ” when its range ≥ ATR × Impulsive Mult and it closes in the direction of the move.
• Swings use Pivot Length (lenSwing) on both sides (HH/LL detection). These HH/LLs are also used for sweep checks.
2) Order Blocks (OB)
• Bullish OB : last bearish candle body before an i mpulsive up-move that breaks the prior swing high . Zone = min(open, close) to low of that candle.
• Bearish OB : last bullish candle body before an impulsive down-move that breaks the prior swing low . Zone = high to max(open, close).
• Zones extend right for OB Forward Extend bars.
3) Breaker Blocks (automatic flip)
If price invalidates an OB (closes below a bullish OB’s low or above a bearish OB’s high), that OB flips into a Breaker of opposite bias:
• Invalidated bullish OB → Bearish Breaker (resistance).
• Invalidated bearish OB → Bullish Breaker (support).
Breakers get their own style/opacity and are used for separate Breaker Retest signals.
4) Liquidity Sweeps (decluttered)
• Bullish sweep : price takes prior high but closes back below it.
• Bearish sweep : price takes prior low but closes back above it.
Display can be tiny arrows (default), short non-extending lines, or hidden. Old marks auto-expire to keep the chart clean.
5) Fair Value Gaps (FVG, 3-bar)
• Bearish FVG : high < low and current high < low .
• Bullish FVG : low > high and current low > high .
• Optional gating: only create/use FVGs if a sweep occurred within ‘Recent sweep’ lookback.
6) Retest signals (what actually alerts)
A signal is true when price re-enters a zone and (optionally) the candle shows a rejection wick:
• OB Retest LONG/SHORT — same-direction retest of OB.
• Breaker LONG/SHORT — opposite-direction retest of flipped breaker.
• FVG LONG/SHORT — touch/fill of FVG with rejection.
You can require a wick ratio (e.g., bottom wick ≥ 60% of range for longs; top wick for shorts). A cooldown prevents back-to-back alerts.
How to use
1. Pick timeframe/market : Works on any symbol/TF. Many use 15m–4h intraday and 1D swing.
2. *Tune Pivot Length & Impulsive Mult:
• Smaller = more zones and quicker flips; larger = fewer but stronger.
3. Decide whether to gate FVGs with sweeps : Turn on “Require prior Liquidity Sweep” to focus on post-liquidity setups.
4. Set wick filter : Start with 0.6 (60%) for cleaner signals; lower it if too strict.
5. Style : Use the Style / Zones & Style / Breakers groups to set colors & opacity for OB, Breakers, FVGs.
6. Alerts : Add alerts on any of:
• OB Retest LONG/SHORT
• Breaker LONG/SHORT
• FVG LONG/SHORT
Choose “Once per bar close” to avoid intrabar noise.
Inputs (key)
• Swing Pivot Length — swing sensitivity for HH/LL and sweeps.
• Impulsive Move (ATR ×) — defines the impulse that validates OBs.
• OB/FVG Forward Extend — how long zones project.
• Require prior Liquidity Sweep — gate FVG creation/usage.
• Rejection Wick ≥ % — confirmation filter for retests.
• Signal Cooldown (bars) — throttles repeated alerts.
• Display options for sweep marks — arrows vs short lines vs hidden.
• Full color/opacity controls — independent palettes for OB, Breakers, and FVGs (fills & borders).
What’s original here
• Automatic OB → Breaker conversion with separate retest logic.
• Liquidity-conditioned FVGs (FVGs can be required to follow a recent sweep).
• Unified retest engine with wick-ratio confirmation + cooldown.
• Decluttered liquidity visualization (caps, expiry, and non-extending lines).
• Complete styling controls for zone types (fills & borders), plus matching signal label colors.
🔹 Notes
• This script is invite-only.
• It is designed for educational and discretionary trading use, not as an autotrader.
• No performance guarantees are implied — always test on multiple markets and timeframes.

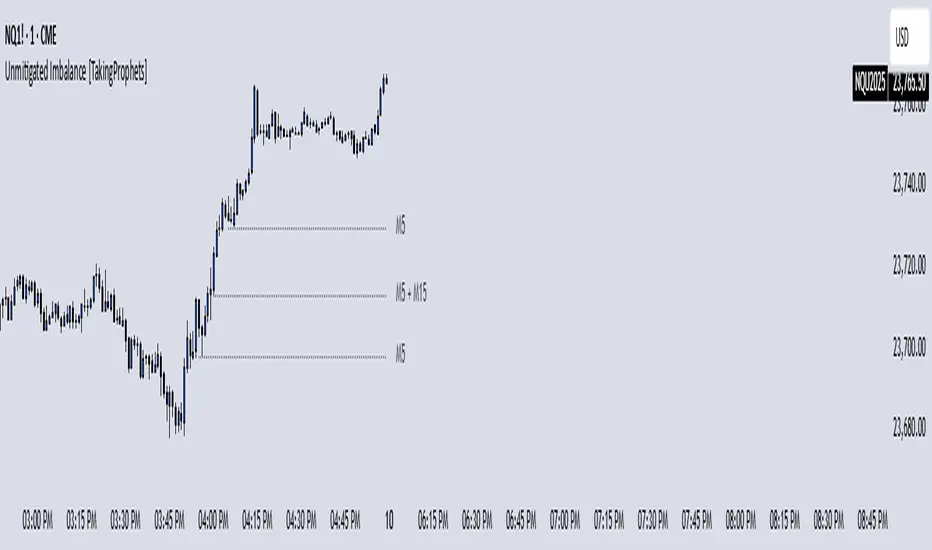
Unmitigated Imbalances [TakingProphets] (High Timeframe)Unmitigated Imbalances
Unmitigated Imbalance is designed to automatically detect and display active Fair Value Gaps (FVGs) across multiple higher timeframes and your current chart. It only keeps the ones that remain unmitigated, helping you clearly see where price has “unfinished business” and potential liquidity draw areas. The tool extends these levels forward until they are tagged according to your chosen mitigation criteria, then removes them automatically.
The indicator uses the classic 3-bar FVG structure:
– Bearish FVG forms when the low of the third candle back is above the high of the first candle.
– Bullish FVG forms when the high of the third candle back is below the low of the first candle.
– Each detected gap must meet a minimum size threshold, which is determined automatically from the Sensitivity setting and adjusted for the symbol type.
Higher timeframes (up to 4) can be plotted simultaneously with your current chart’s gaps. The script merges overlapping levels from different timeframes into one clean label, showing all the contributing timeframes together (for example: M15 + H1 + H4). This makes it easy to spot high-confluence levels without cluttering your chart.
Key features
– Multi-timeframe detection: up to 4 custom HTFs plus your current chart.
– Automatic gap size filtering based on chosen Sensitivity (High, Medium, Low).
– Choice of Wick or Close-based mitigation logic.
– Lookback control: 1 Day, 1 Week, 1 Month, or Max.
– Combined labels for overlapping gaps with clear timeframe tags.
– Separate color and style settings for each timeframe’s bullish and bearish gaps.
– Labels can be positioned Left, Right, or Center Above for maximum clarity.
– Automatic line extension until mitigation or until they exceed the lookback period.
How to use
Select your desired higher timeframes in the HTF1–HTF4 settings.
Choose the Sensitivity level to control the minimum gap size detected.
Decide on Wick or Close mitigation according to your trading rules.
Use the Lookback setting to limit how far back the script checks for gaps.
Watch for levels where multiple timeframe labels are stacked — these can carry greater significance.
Incorporate the levels into your existing strategy, using them as context rather than entry signals.
Practical notes
– Current timeframe gaps reset each trading day to keep the chart relevant to intraday bias.
– Higher timeframe gaps remain until mitigated or until the lookback period expires.
– Large lookback periods with multiple HTFs can increase chart load — adjust settings as needed.
– This indicator is a mapping and context tool, not a signal generator. Always apply it alongside your own analysis.
SMC Pro - Smart Money Concepts🎯 SMC Pro - Complete Smart Money Concepts Trading System with Trade Alerts
The Most Comprehensive SMC/ICT Indicator Built for Real Traders
After extensive research into what retail and prop firm traders actually need, I've created SMC Pro - a complete Smart Money Concepts indicator that solves the biggest problems with existing SMC tools.
🚀 What Makes This Different:
✅ COMPLETE TRADE SETUP ALERTS - Not just structure breaks! Get full trade setups with:
* Entry, Stop Loss & Target Prices
* Risk/Reward Calculations
* 5-Point Confluence Scoring
* Visual Trade Labels on Chart
✅ INTELLIGENT FILTERING - No more chart spam:
* Minimum structure size filter (ATR-based)
* Minimum bars between signals
* Volume confirmation for order blocks
* Clean, actionable signals only
📊 Core Features:
1. Market Structure Analysis
* Break of Structure (BOS) with smart filtering
* Change of Character (CHoCH) detection
* Clear directional bias identification
* Prevents excessive signal clustering
2. Order Blocks
* Volume-confirmed institutional zones
* Automatic mitigation tracking
* Entry points for trade setups
3. Fair Value Gaps
* ATR-based size filtering
* Automatic fill detection
* Confluence factor for trades
4. Liquidity Zones
* Buy-side & Sell-side liquidity mapping
* Sweep detection with alerts
* Target zones for trades
5. Risk Management Integration
* Automatic R:R calculation
* Position sizing guidance
* Minimum R:R filtering (default 2:1)
🎯 5-Point Trade Confluence System:
1. Market structure alignment
2. Recent structure break (BOS/CHoCH)
3. Order block at current price
4. Fair value gap support
5. Liquidity target available
Minimum score of 3/5 required for trade alerts (adjustable)
⚙️ Smart Settings:
* Swing Length: 10 (default) - adjust for sensitivity
* Min Bars Between Signals: 20 - prevents clustering
* Min Structure Size: 1.0 ATR - filters noise
* Min Confluence Score: 3/5 - quality control
* Target R:R: 2:1 minimum - proper risk management
📱 Alert Types:
* 🎯 Trade Setup Alerts - Complete entry/exit plans
* ✅ Structure Breaks - BOS & CHoCH notifications
* 📊 Order Block Touch - Price at key zones
* 💧 Liquidity Sweeps - Stop hunts detected
💡 Pro Tips:
* Start with default settings
* Use on 15m+ timeframes for cleaner signals
* Increase confluence requirement for prop firm trading
* Enable volume confirmation for higher quality OBs
* Dashboard shows real-time setup status
🔧 If You Get Too Many Signals:
* Increase Swing Length to 15-20
* Increase Min Bars Between to 30-50
* Increase Min Structure Size to 1.5 ATR
* Raise Min Confluence Score to 4 or 5
This indicator is the result of solving real problems traders face with SMC/ICT concepts. It's designed to give you clean, actionable trade setups - not just mark up your chart with zones.
Built with Pine Script v6 for maximum performance and reliability.
Trade with confluence. Trade with confidence. Trade smart. 🎯

FVG 9:31–10:00 AM ETFVG 9:31–10:00 AM ET - Script Description
What This Script Does
This indicator finds **Fair Value Gaps (FVGs)** that form during the first 29 minutes of the U.S. stock market (9:31 AM to 10:00 AM Eastern Time). A Fair Value Gap is a price imbalance where there's a gap between candles that often becomes an important support or resistance level.
Key Features:
- **Time Window**: Only looks for FVGs between 9:31-10:00 AM ET (most important opening period)
- **One Per Day**: Finds only the first FVG that forms in this time window each day
- **Visual Display**: Draws a purple box around the gap with a clear "FVG" label
- **Price Tracking**: Monitors when price comes back to test the gap level
- **Alert System**: Sends notifications when price returns to the FVG zone
How FVGs Are Detected:
- **Bullish FVG**: When there's a gap up (low of middle candle is above high of 3rd candle back)
- **Bearish FVG**: When there's a gap down (high of middle candle is below low of 3rd candle back)
The 9:31-10:00 AM window is chosen because this is when institutions and algorithms create their biggest price moves right after market open, making these gaps very reliable.
Customization Options
User Settings
Extend FVG Box (Bars)
- **What it does**: Makes the purple box longer to the right
- **Default**: 0 (box ends right after the gap forms)
- **Options**: Any number from 0 to 100+
- **When to use**:
- Keep at 0 for clean historical view
- Set to 10-20 to track the gap during the current session
- Set higher for longer reference
Code Settings (Can Be Changed)
Time Window
- **Start**: 9:31 AM Eastern Time
- **End**: 10:00 AM Eastern Time
- **Can modify**: Change the hour/minute numbers in the code
Visual Style
- **Color**: Purple with see-through background
- **Label**: Shows "FVG" text in white
- **Can modify**: Change colors and transparency in the code
How to Use:
Setup
Chart Settings
1. Use 1-minute, 5-minute, or 15-minute charts (works best on these timeframes)
2. Apply to liquid markets like ES, NQ, major stocks, or forex pairs
3. Set the "Extend FVG Box" to your preference (start with 0 or 10)
What You'll See
- A purple box appears when an FVG forms during 9:31-10:00 AM
- Box shows the exact price levels of the gap
- "FVG" label appears on the box
- Only one FVG per day will be marked
Trading Strategies
Basic FVG Trading
1. **Wait for Formation**: Let the purple box appear during 9:31-10:00 AM
2. **Watch Price Movement**: See if price moves away from the gap
3. **Enter on Retest**: When price comes back to the purple box area, consider entering
4. **Trade Direction**:
- Bullish FVG = look for long opportunities when price retests
- Bearish FVG = look for short opportunities when price retests
Entry Methods
- **Bounce Play**: Enter when price touches the FVG box and bounces away
- **Break Play**: Enter if price strongly breaks through the FVG box
- **Rejection Play**: Enter opposite direction if price gets rejected at the FVG
Risk Management
Stop Losses
- Place stops just outside the FVG box (a few ticks beyond the gap)
- If trading a bounce, stop goes on opposite side of the gap
- If trading a break, stop goes back inside the gap
Position Sizing
- Start small until you understand how FVGs work in your market
- Bigger gaps = smaller position size (more risk)
- Smaller gaps = can use larger position size
Profit Targets
- Take profits at obvious levels like round numbers, previous highs/lows
- Consider taking half profits at 1:1 risk/reward ratio
- Let some position run if the move is strong
Best Practices
When It Works Best
- High-volume stocks and futures (ES, NQ work great)
- Normal market days without major news during the 9:31-10:00 window
- When there's clear institutional activity in the opening period
When to Be Careful
- Low-volume stocks or markets
- Major economic news releases during the time window
- Market holidays when volume is low
- Very choppy or sideways days
Alert Usage
- The script will alert you when price comes back to test the FVG
- Don't trade the alert blindly - always check the current market situation
- Use the alert as a heads-up to start watching the setup more closely
Tips for Success
- The earlier the FVG forms in the 9:31-10:00 window, often the more significant it is
- FVGs that form with high volume are usually more reliable
- Always consider the overall market direction - don't fight the main trend
- Practice on paper first to understand how FVGs behave in your chosen market
🔗 Works Best With:
✅ Liquidity Levels — Smart Swing Lows: Spot key structural lows that can fuel stop hunts and reversals.
✅ ICT Turtle Soup — Liquidity Reversal: Add a classic reversal pattern to your toolkit to catch fakeouts cleanly.
✅ ICT SMC Liquidity Grabs and OBs- Liquidity Grabs, Order Block Zones, and Fibonacci OTE Levels, allowing traders to identify institutional entry models with clean, rule-based visual signals.
This script is most valuable for day traders who want to catch institutional moves right after market open, but it can also help swing traders identify important intraday levels.
✅ ICT Macro Zones (Grey Box Version)- It tracks real-time highs and lows for each Silver Bullet session.
✅ Weekly Opening Gap (cryptonnnite)

Midnight 30min High/LowMidnight 30min High/Low — Overnight Liquidity Range Tracker
Capture the Overnight Session: A Strategic Level Identification Tool from Professional Trading Methodology
This indicator captures the high and low prices during the critical 30-minute midnight session (12:00-12:30 AM EST) and projects these levels forward as key support and resistance zones. These overnight ranges often contain significant liquidity and serve as crucial reference points for intraday price action, representing areas where institutional activity may have established important levels.
🔍 What This Script Does:
Identifies Critical Overnight Session Levels
- Automatically detects the 12:00-12:30 AM EST session window
- Captures the highest and lowest prices during this 30-minute period
- Projects these levels forward for multiple trading days
Creates Dynamic Support/Resistance Zones
- Extends midnight high/low levels as horizontal lines with customizable projection periods
- Fills the area between high and low to create a visual trading range
- Updates automatically each trading day with new overnight levels
Provides Clear Visual Reference Points
- Optional session start markers (●) highlight when the midnight session begins
- Color-coded lines distinguish between high and low levels
- Transparent fill area creates an easy-to-identify trading zone
Real-Time Level Tracking
- Updates levels in real-time during the active midnight session
- Maintains historical levels for reference and backtesting
- Compatible with data window for precise level values
⚙️ Customization Options:
Extend Days (1-30):** Control how many days forward the levels are projected (default: 5 days)
High Line Color:** Customize the midnight high line color (default: blue)
Low Line Color:** Customize the midnight low line color (default: orange)
Fill Color:** Adjust the transparency and color of the range area (default: light aqua, 80% transparency)
Show Session Markers:** Toggle yellow session start indicators on/off (default: enabled)
💡 How to Use:
Deploy on lower timeframes (1m-15m) for precise level identification and reaction monitoring**
Watch for key price interactions:
- Rejection at midnight high levels (potential resistance)
- Bounce from midnight low levels (potential support)
- Range-bound trading between the high and low levels
Combine with liquidity concepts:
- Monitor for stop hunts above/below these levels
- Look for false breakouts that snap back into the range
- Use as confluence with other ICT concepts like FVGs and Order Blocks
Strategic Applications:
- Range trading between midnight levels
- Breakout confirmation when price closes decisively outside the range
- Support/resistance validation for entry and exit planning
🔗 Combine With These Tools for Complete Market Structure Analysis:
✅ First FVG — Opening Range Fair Value Gap Detector.
✅ ICT Turtle Soup (Liquidity Reversal)— Spot stop hunts and false breakout scenarios
✅ ICT Macro Zones (Grey Box Version)- It tracks real-time highs and lows for each Silver Bullet session
✅ ICT SMC Liquidity Grabs and OBs- Liquidity Grabs, Order Block Zones, and Fibonacci OTE Levels, allowing traders to identify institutional entry models with clean, rule-based visual signals.
Together, these tools create a comprehensive Smart Money Concepts (SMC) framework — helping traders identify, anticipate, and capitalize on institutional-level price movements with precision and confidence during critical overnight sessions.

TradeJorno - Time + Price Levels
Tired of manually drawing and updating important ICT or SMC time and price levels on your charts every day?
Here’s an indicator to draw important TIME and PRICE levels automatically.
Here’s what you can highlight in realtime on your charts:
1. Previous major highs and lows
⁃ Previous daily and weekly highs and low
- Weekly dividing lines
2. Session highs/lows
⁃ Plot the high and low of Asia and London sessions.
⁃ Customise the timeframe and appearance on the chart.
- Previous session settlement price.
3. Various price levels
⁃ Pre-market opening prices : midnight, 7:30 and 8:30
⁃ Regular market opening prices: 9:30, 10:00, 14:00
- end of session settlement prices
4. Market opening range high and low
⁃ Lines extending throughout the current session
⁃ Customise the timeframe and appearance on the chart.
5. ICT Macro times
- Draw customisable vertical lines and labels to indicate the start of each ICT macro
period.
Let us know in the comments below if there’s anything else we need to add!

Plyo Tap'n'Slap (TnS) by OutOfOptionsThe Model
This Strategy/Model takes advantage of the strongest trend signature in the market, which is also the most basic move in the market. This basic move is what most traders consider to be a staircase, or trendline. ICT traders call this setup a “unicorn” which is just another word for when an Order block overlaps with an FVG. The beauty of this model is that you don't need to know what ANY of these things are.
The entry comes when a candles High or Low overlaps with a FVG that is at least 3 points away from both edges of the FVG. If the candle is too close to the edge then the setups is invalid (see rules for more). TO find a candle that overlaps with the FVG it also can not cut through any other price action, for example, A potential entry cant cut through another wick to make it overlap with the FVG. (see rules for more)
TnS gets its TP by analyzing what is called the "OG TP" The OG TP is determined by looking for the first tapped into the FVG, then looking for an immediate High or Low to the left of the candle that first tapped the FVG. IF there is no immediate High or low next to the candle that first tapped the FVG, then target the candle itself (see rules for more). IF the "OG TP" has already been hit before TnS gets its entry, then look to the left of the TnS entry candle for the immediate High or Low next to it. If there is no immediate High or Low next to the TnS Entry candle, then target the Entry candles, High or Low (see rules for more)
Model Rules
Overlapping H/L MUST be at least 3 points away from both edges of the FVG,
Overlapping H/L cannot cut through PA to make it overlap with the FVG,
Entries can only be the highest overlapping high or the lowest overlapping low,
If TnS Has already played out within the FVG then it should no longer be used,
If the FVGs OG TP has already been hit then use the TnS entry to re-align for your target,
No using NWOGs/NDOGs for setups. A NWOG is NOT the same thing as an FVG so this example
V2 Rules
If its a Bullish FVG then you need a bearish candle H/L that overlaps for your entry
If its a Bearish FVG then you need a bullish candle H/L that overlaps for your entry
Indicator Functionality
The indicator uses specific logic to identify FVGs that match the requirements of the TnS model, ensuring at least one valid entry exists per the default V1 rules of the model, or the stricter V2 rules if configured via settings. If entries (up to 2 per model rules) are identified, the FVG is highlighted, and each entry and its stop loss is marked with a line. The line styles, colors, and FVG color, which can vary depending on whether the entry is bullish or bearish, are configurable via settings.
Once the FVG is tapped into, the indicator will highlight the take profit spot and list all applicable entries, stop losses, and take profits in a table, the position and presence of which can be controlled within the indicator settings. When price action hits either stop loss or take profit, all elements are removed from the chart to avoid clutter.
Additionally, the indicator allows filtering of entries based on Risk/Reward (R:R), filtering out entries where take profit is less than the model stop loss and entries for which the stop loss resides inside the FVG itself. To help visualize setups where the FVG is outside the current visual range, the indicator has options to extend the FVG box and lines by a configurable number of bars. Once the FVG is tapped, the indicator will automatically extend lines/FVG box to the bar that tapped the FVG plus the configured number of bars.

ICT SMC Liquidity Grabs and OBsICT SMC Liquidity Grabs + Order Blocks + Fibonacci OTE Levels
A High-Probability Entry Engine for Smart Money Concept Traders
This script combines three powerful Smart Money Concepts (SMC) into a single tool: Liquidity Grabs, Order Block Zones, and Fibonacci OTE Levels, allowing traders to identify institutional entry models with clean, rule-based visual signals.
It’s designed to simplify SMC trading by highlighting confluence zones where price is likely to reverse or continue — with clear visual zones, entry arrows, and take profit projections.
🔍 What This Script Does:
Detects Liquidity Grabs
Identifies when price sweeps above/below the highest high or lowest low within a user-defined lookback period and closes back inside.
Plots orange labels on the chart to signal potential liquidity events (LG-H / LG-L).
Plots Order Blocks After Liquidity Grabs
After a liquidity grab, the script looks for displacement candles (strong bullish or bearish moves) and draws highlighted OB zones extending several bars to the right.
These zones represent potential institutional footprints for price reversals.
Draws Fibonacci OTE Levels (Optimal Trade Entry)
Uses recent swing high and low pivots to automatically calculate OTE zones (default: 62% and 75% retracement levels).
Draws these retracement zones for both bullish and bearish setups.
Marks Valid OTE Entry Zones
Buy/Sell zones only trigger when:
A liquidity grab occurs,
Price enters the OTE zone,
And a strong confirming candle is present.
Plots green/red arrows for valid buy/sell OTE entries.
Auto-Draws Take Profit Zones
TP1 = Previous swing high/low
TP2 = Risk-based R-multiplied extension (e.g., 1.5R — customizable)
Alerts
Triggers alerts when valid buy or sell OTE setups are detected.
⚙️ Customization Features:
Toggle each feature: Liquidity Grabs, Order Blocks, Fibonacci OTE levels
Set Fibonacci retracement percentages (e.g., 0.62 / 0.75)
Adjust lookback window for liquidity detection
Customize the take-profit multiplier (R-based)
Full control over visuals: colors, labels, and lines
💡 How to Use:
Use this script to scan for high-confluence trade setups based on Smart Money principles.
Combine with session timing (e.g., New York open), major swing structure, or Kill Zone windows for maximum edge.
Look for arrows inside OB zones or OTE levels following liquidity sweeps for cleaner entries.
🔗 Works Best With:
✅ First FVG — Opening Range Fair Value Gap Detector: Identify early inefficiencies to set the narrative for the day.
✅ Liquidity Levels — Smart Swing Lows: Spot key structural lows that can fuel stop hunts and reversals.
✅ ICT Turtle Soup — Liquidity Reversal: Add a classic reversal pattern to your toolkit to catch fakeouts cleanly.
Together, these tools build a complete Smart Money ecosystem for entry precision, risk management, and price behavior forecasting.

ICT Turtle Soup Ultimate V2📜 ICT Turtle Soup Ultimate V2 — Advanced Liquidity Reversal System
Overview:
The ICT Turtle Soup Ultimate V2 is a next-generation liquidity reversal indicator built on the principles of smart money concepts (SMC) and the classic ICT Turtle Soup setup. It is designed to detect false breakouts (liquidity grabs) at key swing points, enhanced by proprietary logic that filters out low-quality signals using a combination of trend context, kill zone timing, candle wick behavior, and multi-timeframe imbalance zones.
This tool is ideal for intraday traders seeking high-probability entry signals near liquidity pools and imbalance zones — where smart money makes its move.
🔍 What This Script Does
🧠 Liquidity Grab Detection (Turtle Soup Core Logic)
The script scans for recent swing highs/lows using a user-defined lookback.
A signal is generated when price breaks above/below a previous swing level but closes back inside — indicating a liquidity run and likely reversal.
A special Wick Trap Mode enhances this logic by detecting long-wick fakeouts — where the wick grabs stops but the candle body closes opposite the breakout direction.
📉 Trend Filter with ATR Buffer
Optional trend filter uses a simple moving average (SMA) to gauge market direction.
Instead of hard filtering, it applies an ATR-based buffer to allow for entries near the trend line, reducing signal suppression from micro-fluctuations.
🕰️ Kill Zone Session Filtering
Only show signals during institutional trading hours:
London Session
New York AM
Or any custom user-defined session
Helps traders avoid low-volume hours and focus on where stop hunts and price expansions typically occur.
🧱 Multi-Timeframe FVG Confluence (Optional)
Signal validation is strengthened by checking if price is within a higher timeframe Fair Value Gap — commonly used to identify imbalances or inefficiencies.
Filters out setups that lack underlying displacement or order flow justification.
🎨 Visual Feedback
Plots 🔺 bullish and 🔻 bearish markers at signal candles.
Optionally displays:
Swing High/Low Labels (SH / SL)
Reversal distance labels
Background color shading on valid signals
Includes built-in alerts for automated trade notification.
🔑 Unique Benefits
Wick Trap Detection: A proprietary approach to detecting stop hunts via wick behavior, not just candle closes.
ATR-based trend filtering: Avoids unnecessary filtering while still maintaining directional bias.
All-in-one system: No need to stack multiple indicators — swing detection, reversal logic, session filtering, and imbalance confirmation are all integrated.
💡 How to Use
Enable Wick Trap Mode to detect stealthy liquidity grabs with strong wicks.
Use Kill Zone filters to trade only when institutions are active.
Optionally enable FVG confluence to improve confidence in reversal zones.
Watch for Bullish signals near SL levels and Bearish signals near SH levels.
Combine with your own execution strategy or other SMC tools for optimal results.
🔗 Best Used With:
Maximize your edge by combining this script with complementary SMC-based tools:
✅ First FVG — Opening Range Fair Value Gap Detector
✅ ICT SMC Liquidity Grabs + OB + Fibonacci OTE Levels
✅ Liquidity Levels — Smart Swing Highs and Lows with horizontal line projections

ICT Turtle Soup (Liquidity Reversal)ICT Turtle Soup — Liquidity Reversal Detection
Classic Liquidity Trap Reversal Strategy for Smart Money Traders
This indicator implements the ICT Turtle Soup concept — a classic liquidity-based reversal pattern — which occurs when price runs above or below a recent swing level to grab liquidity, then sharply reverses. This pattern is commonly used in Smart Money Concepts (SMC) and Inner Circle Trader (ICT) strategies to anticipate false breakouts and high-probability reversals.
🔍 What This Script Does:
Identifies Swing Highs & Lows
Detects recent swing highs and lows using a customizable lookback period.
Tracks Liquidity Grabs
A bearish Turtle Soup setup is triggered when price breaks above a recent swing high but closes back below it.
A bullish Turtle Soup setup is triggered when price breaks below a recent swing low but closes back above it.
These conditions often signal liquidity traps, where price sweeps resting orders before reversing.
Plots Signals Directly on the Chart
Turtle Soup setups are marked with 🐢🔻 (bearish) and 🐢🔺 (bullish) labels.
Optional full-text labels can also be displayed for clarity and journaling.
Includes Alert Conditions
Alerts can be enabled to notify you of bullish or bearish Turtle Soup reversals in real-time.
⚙️ Customization Features:
Adjustable swing lookback period
Enable/disable Turtle Soup labels
Set label font size
Choose your preferred bullish/bearish signal colors
💡 How to Use:
Add this script to your chart (ideally on intraday timeframes such as 5m–15m).
Wait for a Turtle Soup signal near a key swing high/low or liquidity zone.
Combine with other confirmation tools (e.g., FVGs, Order Blocks, OTE) for stronger setups.
Use alerts to stay ahead of fast-moving reversals.
🧠 Why It Works:
Turtle Soup setups are rooted in liquidity theory — they exploit the market’s tendency to sweep obvious swing levels before reversing. These moves often trap retail traders and mark the beginning of Smart Money entries.
🔗 Best Used With:
Maximize the edge by combining this with other SMC tools:
✅ First FVG — Opening Range Fair Value Gap Detector
✅ ICT SMC Liquidity Grabs + OB + Fibonacci OTE Levels
✅ Liquidity Levels — Smart Swing Lows
Together, they create a complete ecosystem for identifying, confirming, and executing liquidity-driven trade setups with precision.
