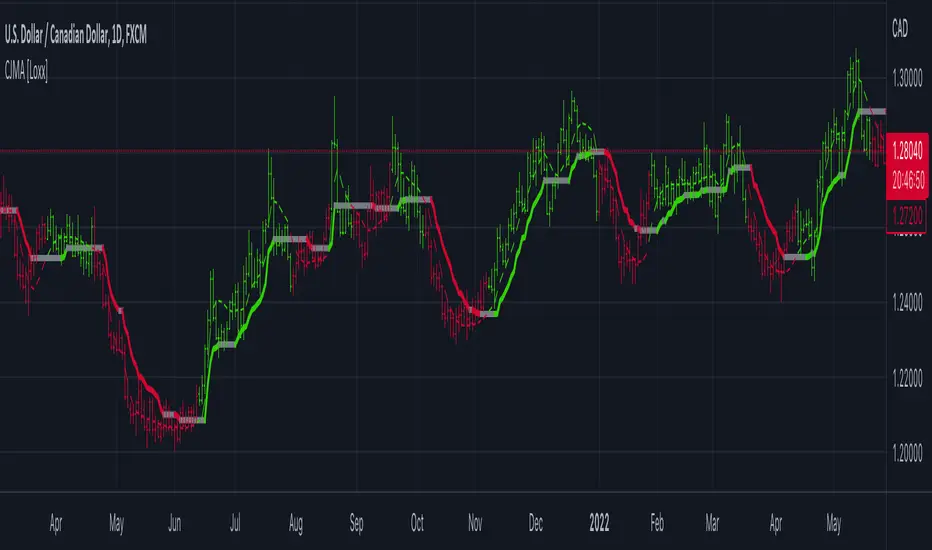
Corrected JMA [Loxx]This indicator uses the Juirk Moving Average to calculate price deviations from the JMA and if the changes are not significant, then the value is "flattened". That way we can easily see both trends and potential chop zones. This uses the regular JMA as a trigger.
What is Jurik Volty used in the Juirk Filter?
One of the lesser known qualities of Juirk smoothing is that the Jurik smoothing process is adaptive. "Jurik Volty" (a sort of market volatility ) is what makes Jurik smoothing adaptive. The Jurik Volty calculation can be used as both a standalone indicator and to smooth other indicators that you wish to make adaptive.
What is the Jurik Moving Average?
Have you noticed how moving averages add some lag (delay) to your signals? ... especially when price gaps up or down in a big move, and you are waiting for your moving average to catch up? Wait no more! JMA eliminates this problem forever and gives you the best of both worlds: low lag and smooth lines.
Included:
Bar coloring
標準差(波動率)
STD-Stepped VIDYA w/ Quantile Bands [Loxx]STD-Stepped VIDYA w/ Quantile Bands is a VIDYA moving average with Standard Deviation step filtering on either/neither/both price and VIDYA. Also included are quantile bands to identify breakouts/breakdowns/reversals.
What is VIDYA?
Variable Index Dynamic Average Technical Indicator ( VIDYA ) was developed by Tushar Chande. It is an original method of calculating the Exponential Moving Average ( EMA ) with the dynamically changing period of averaging.
What is Quantile Bands?
In statistics and the theory of probability, quantiles are cutpoints dividing the range of a probability distribution into contiguous intervals with equal probabilities, or dividing the observations in a sample in the same way. There is one less quantile than the number of groups created. Thus quartiles are the three cut points that will divide a dataset into four equal-size groups ( cf . depicted example). Common quantiles have special names: for instance quartile, decile (creating 10 groups: see below for more). The groups created are termed halves, thirds, quarters, etc., though sometimes the terms for the quantile are used for the groups created, rather than for the cut points.
q-Quantiles are values that partition a finite set of values into q subsets of (nearly) equal sizes. There are q − 1 of the q-quantiles, one for each integer k satisfying 0 < k < q. In some cases the value of a quantile may not be uniquely determined, as can be the case for the median (2-quantile) of a uniform probability distribution on a set of even size. Quantiles can also be applied to continuous distributions, providing a way to generalize rank statistics to continuous variables. When the cumulative distribution function of a random variable is known, the q-quantiles are the application of the quantile function (the inverse function of the cumulative distribution function) to the values {1/q, 2/q, …, (q − 1)/q}.
Included:
3 types of signal options
Alerts
Bar coloring
Loxx's Expanded Source Types

Dynamic Zone of Bollinger Band Stops Line [Loxx]Dynamic Zone of Bollinger Band Stops Line is a Bollinger Band indicator with Dynamic Zones. This indicator serves as both a trend indicator and a dynamic stop-loss indicator.
What are Bollinger Bands?
A Bollinger Band is a technical analysis tool defined by a set of trendlines plotted two standard deviations (positively and negatively) away from a simple moving average (SMA) of a security's price, but which can be adjusted to user preferences.
Bollinger Bands were developed and copyrighted by famous technical trader John Bollinger, designed to discover opportunities that give investors a higher probability of properly identifying when an asset is oversold or overbought.
What are Dynamic Zones?
As explained in "Stocks & Commodities V15:7 (306-310): Dynamic Zones by Leo Zamansky, Ph .D., and David Stendahl"
Most indicators use a fixed zone for buy and sell signals. Here’ s a concept based on zones that are responsive to past levels of the indicator.
One approach to active investing employs the use of oscillators to exploit tradable market trends. This investing style follows a very simple form of logic: Enter the market only when an oscillator has moved far above or below traditional trading lev- els. However, these oscillator- driven systems lack the ability to evolve with the market because they use fixed buy and sell zones. Traders typically use one set of buy and sell zones for a bull market and substantially different zones for a bear market. And therein lies the problem.
Once traders begin introducing their market opinions into trading equations, by changing the zones, they negate the system’s mechanical nature. The objective is to have a system automatically define its own buy and sell zones and thereby profitably trade in any market — bull or bear. Dynamic zones offer a solution to the problem of fixed buy and sell zones for any oscillator-driven system.
An indicator’s extreme levels can be quantified using statistical methods. These extreme levels are calculated for a certain period and serve as the buy and sell zones for a trading system. The repetition of this statistical process for every value of the indicator creates values that become the dynamic zones. The zones are calculated in such a way that the probability of the indicator value rising above, or falling below, the dynamic zones is equal to a given probability input set by the trader.
To better understand dynamic zones, let's first describe them mathematically and then explain their use. The dynamic zones definition:
Find V such that:
For dynamic zone buy: P{X <= V}=P1
For dynamic zone sell: P{X >= V}=P2
where P1 and P2 are the probabilities set by the trader, X is the value of the indicator for the selected period and V represents the value of the dynamic zone.
The probability input P1 and P2 can be adjusted by the trader to encompass as much or as little data as the trader would like. The smaller the probability, the fewer data values above and below the dynamic zones. This translates into a wider range between the buy and sell zones. If a 10% probability is used for P1 and P2, only those data values that make up the top 10% and bottom 10% for an indicator are used in the construction of the zones. Of the values, 80% will fall between the two extreme levels. Because dynamic zone levels are penetrated so infrequently, when this happens, traders know that the market has truly moved into overbought or oversold territory.
Calculating the Dynamic Zones
The algorithm for the dynamic zones is a series of steps. First, decide the value of the lookback period t. Next, decide the value of the probability Pbuy for buy zone and value of the probability Psell for the sell zone.
For i=1, to the last lookback period, build the distribution f(x) of the price during the lookback period i. Then find the value Vi1 such that the probability of the price less than or equal to Vi1 during the lookback period i is equal to Pbuy. Find the value Vi2 such that the probability of the price greater or equal to Vi2 during the lookback period i is equal to Psell. The sequence of Vi1 for all periods gives the buy zone. The sequence of Vi2 for all periods gives the sell zone.
In the algorithm description, we have: Build the distribution f(x) of the price during the lookback period i. The distribution here is empirical namely, how many times a given value of x appeared during the lookback period. The problem is to find such x that the probability of a price being greater or equal to x will be equal to a probability selected by the user. Probability is the area under the distribution curve. The task is to find such value of x that the area under the distribution curve to the right of x will be equal to the probability selected by the user. That x is the dynamic zone.
Included
Bar coloring
Signals
Alerts
3 types of signal smoothing

Visible Range Mean Deviation Histogram [LuxAlgo]This script displays a histogram from the mean and standard deviation of the visible price values on the chart. Bin counting is done relative to high/low prices instead of counting the price values within each bin, returning a smoother histogram as a result.
Settings
Bins Per Side: Number of bins computed above and below the price mean
Deviation Multiplier: Standard deviation multiplier
Style
Relative: Determines whether the bins length is relative to the maximum bin count, with a length controlled with the width settings to the left.
Bin Colors: Bin/POC Lines colors
Show POCs: Shows point of controls
Usage
Histograms are generally used to estimate the underlying distribution of a series of observations, their construction is generally done taking into account the overall price range.
The proposed histogram construct N intervals above*below the mean of the visible price, with each interval having a size of: σ × Mult / N , where σ is the standard deviation and N the number of Bins per side and is determined by the user. The standard deviation multipliers are highlighted at the left side of each bin.
A high bin count reflects a higher series of observations laying within that specific interval, this can be useful to highlight ranging price areas.
POCs highlight the most significant bins and can be used as potential support/resistances.

[Sidders]Std. Deviation from Mean/MA (Z-score)This indicator visualizes in a straight forward way the distance price is away from the mean in absolute standard deviations (Z-score) over a certain lookback period (can be configured). Additionally I've included a moving average of the distance, the MA type can be configured in the settings.
Personally using this indicator for some of my algo mean reversion strategies. Price reaching the extreme treshold (can be configured in settings, standard is 3) could be seen as a point where price will revert to the mean.
I've included alerts for when price crosses into extreme areas, as well as alerts for when crosses back into 'normal' territory again. Both are also plotted on the indicator through background coloring/shapes.
Since I've learned so much from other developers I've decided to open source the code. Let me know if you have any ideas on how to improve, I'll see if I can implement them.
Enjoy!

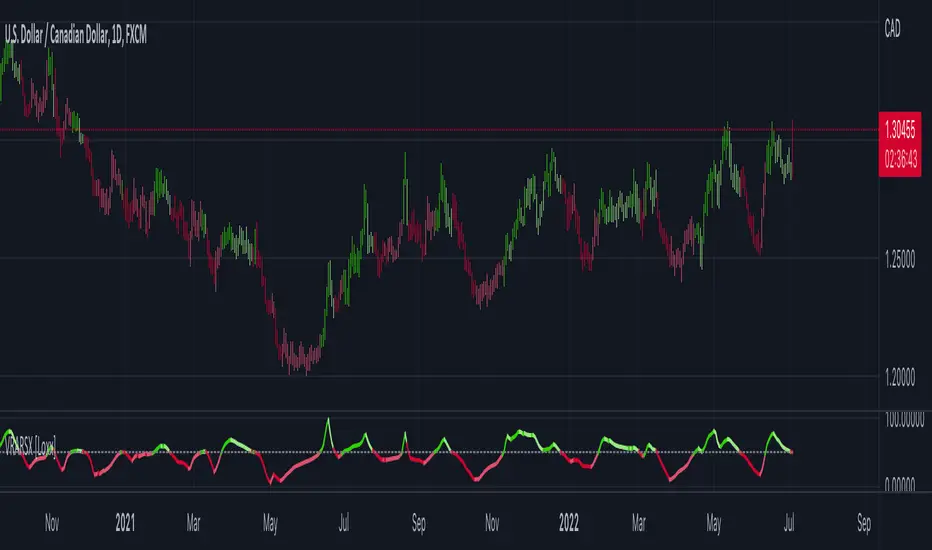
Volatility Ratio Adaptive RSX [Loxx]Volatility Ratio Adaptive RSX this indicator adds volatility ratio adapting and speed value to RSX in order to make it more responsive to market condition changes at the times of high volatility, and to make it smoother in the times of low volatility
What is RSX?
RSI is a very popular technical indicator, because it takes into consideration market speed, direction and trend uniformity. However, the its widely criticized drawback is its noisy (jittery) appearance. The Jurik RSX retains all the useful features of RSI, but with one important exception: the noise is gone with no added lag.
Included:
-Toggle on/off bar coloring
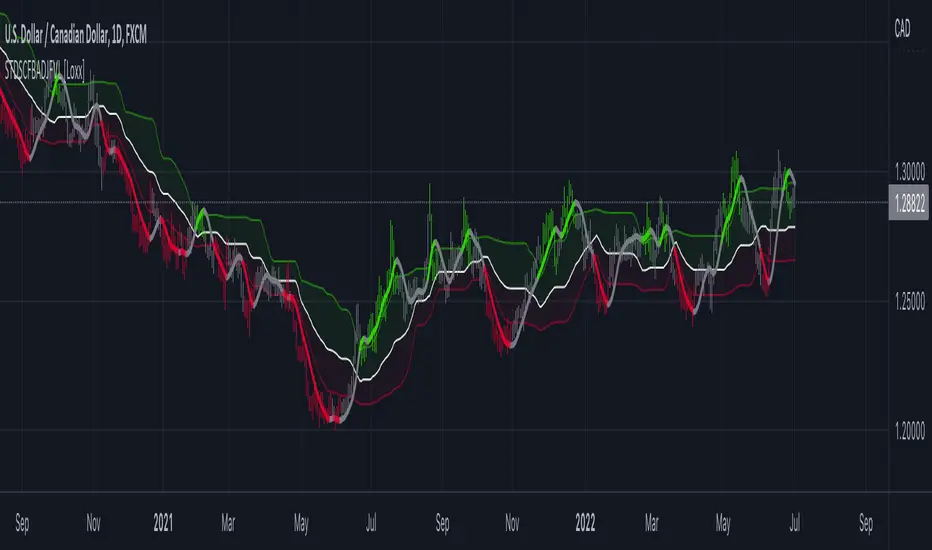
STD-Stepped, CFB-Adaptive Jurik Filter w/ Variety Levels [Loxx]STD-Stepped, CFB-Adaptive Jurik Filter w/ Variety Levels is a Composite Fractal Behavior, single/double Jurik filter with floating boundary levels, alerts, and signals.
What is Composite Fractal Behavior ( CFB )?
All around you mechanisms adjust themselves to their environment. From simple thermostats that react to air temperature to computer chips in modern cars that respond to changes in engine temperature, r.p.m.'s, torque, and throttle position. It was only a matter of time before fast desktop computers applied the mathematics of self-adjustment to systems that trade the financial markets.
Unlike basic systems with fixed formulas, an adaptive system adjusts its own equations. For example, start with a basic channel breakout system that uses the highest closing price of the last N bars as a threshold for detecting breakouts on the up side. An adaptive and improved version of this system would adjust N according to market conditions, such as momentum, price volatility or acceleration.
Since many systems are based directly or indirectly on cycles, another useful measure of market condition is the periodic length of a price chart's dominant cycle, (DC), that cycle with the greatest influence on price action.
The utility of this new DC measure was noted by author Murray Ruggiero in the January '96 issue of Futures Magazine. In it. Mr. Ruggiero used it to adaptive adjust the value of N in a channel breakout system. He then simulated trading 15 years of D-Mark futures in order to compare its performance to a similar system that had a fixed optimal value of N. The adaptive version produced 20% more profit!
This DC index utilized the popular MESA algorithm (a formulation by John Ehlers adapted from Burg's maximum entropy algorithm, MEM). Unfortunately, the DC approach is problematic when the market has no real dominant cycle momentum, because the mathematics will produce a value whether or not one actually exists! Therefore, we developed a proprietary indicator that does not presuppose the presence of market cycles. It's called CFB (Composite Fractal Behavior) and it works well whether or not the market is cyclic.
CFB examines price action for a particular fractal pattern, categorizes them by size, and then outputs a composite fractal size index. This index is smooth, timely and accurate
Essentially, CFB reveals the length of the market's trending action time frame. Long trending activity produces a large CFB index and short choppy action produces a small index value. Investors have found many applications for CFB which involve scaling other existing technical indicators adaptively, on a bar-to-bar basis.
What is Jurik Volty used in the Juirk Filter?
One of the lesser known qualities of Juirk smoothing is that the Jurik smoothing process is adaptive. "Jurik Volty" (a sort of market volatility ) is what makes Jurik smoothing adaptive. The Jurik Volty calculation can be used as both a standalone indicator and to smooth other indicators that you wish to make adaptive.
What is the Jurik Moving Average?
Have you noticed how moving averages add some lag (delay) to your signals? ... especially when price gaps up or down in a big move, and you are waiting for your moving average to catch up? Wait no more! JMA eliminates this problem forever and gives you the best of both worlds: low lag and smooth lines.
Ideally, you would like a filtered signal to be both smooth and lag-free. Lag causes delays in your trades, and increasing lag in your indicators typically result in lower profits. In other words, late comers get what's left on the table after the feast has already begun.
Included:
-Color bars
-Color background
-Color trend
-Color deadzones
-Show signals
-Long/short alerts
-ATR and quantile based levels
ALMA stdev band with fibsArnaud Legoux Moving Average with standard deviation band and standard deviation Fibonacci levels.
Standard deviation band is alma + stdev and alma - stdev.
Fibonacci levels are alma + stdev * fib ratio and alma - stdev * fib ratio (0.382 / 0.5 / 0.618 / 1.618 / 2.618).
Used like a moving average, but also shows probable price range based on past volatility, and helps to recognize support/resistance levels, trends and trend momentum based on the Fibonacci levels.

STD Stepped Ehlers Optimal Tracking Filter MTF w/ Alerts [Loxx]STD Stepped Ehlers Optimal Tracking Filter MTF w/ Alerts is the traditional Ehlers Optimal Tracking Filter but with stepped price levels, access to multiple time frames, and alerts.
What is Ehlers Optimal Tracking Filter?
From "OPTIMAL TRACKING FILTERS" by John Ehlers:
"Dr. R.E. Kalman introduced his concept of optimum estimation in 1960. Since that time, his technique has proven to be a powerful and practical tool. The approach is particularly well suited for optimizing the performance of modern terrestrial and space navigation systems. Many traders not directly involved in system analysis have heard about Kalman filtering and have expressed an interest in learning more about it for market applications. Although attempts have been made to provide simple, intuitive explanations, none has been completely successful. Almost without exception, descriptions have become mired in the jargon and state-space notation of the “cult”.
Surprisingly, in spite of the obscure-looking mathematics (the most impenetrable of which can be found in Dr. Kalman’s original paper), Kalman filtering is a fairly direct and simple concept. In the spirit of being pragmatic, we will not deal with the full-blown matrix equations in this description and we will be less than rigorous in the application to trading. Rigorous application requires knowledge of the probability distributions of the statistics. Nonetheless we end with practically useful results. We will depart from the classical approach by working backwards from Exponential Moving Averages. In this process, we introduce a way to create a nearly zero lag moving average. From there, we will use the concept of a Tracking Index that optimizes the filter tracking for the given uncertainty in price movement and the uncertainty in our ability to measure it."
Included:
-Standard deviation stepping filter, price is required to exceed XX deviations before the moving average line shifts direction
-Selection of filtering based on source price, the moving average, or both; you can also set the Filter deviations to 0 for no filtering at all
-Toggle on/off bar coloring
-Toggle on/off signals
-Long/Short alerts

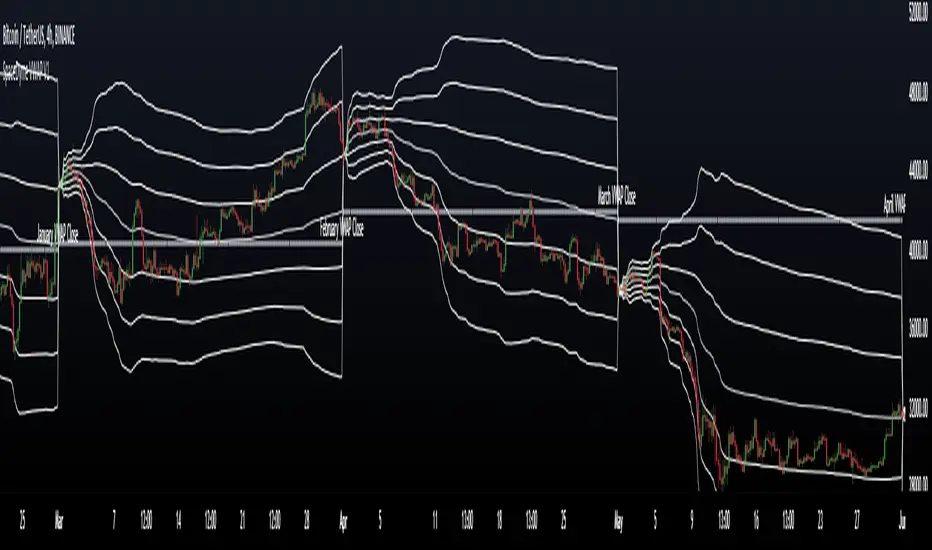
VWAP Suite█ OVERVIEW
This indicator is an attempt to bring all VWAP functionalities under one umbrella suite, the existing VWAPs are great and this was made to provide all functionalities. (pending more updates as well)
█ FEATURES
Multiple VWAPs MTF
Individual Band configuration
Previous vwap closes
Date tracking of previous closes
MTF Options
Enabling the other VWAPS with any timeframe will allow the user to use the "VWAP Anchor" setting to choose what HTF Vwap to be displayed
"Prev Close"
This setting enables all historical closes to be displayed with extension
"Track Dates"
Can be used to keep date information of 2 previous closes and further back
█ HOW TO USE IT
The indicator is quite straight forward in its application, as you would expect of a normal VWAP.
At the top of the settings pane the indicator has some functionality that would control the VWAPs globally, e.g. disabling show bands disables all bands for all the VWAPs.
Each VWAP has individual settings that can be controlled such as coloring, which bands enabled, previous closes, labelling...
█ SUGGESTION
My suggestion for clarity is to use 1 VWAP with bands, and a 2nd with no bands + Previous close enabled at a higher timeframe
█ LIMITATIONS OF PINE (Please read)
I see many users going on different indicators with MTF in mind and trying to use it for LTF data e.g. 1hour chart, and selecting 5min in chart settings.
This is not recommended by the team themselves and should be noted for use always use HTF: www.tradingview.com
To understand how to use VWAP please refer to some education that can be found for free online
Heres an example of a trader using the tool himself: www.youtube.com
█ Future Updates:
Previous Close Line extensions
Previous Highs and Lows of VWAP mapped out for users
Suggestions Welcome!
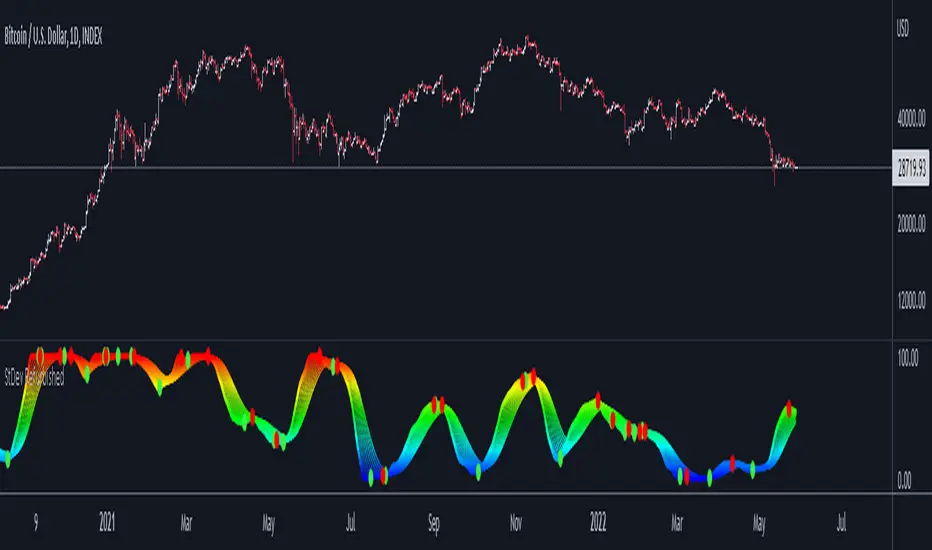
Standard Deviation Refurbished█ Standard Deviation Refurbished
This is an indicator that serves to show the standard deviation in a more improved and less trivial form.
Basically, I put the option to normalize the indicator in a range of 0 to 100.
I also put 10 moving averages of standard deviation.
In the graphic part was placed the choice of themes.
Gratitude to the author 'The_Caretaker' by the themes 'Spectrum Blue-Green-Red' and 'Spectrum Blue-Red'.
█ Concepts
"Standard Deviation is a way to measure price volatility by relating a price range to its moving average. The higher the value of the indicator, the wider the spread between price and its moving average, the more volatile the instrument and the more dispersed the price bars become. The lower the value of the indicator, the smaller the spread between price and its moving average, the less volatile the instrument and the closer to each other the price bars become. Standard Deviation is used as part of other indicators such as Bollinger Bands. It is often used in combination with other signals and analysis techniques."
(TradingView)
Z-Score DeltaHeavily modified from Z Score by jwammo12
Compares the z-score of two assets, the onscreen one and the reference one configured. If you're familiar, you can think of it as Bollinger Band Percent of Onscreen Asset minus the Bollinger Band Percent of Reference Asset.
It's compared off a simple moving average, due to how standard deviation is calculated.
I view this a more literal meaning of relative strength.
Has the ability to offset or delay in time one to another.
TODO: add MAD and MAD/STD.DEV views
Not my greatest work, but it's functional.

Price Clouds Oscillator (PCO)This is the oscillator version of Price Clouds (PS). Use this with (PS) for best results.
This indicator shows you over bought and over sold regions similarly to to rsi or stochastic. This indicator centers a moving average around the hl2 of the price. This is calculated as the difference of four moving averages. The signal line shows you how much momentum in any given direction you have. You can also see how much volatility there is by the band width. Just like the Bollinger band high volatility comes before low volatility and visa versa. You can also see what the market is doing based on the signal crosses. If the fast line is above the slow line you are going up and visa versa. This indicator works in most markets, especially crypto. There is a tool tip for every aspect of this indicator explaining how everything works.
Key Feature:
>See where the price is relative to a mean price
>Measure volatility
>Clean global settings
>Normalization feature lets you scale the band from 0 to 1. You loose some information but its easier to use if you aren't measuring volatility.
I hope you are very profitable with this one!
If you find this indicator is useful to you, Star it, Follow, Donate, Like and Share.
Your support is a highly motivation for me.
PCO
----------------------/\-----
-------------/\----/----\---
\----------/----\/--------\-
--\------/------------------
----\_/---------------------

CHOPperIt is based on the Choppiness Index indicator. It can show you when the market is in range. If the lines are below the lower band, it can be a strong trend, if it is inside the 2 bands, it is considered to be a choppy market, and if it is crossed down the upper band, it can be a developing trend.
This indicator does not show you the trend direction! This may be used as a confirmation indicator.
The improvements this indicator provides over the original:
It uses ATR instead of just TR (if ATR length is 1, it is the original TR)
It uses my ATRWO (ATR Without Outliers) indicator inside, which can remove extreme highs and lows from calculation. You can tune this by the "ATRWO STDev Mult" parameter. Higher value means more outliers are allowed.
It has 2 lines, one uses ATR(WO) (the blue one), which can be similar to the original Choppiness Index, the other uses standard deviation (the teal one).
The 2 lines can be used together, or you can hide one of them.

Trendlines with Breaks [LuxAlgo]The trendlines with breaks indicator return pivot point based trendlines with highlighted breakouts. Users can control the steepness of the trendlines as well as their slope calculation method.
Trendline breakouts occur in real-time and are not subject to backpainting. Trendlines can however be subject to repainting unless turned off from the user settings.
The indicator includes integrated alerts for trendline breakouts.
🔶 USAGE
Any valid trendlines methodology can be used with the indicator, users can identify breakouts in order to infer future price movements.
The calculation method of the slope greatly affects the trendline's behaviors. By default, an average true range is used, returning a more constant slope amongst trendlines. Other methods might return trendlines with significantly different slopes.
Stdev makes use of the standard deviation for the slope calculation, while Linreg makes use of the slope of a linear regression.
The above chart shows the indicator using "Stdev" as a slope calculation method. The chart below makes use of the "Linreg" method.
By default trendlines are subject to backpainting, and as such are offset by length bars in the past. Disabling backpainting will not offset the trendlines.
🔶 SETTINGS
Length: Pivot points period
Slope: Slope steepness, values greater than 1 return a steeper slope. Using a slope of 0 would be equivalent to obtaining levels.
Slope Calculation Method: Determines how the slope is calculated.
Backpaint: Determine whether trendlines are backpainted, that is offset to past.

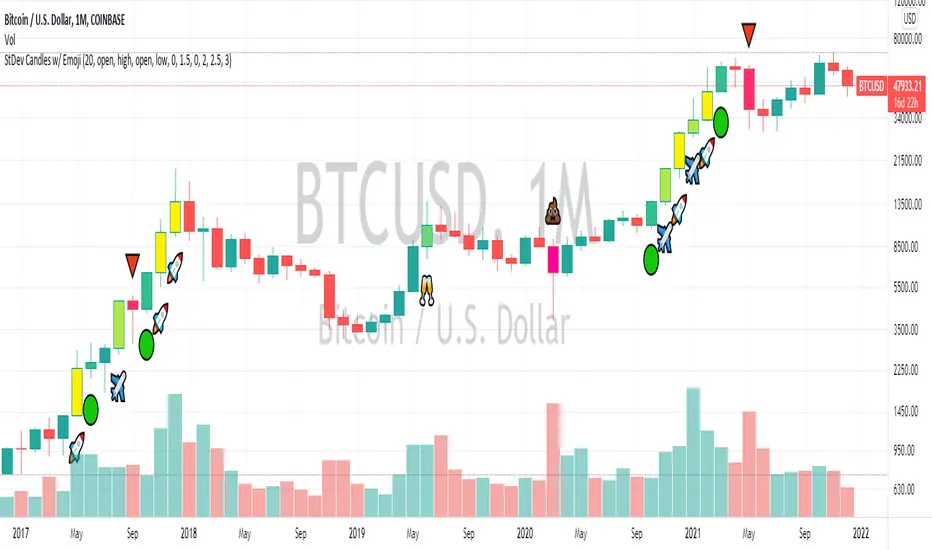
Standard Deviation Candles (With Emoji)In crypto, significant price moves can be a sign of continuation or reversal. This script measures if price move is greater than a certain number of standard deviations vs. previous periods, then alters bar colours and/or prints an emoji signal.
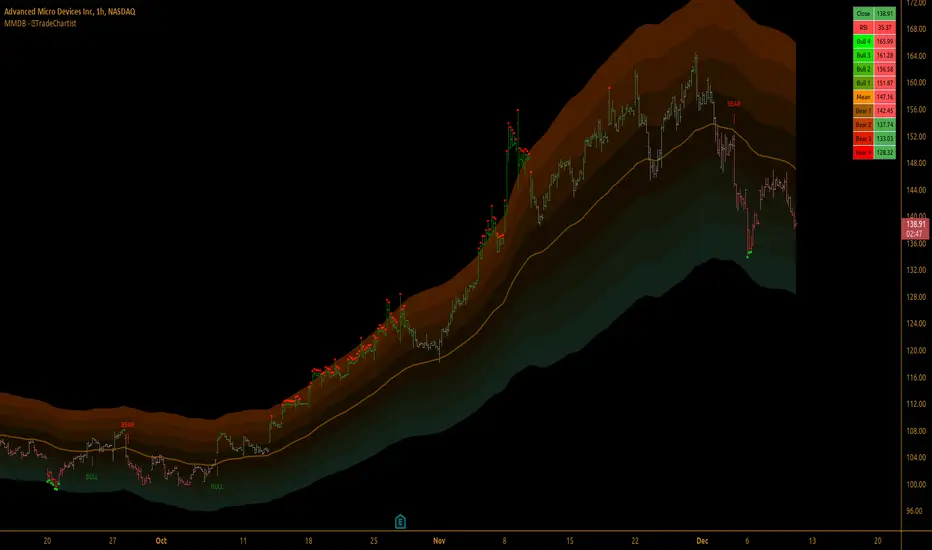
TradeChartist Mean Momentum Drift Bands (MMDB)™TradeChartist Mean Momentum Drift Bands (MMDB) is a Momentum indicator that plots a Mean Momentum line (calculated automatically from sample means of many lookback periods decided by the script logic) and Upper/Lower Drift Bands (calculated using standard deviation). The script helps spot price volatility, Oversold/Overbought zones and also generates high probability breakout signals without any user input.
===================================================================================================================
Features of ™TradeChartist MMDB
==============================
Momentum Mean and 4 upper/lower Drift bands.
No User input required.
3 Visual colour schemes - Chilli, Flame and Custom.
MMDB table that shows asset's price, RSI and values of Mean & Upper/Lower Drift bands
Breakout Signals (Bull and Bear arrows) based on price closing above or below the 1st Drift Band.
Overbought and Oversold zones.
Colour Bars based on Momentum strength.
Alerts for Bull and Bear Breakouts ( Once per bar close to be used).
===================================================================================================================
Example Charts
1. MMDB used along with ™TradeChartist MMDO (Mean Momentum Drift Oscillator) on 4hr chart of BINANCE:BTCUSDT
2. MMDB on 4hr chart of OANDA:XAUUSD
3. MMDB on 1hr chat of OANDA:SPX500USD
4. MMDB connected to ™TradeChartist Plug and Trade on BINANCE:LINKUSDTPERP
===================================================================================================================
Note: The script doesn't repaint, so the alerts can be used with confidence. To check this, users can do bar replay to confirm if the plots and markers stay in the same place.
===================================================================================================================
Best Practice: Test with different settings first using Paper Trades before trading with real money
===================================================================================================================
DMI & ST DEV zone intersection [LM]Hello Traders,
This indicator uses two indicators st dev extremes and DMI extremes and visualize intersection of both indicators extreme zones using crosses. It means where cross is rendered intersection of extremes has occurred.
The standard deviation uses the same calculation as my Standard deviation zones Support & Resistance indicator, DMI indicator measures both the strength and direction of a price movement. I am using both indicators to find the intersection of extreme zones between them.
ST DEV settings:
source
tops setting
bottom setting
DMI settings:
length settings
extreme zone setting
Enjoy,
Lukas

VWAP StdDev Bands - Multi-type VWAP: Period, Date, EarningsThis VWAP indicator differs from the rest in that it is customizable for 3 distinct VWAP types, among other features that may be useful.
VWAP types:
Period Based VWAP
Date Anchored VWAP
Earnings Based VWAP
Additional features common to all VWAP types:
Standard Deviation Bands
Coloring based on Price vs Deviation Bands
Coloring of VWAP based on VWAP Slope
Each of the VWAP types are described below:
Period VWAP
Simple period VWAP which allows preset, as well as custom periods.
Resets at the start of each period.
Also allows setting a custom session time for reset at specific time of day.
Date VWAP
Date anchored VWAP which does not reset.
VWAP will start from the selected date.
Pictured: AAPL Date VWAP from 2018-08-27
Earnings VWAP
VWAP which resets on every earnings report. The symbol must be stock with available earnings data.
Multiple types can be used in conjunction with one another only by adding multiple of the indicator to your chart.
Feel free to leave any comments, questions, or bug reports. All are welcome.
Enjoy!

Ultimate Moving Average Bands [CC+RedK]The Ultimate Moving Average Bands were created by me and @RedKTrader and this converts our Ultimate Moving Average into volatility bands that use the same adaptive logic to create the bands. I have enabled everything to be fully adjustable so please let me know if you find a more useful setting than what I have here by default. I'm sure everyone is familiar with volatility bands but generally speaking if a price goes above the volatility bands then this is either a sign of an extremely strong uptrend or a potential reversal point and vice versa. I have included strong buy and sell signals in addition to normal ones so darker colors are strong signals and lighter colors are normal ones. Buy when the lines turn green and sell when they turn red.
Let me know if there are any other scripts you would like to see me publish!

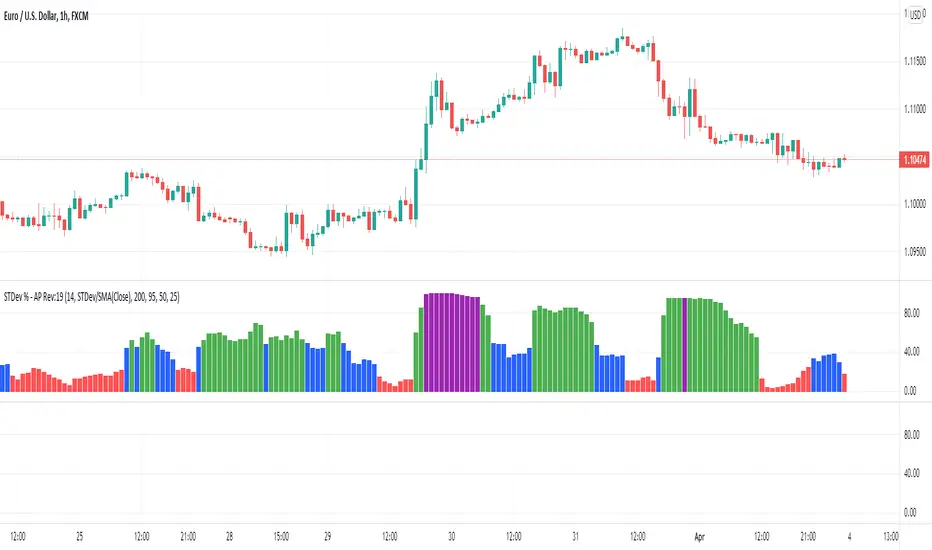
STDev % by Alejandro PThis is a simple indicator that expands the usability of Standard deviation into a universally usable indicator.
This indicator displays the volatility as standard deviation as a % of asset value, this allows using more standardized and comparable values across multiple instruments and asset classes.
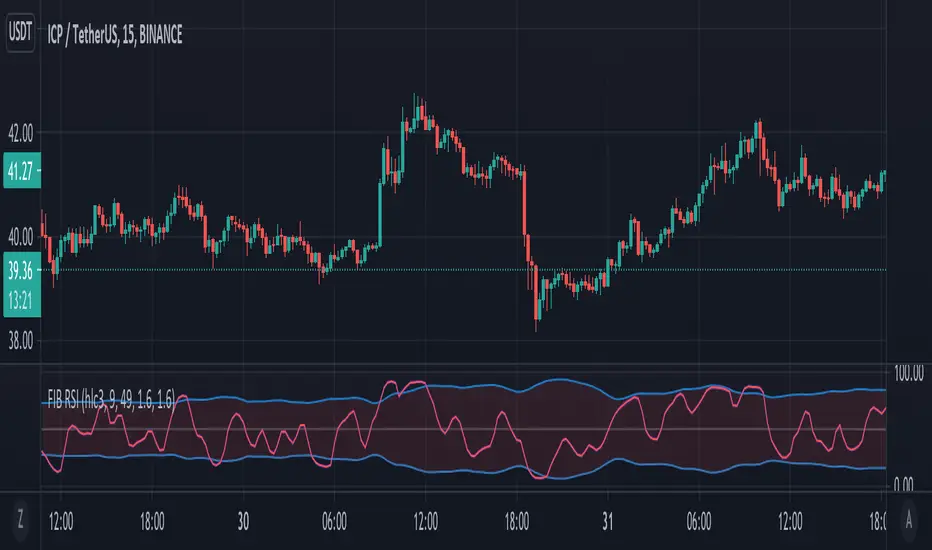
[EG] Fib RSIExtrapolated Fibonacci MA (FMA) into an RSI
i.e. FMA(up) and FMA(dn) of lengths 2, 3, 5, 8, 13, 21, 34, 55, 89 etc. averaged into RSI values.
Keep in mind it does not use 'Length' - it uses 'Interval' - how many fib intervals to include in the RSI calculation.
I threw in Ehler's Smoothing as well - seems to work quite well, thanks to TV Community for inspiration and code to look at for help
(Standard RSI included for comparison)
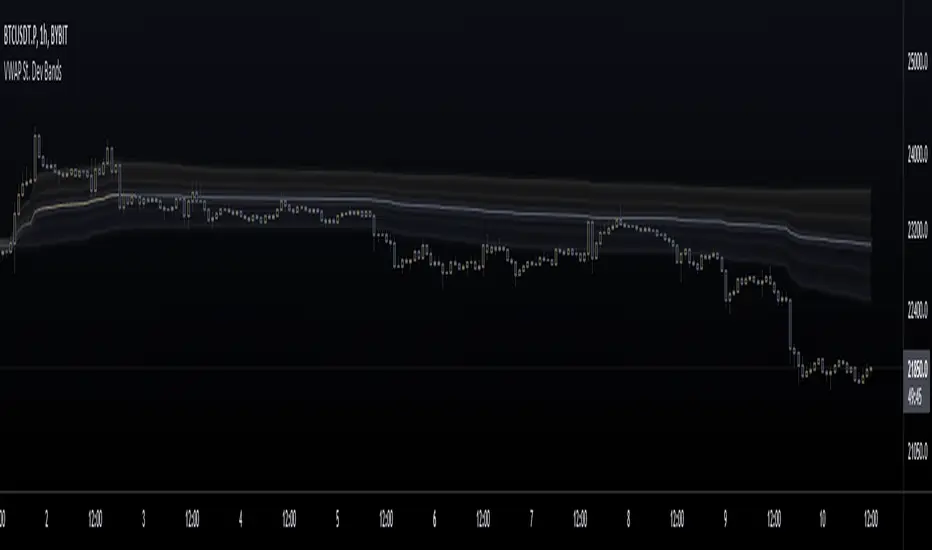
VWAP St. Dev BandsThis indicator allows you to add up to 3 volatility bands to VWAP based on its Standard Deviation.
Best use is for intraday but you can choose higher timeframes too.
For day trading a band of 3 standard deviations usually works well as an overbought/oversold region, allowing for mean reversion trading, but you are free to come up with your own strategies.
Enjoy!