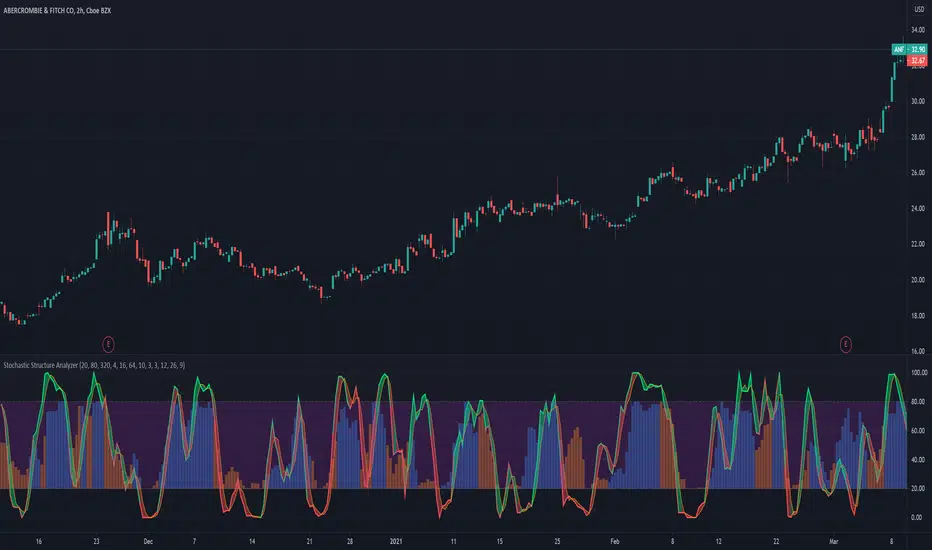
Stochastic Structure AnalyzerA momentum indicator that uses the highest and lowest values for price in three different lookback lengths to find the performance relative to three timeframes.
- Stochastic can be used for buy and sell signals as usual.
- The bars at the back represent the stochastic value of the OBV based structure calculation.
- The color of the stochastic line is a preliminary indicator of an up move.
- The fill color between the stochastic lines indicate the trend strength,
How to use: I suggest combining this with a higher timeframe to buy when the both stochastics are crossing below 20 line. And sell when one of the stochastics crosses-down.
This is the stochastic version of the structure analyzer().
隨機震盪指標(KD)
Upgraded Stochastic by YenJust an enhanced version of stochastic which added with special symbol whenever K and D line crossing up or down.
Background color is green whenever K line is above middle level 50 and red when below middle level 50.
You may also turn on the histogram in settings.

EL Fly Candle (spinning top) by Epullemanhighlight spinning top candle with alerted volume > vol sma 20 and stoch above 50

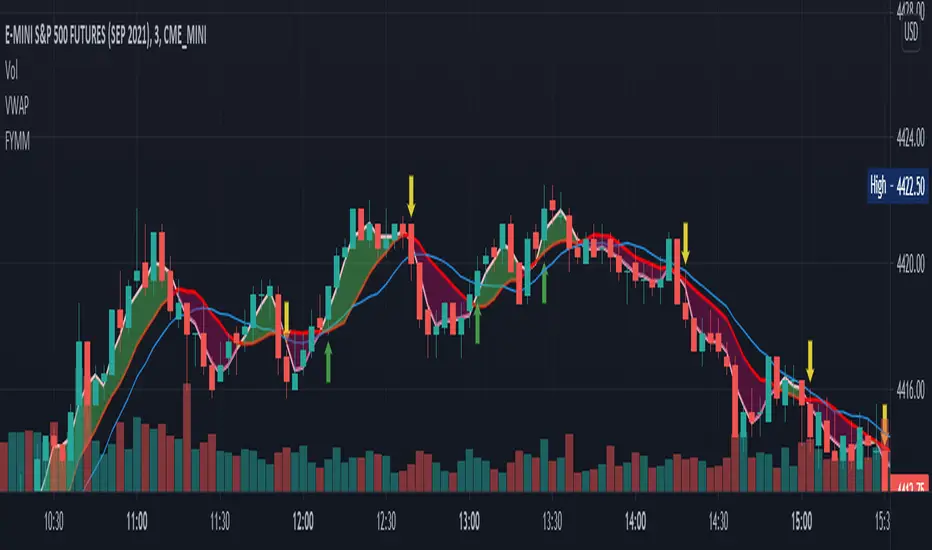
F_ You Money MakerThe FYMM is a combination of custom stochastics and an SMA cloud. The idea is when the bullish stochastic crosses over the bearish stochastic and a cross occurs on the cloud it will alert you. The indicator is slightly leading so you'll need to be careful and use near technical levels such as support and resistance or trend lines. Up arrow means enter a long down arrow means enter a short. Again, use this around technicals.
Stoch DMIStochastics applied to adjusted ADX to represent the trend direction. DM based sub-indicators added to hint the momentum and changes in the ADX.

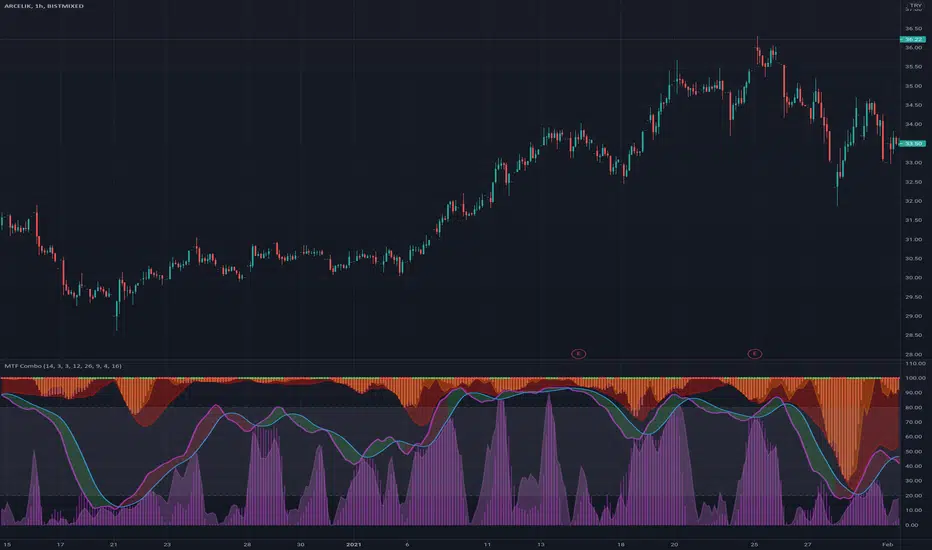
MTF ComboMiddle stochastic is the HTF stochastic of price. The color coding indicates the trend in even higher timeframe.
- The graph on top is the stochastic of ATR (with HTF and current one with RSI and macd histogram).
- The green graph at the bottom is the stochastic of the OBV (with HTF and current one with RSI and macd histogram).
- Purple histogram and area underneath the mid-stochsatic are the macd histogram and the stochastic RSI.
- The dots in the middle are determined by the combined score of all
Stochastic ATR IIStochastic ATR(Higher timeframe)
- stochastic of macd of ATR.
- stochastic rsi of ATR

Stochastic OBV IIUses OBV to plot a stochastic graph. Incorporates the macd of obv and plots a stochastic of this macd. Additionally stochastic rsi of OBV is plotted in histograms.
The stochastic OBV is in the higher timeframe(current time frame * 4).
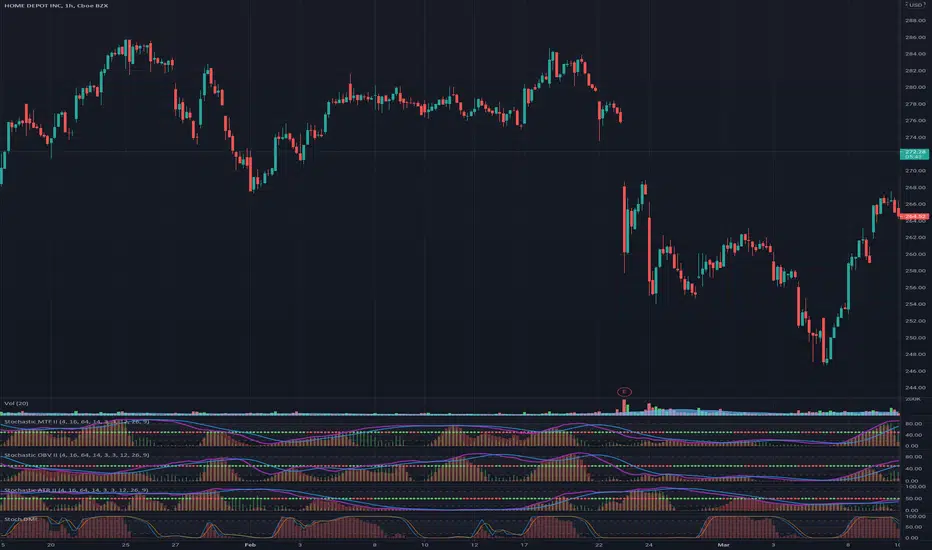
Stochastic MTF IICombines Stochastics, RSI and MACD Histogram to give a complete picture of the momentum.
The main two lines are stochastics from the higher time frame(current time frame* 4).
The red columns are stochastic of macd histogram.
The green histogram is the stochastic rsi of price.
The dots at 50 line is the correlation between price and macd+rsi combo.

Dull Volume by EpullemanDull volume indicator with Stochastic oscillator
Blue = Dull
Red = Super Dull
helps to determine low volume movement on oversold

Vol Buy/Sell %s, CMF, and Stocahstic Osc & UOPlots % Buy / Sell Volume , Chaikin Money Flow , Stochastic Oscillator, and Ultimate Oscillator on same axis, bound -1 to 1.
Show Volume Percentage, displaying buying as green and positive, selling as red and negative.
Showing the CMF, with green / red fill for positive / negative values.
Modified Stochastic Oscillator, converting bounds to -1 and 1, moving overbought/sold to -0.6 and 0.6, accordingly. Green fill (buy signal) with %D below -0.6 and %K lower than %D. Red fill (sell signal) with %D above 0.6 and %K higher than %D. Fill is between %D and bound, to be more visible.
Modified Ultimate Oscillator, converting bounds to -1 and 1, moving overbought/sold to -0.6 and 0.6, accordingly.

Stochastic with MACD filter + SL/TP + AlertsLong Arrow : close of the candle is above ema + Stochastic is oversold + MACD is below 0 + Stochastic cross up
Short Arrow : close of candle is below ema + Stochastic is overbought + MACD is above 0 + Stochastic cross down
Also added SL, 1:1 and TP where SL can be varied by ATR value and TP is set to 2:1 RR but it can be varied too.
It is not meant to take every single trade even though that might already be profitable.
For higher winrate look for the higher timeframe trend for example when trading the 15min look if the Daily 8ema is going up or down.
Also only take trades when there is either a hidden divergence on RSI or a smaller normal divergence.
The I take the normal divergenes alo when there is no higher high like an M or lower low for longs like a W these tend to work out pretty good too.
Alerts are in it too.
Have Fun :)
Uber Stochastic Index v2 + HistogramRealized how useful a histogram could be for a Stochastic, so I added it to my Uber Stochastic. It actually has two histograms - one on the primary stochastic, and one on a stochastic of the stochastic. So you can histogram while you histogram and stoch while you stoch.
The second stoch is actually really useful sometimes as a early warning but can get ugly on some settings. The histograms are also quite fast on fast settings.
What separates the Uber from the standard stoch? Well, you get 7 K stochastics, technically, to weigh together into one. Looks like one, but I assure you its 7 complete stochastics. You can have a long term stochastic with short term influence or a short term with long term influence, or have one thats all-encompassing.
Why histograms? Stochastic is already read similar to MACD, with crossover signals derived from two lines reflected in one another, one slower then the other. It just makes sense. This way, with a slower running histogram, you can more readily "see" it close in. After all, the best trades are rarely made when the stochastic crosses, but rather as it approaches crossing.
I included a lot of settings for max tweaking. The histograms seem to shift in size considerably depending how you have it set, hence the resolution settings for each. I actually recommend setting the 2nd histogram to inverted resolution, that way you can see them more clearly, but you will also see them on both sides of 0.
And yes, I offset the stochastic so the histogram would look right.
"Wealth beyond measure, Outlander" -Unknown Dunmer
Stochastic 90 30 30This is a modified version of the KD indicator, in which %K is sma30 of 90-bar stochastic and %D is sma30 of %K. Instead of using %K as sma3 of 14- or 9-bar stochastic and %D as sma3 of %K, this modification reduces the sensitivity of the indicator, providing a better trading signal for a longer trading timeframe. The indicator also provides an entry signal when %K < 50 and %K crossovers %D.
The indicator provides the best signal when using together with the turbulence indicator.

Medium Term Weighted Stochastic (STPMT) by DGTLa Stochastique Pondérée Moyen Terme (STPMT) , or Mᴇᴅɪᴜᴍ Tᴇʀᴍ Wᴇɪɢʜᴛᴇᴅ Sᴛᴏᴄʜᴀꜱᴛɪᴄꜱ created by Eric Lefort in 1999, a French trader and author of trading books
█ The STPMT indicator is a tool which concerns itself with both the direction and the timing of the market. The STPMT indicator helps the trader with:
The general trend by observing the level around which the indicator oscillates
The changes of direction in the market
The timing to open or close a position by observing the oscillations and by observing the relative position of the STPMT versus its moving average
STPMT Calculation
stpmt = (4,1 * stoch(5, 3) + 2,5 * stoch(14, 3) + stoch(45, 14) + 4 * stoch(75, 20)) / 11.6
Where the first argument of the stoch function representation above is period (length) of K and second argument smoothing period of K. The result series is then plotted as red line and its moving average as blue line. By default disabled gray lines are the components of the STPMT
The oscillations of the STPMT around its moving average define the timing to open a position as crossing of STMP line and moving average line in case when both trends have same direction. The moving average determines the direction.
Long examples
█ Tʜᴇ CYCLE Iɴᴅɪᴄᴀᴛᴏʀ is derived from the STPMT. It is
cycle = stpmt – stpmt moving average
It is indicates more clearly all buy and sell opportunities. On the other hand it does not give any information on market direction. The Cycle indicator is a great help in timing as it allows the trader to more easily see the median length of an oscillation around the average point. In this way the traders can simply use the time axis to identify both a favorable price and a favorable moment. The Cycle Indicator is presented as histogram
The Lefort indicators are not a trading strategy. They are tools for different purposes which can be combined and which can serve for trading all instruments (stocks, market indices, forex, commodities…) in a variety of time frames. Hence they can be used for both day trading and swing trading.
👉 For whom that would like simple version of the Cycle indicator on top of the main price chart with signals as presented below.
Please note that in the following code STMP moving average direction is not considered and will plot signals regardless of the direction of STMP moving average. It is not a non-repainting version too.
here is pine code for the overlay version
// © dgtrd
//@version=4
study("Medium Term Weighted Stochastic (STPMT) by DGT", "STPMT ʙʏ DGT ☼☾", true, format.price, 2, resolution="")
i_maLen = input(9 , "Stoch MA Length", minval=1)
i_periodK1 = input(5 , "K1" , minval=1)
i_smoothK1 = input(3 , "Smooth K1", minval=1)
i_weightK1 = input(4.1 , "Weight K1", minval=1, step=.1)
i_periodK2 = input(14 , "K2" , minval=1)
i_smoothK2 = input(3 , "Smooth K2", minval=1)
i_weightK2 = input(2.5 , "Weight K2", minval=1, step=.1)
i_periodK3 = input(45 , "K3" , minval=1)
i_smoothK3 = input(14 , "Smooth K3", minval=1)
i_weightK3 = input(1. , "Weight K3", minval=1, step=.1)
i_periodK4 = input(75 , "K4" , minval=1)
i_smoothK4 = input(20 , "Smooth K4", minval=1)
i_weightK4 = input(4. , "Weight K4", minval=1, step=.1)
i_data = input(false, "Components of the STPMT")
//------------------------------------------------------------------------------
// stochastic function
f_stoch(_periodK, _smoothK) => sma(stoch(close, high, low, _periodK), _smoothK)
//------------------------------------------------------------------------------
// calculations
// La Stochastique Pondérée Moyen Terme (STPMT) or Medium Term Weighted Stochastics calculation
stpmt = (i_weightK1 * f_stoch(i_periodK1, i_smoothK1) + i_weightK2 * f_stoch(i_periodK2, i_smoothK2) + i_weightK3 * f_stoch(i_periodK3, i_smoothK3) + i_weightK4 * f_stoch(i_periodK4, i_smoothK4)) / (i_weightK1 + i_weightK2 + i_weightK3 + i_weightK4)
stpmt_ma = sma(stpmt, i_maLen) // STPMT Moving Average
cycle = stpmt - stpmt_ma // Cycle Indicator
//------------------------------------------------------------------------------
// plotting
plotarrow(change(sign(cycle)), "STPMT Signals", color.green, color.red, 0, maxheight=41)
alertcondition(cross(cycle, 0), title="Trading Opportunity", message="STPMT Cycle : Probable Trade Opportunity {{exchange}}:{{ticker}}-> Price = {{close}}, Time = {{time}}")

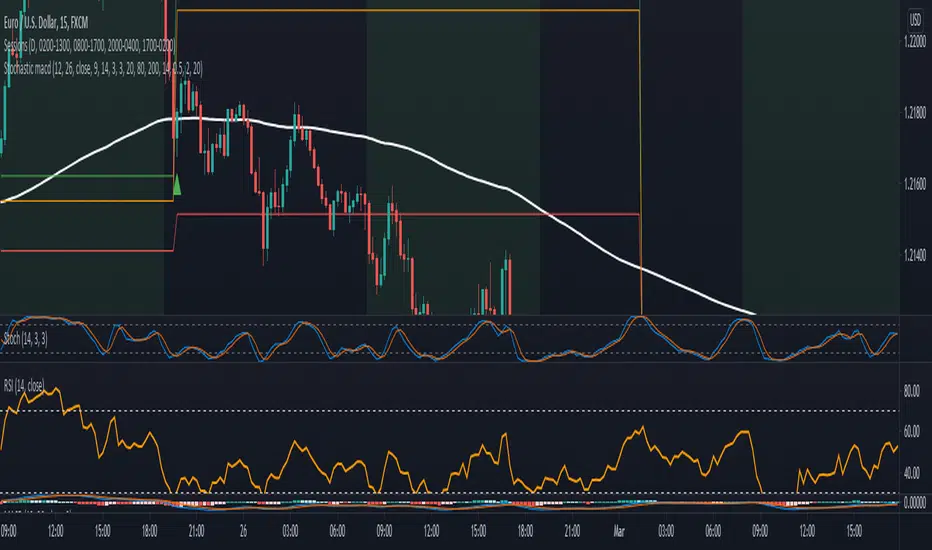
StochasticUser request. A tuned version of the built-in Stochastic indicator with the following options included:
K-D Histogram
K/D Crossovers
K/D Ribbon
Bands breakouts highlighting
Middle line crossovers background

The WWG Plan Indicator V2█ OVERALL
This indicator was specifically created for the Walsh Wealth Group.
In short it is a fusion of some of the most basic and widely used indicators to show overbought patterns and trend reversals.
Its best usage is with LTF scalping and agressive profit taking but can also be used to find HTF dips and buy-zones.
█ FEATURES
Buy Signal (Buy):
Printed only with all confirmations triggered
Small Buy Signal (B1 & B2)
Printed if some of the confirmations are triggered and can be treated as DCA entries or for further
confirmation with other indicators and basic TA.
Crayons (Color Bars):
Blue: RSI is oversold
Olive: RSI and Stoch RSI are oversold
Yellow: RSI, Stoch RSI are oversold and lower Bollinger Bands are crossed by Low
Orange: RSI, Stoch RSI and CCI are oversold
Trailing SL:
If activated in the config, a trailing SL can be displayed on the chart based on ATR.
█ SETTINGS
The underlying indicators used are RSI, Stoch RSI, Bollinger Bands, MACD and CCI.
All possible configs can be changed in the config settings.
█ GENERAL INFORMATION
Depending on the settings, the indicator performance will be highly affected.
This indicator is only displaying highly oversold areas and events of trend reversal it is not a *God*-Signal and will print false positives.
█ ALERTS
An alert for the main buy-signal is implemented and can be used via the TV alert functionality.

Stochastic with Lines - ChartWhat is Stochastic with Lines - Chart and why do you need it?
I use it for chart analysis to identify key K/D levels from which bullish / bearish market structure continues to develop.
Chart means that every K/D cross above/below the signal lines will be notified on your Chart and not on the stocahstic oscillator. To see them on your chart please choose "Stochastic with Lines - Default" in my library.
Once K or the D line cross over or under your upper or lower signal line you will see background colors which you can adjust in the settings menu.
This small indicator is for a larger project which will be uploaded in several days/weeks.

Stochastic with Lines - DefaultWhat is Stochastic with Lines - Default and why do you need it?
I use it for chart analysis to identify key K/D levels from which bullish / bearish market structure continues to develop.
Default means that every K/D cross above/below the signal lines will be notified on your Stochastic Indicator and not on your chart. To see them on your chart please choose "Stochastic with Lines - Chart" in my library.
Once K or the D line cross over or under your upper or lower signal line you will see background colors which you can adjust in the settings menu.
This small indicator is for a larger project which will be uploaded in several days/weeks.

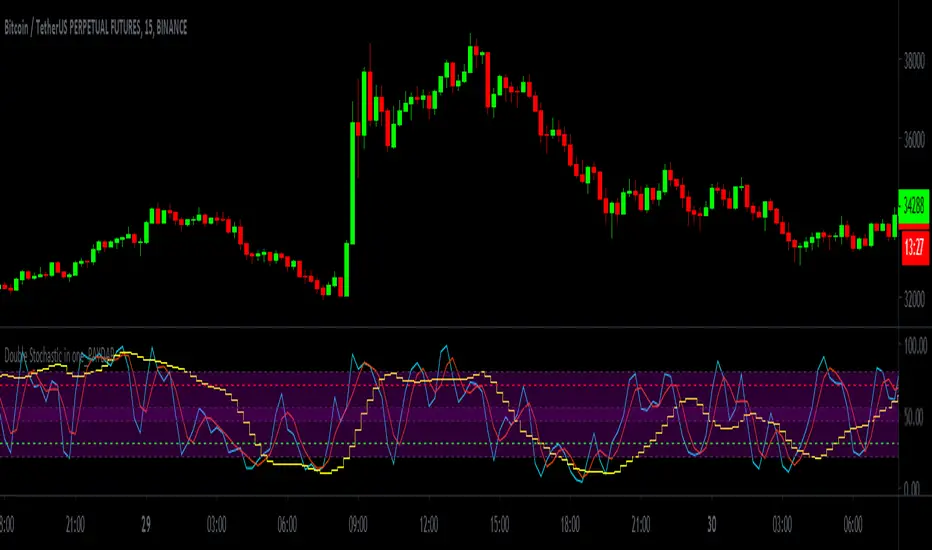
Double Stochastic in one_PAYDARDouble Stochastic in one_PAYDAR
Hello dear friends;
Double Stochastic in one_PAYDAR function:
It actually means that I have used two stochastic oscillators in one oscillator with several lines in different degrees,
First Stochastic: or "Fast Stochastic", as its name implies, is a stochastic oscillator with fast parameters and is capable of detecting small oscillations and small trends.
Second Stochastic : or "slow stochastic" means a stochastic oscillator with slow parameters and is capable of detecting slightly larger fluctuations and trends.
(Of course, here I just put parameter D, because I did not want it to be crowded.)
*** This system just Suggests you for points. ***
_____________________________________________________________________________
How to use this system ( just Suggests you) :
Buy: Whenever the first stochastic (fast stochastic ) crosses in the range of 20 or below and moves upwards, and at the same time the second stochastic (slow stochastic ) moves or crosses the green 30 line, a good time To buy or take a long position.
Sell: Whenever the first stochastic (fast stochastic ) crosses in the range of 80 or above and moves down, and at the same time the second stochastic (slow stochastic ) moves or crosses the red 70 line, a good time For sale or short position.
_____________________________________________________________________________
*** This system just Suggests you for points. ***
My suggestion is not to use this system alone and conclude about entry and exit points according to charts, news, market fluctuations and trend direction.
This system was created by Stochastic Oscillator, which is public and open source on the TradingView site.
***I used the Stochastic Oscillator as a public domain and open source on the TradingView site***
In fast stochastics the values of the parameters are set as fast motion and in slow stochastics the values of the parameters are set as slow motion. In fact, these values of the parameters according to the function and price movement in the candles are fast and slow, and I have determined these values at my suggestion, which, of course, I have consulted with several people.
For easier use and personalization for each person, I have left access to the parameters in this system and you can easily change the parameters as you like and use it optimally for yourself.
Of course, my suggestion is to use the numbers and values of the parameters I have written.
I have put different values, which I think will be very useful for trading swings and even below the daily, but you can change the values of different parameters to your liking.
This oscillator is made of a stochastic oscillator that is open source and public on the TradingView site , of course, due to the changes I have made in the parameter values and the inclusion of two stochastics in one oscillator.
*** In this system, the main and basic oscillators is used, It is available as open source and public on the TradingView site ***
Please comment on the use of this oscillator as well as how to use it and your experiences, I will definitely welcome comments and criticisms.
I am very grateful and very loyal to TradingView ,
Be successful and profitable.
scalping against trapped countertrendAbstract
This script attempts to find the end of countertrend.
This script uses oscillators to measure long term and short period trends. When the long term trend keeps positive and clear short term period is over, this script provides a buy signal.
This script does not contain pullback, cut loss and re-enter. You need to add it manually.
Introduction
Many traders want to buy when long term trend is bullish and short term pullback is over.
This is because we can take advantage to the emotion of countertrend traders.
Countertrend traders realizes their profit is finite and therefore want to protect their profit well and limit their loss.
This script is inspired by a searchable trading strategy video.
The video mentioned 4 points.
(1) long term trend. The video did not spend much ink on this point. You can use any method to observe.
(2) clear pullback bar (at least 50% body)
(3) weak bar after clear pullback
(4) entry trigger buy stop
This script attempts to quantize these points to determine trading direction.
This script is originally designed for timeframes lower than examples in the video but you can apply it on any timeframe.
Computing and Adjusting
(1) long term trend
This script uses smoothed stochastic.
(2) clear pullback bar
Since this script is originally designed for timeframes lower than examples in the video, so the condition becomes:
RSI is low enough
(3) weak bar after clear pullback
RSI goes back from low level.
(4) entry trigger buy stop
This script does not include this condition.
You can decide enter when buy stop or pullback.
Parameters
x_src : the value for computing oscillators
x_len_a : how many bars for measuring short term trend
x_len_b : how many bars for measuring long term trend
x_k_b : smooth long term trend, the average value of stochastic values
x_changk = check if clear short term pullback appears recently. 1 means do not use, larger numbers means how long of periods to check.
x_rsi_ct : threshold of short term pullback clear
x_rsi_ft : threshold of short term pullback end
Reading numbers in Strategy Tester
Most possible loss :
(1) to find rational pullback. Generally 1/3 to 2/3 atr.
(2) to find cut loss distance. Generally 1 to 2 atr.
Most possible profit :
to find if trading the opposite direction against this script is profitable.
Conclusion
This script can suggest us trading direction.
Waiting for pullback can reduce risk, compared to buy stop.
This script does not provide good signals in sideways markets.
Reference
A searchable trading strategy video

TopTenAlgo 6. Trading IndexEN: Trend & Trading Index Oscillator is an indicator developed using Stochastic which makes your day trading easier. Is it to measure price swings with a more sensitive and close to zero error margin, and is the price movement and the direction of the trend compatible? is the ideal guide to look at. The oscillator consists of a 5 step system. Depressions below -0.85 are measured to determine the intake region (Lowlander 2) at the bottom of the step. At the top of the step, enthusiastic movements above 0.90 are detected to determine the sales region(Highlander 2). The buffer zone is the BALANCE "0" zone and its highlander "0. 40 zone close to enthusiasm, and the Lowlander "-0.50" zone close to depression.
This algorithm is prepared with @Top10Algo ... Study modify...
TR: Trend & Trading Index Osiatörü Stochastic kullanırak geliştirilen ve gün içi al satlarınızı kolaylaştıran bir göstergedir. Fiyat salınımlarını daha hassas ve sıfıra yakın bir hatalama payıyla ölçmek ve fiyat hareketi ile trendin yönü uyumlu mu? bakmak için en ideal yol göstericidir. Osilatör 5 basamaklı bir sistemden oluşmaktadır. Basamağın en altında alım bögesini belirlemek için -0.85 değerinin altındaki depresyonlar(Lowlander 2) ölçülür. Basamağın en üstünde ise satış bölgesini belirlemek için 0.90 değerinin üstündeki coşkulu hareketler (Highlander 2) tespit edilir. Ara bölge ise BALANCE “0” bögesi ve onun coşkuya yakın Highlander 1 “0.40" bölgesi ile depresyona yakın Lowlander 1 “-0.50" bölgesi yer alır.
Bu algoritma @Top10Algo ile beraber hazırlanmıştır... Çalışma Prensipleri modifiye edildi...

Multi-Timeframe Stoch RSIGood evening folks!
Today I want to share with you a simple variant of the Stochastic-RSI built-in indicator.
Nothing too complex: by enabling the relative checkbox and setting the desired (k, d or the RSI ) source and timeframes, you can see higher timeframes data plotted on your screen.
Everything you need to do is enabling the indicator on the lowest timeframe (in this case 15 minutes), then you will see in YELLOW the information retrieved from the next higher timeframe (in this case 30 minutes) and in RED the information retrieved from the highest timeframe (in this case 45 minutes).
IT'S IMPORTANT THAT YOU DISPLAY THE INDICATOR ON THE LOWEST TIMEFRAME!
You can play with the overbought and oversold heights in order to have the best configuration you want (in oversold conditions is suggested to buy while in overbought conditions is suggested to sell)
The higher timeframes data are retrieved avoiding repainting since the method used for taking them is the 10th method described in this PineCoders Article , so, if you want to enable alerts, you SHOULD ignore the disclaimer message related to it without any problem.
Good Trading!
