I Stochastic#Istoch #Version_2.0.3 #Stochastic
Hello traders from all over the world! Following my last publish on I MACD indicator, today I brought up another powerful customizing tool. This time, it might be good news for those traders with blind faiths on Stochastic and any other related indicators like Stochastic RSI. Stochastic is renowned for its usefulness of identifying market cycle turns that alternate pressure of bulls and bears. Accordingly, along with RSI and MACD, Stochastic is also known as one of the popular technical indicators in recent market regardless of asset and commodity types.
Developed by George Lane in the late 1950s, Stochastic is computed by dividing difference between current and minimum value, by the difference between the maximum and minimum value within a specific range (%K Length, default = 14) as shown in the formula below. Generally, a MA(Moving Average) is used in combination with the Stochastic line whereas the %D smoothing (Default = 3) refers to the length of this MA. Keep in mind that the crosses of these two lines are considered as significantly signals particularly when they appear on the overbought/oversold zone.
Stoch = (Current Price – Min Price) / (Max Price – Min Price)
Stochastic RSI is pretty much the same concept except that it derives its value from the RSI instead of the actual price as shown in the formula below. In other words, StochRSI is basically Stochastic of the RSI. Recently, it seems that many traders prefer StochRSI over classic Stochastic considering the virtue of StochRSI that it reflects proper degree of wave. Furthermore, StochRSI filters out many false signals by smoothing out the noises and outliers, compared to the regular Stochastic.
StochRSI = (Current RSI – Min RSI) / (Max RSI – Min RSI)
Anyhow, it surely has been verified that “Stochastic-fying” the RSI is technically beneficial when comprehending the market trends and spotting the potential trend reversal points. But what if other indicators instead of RSI was combined with the Stochastic? There are countless cutting-edge technical indicators developed by many traders in contemporary markets that are better fitted to the recent markets. This idea inspired me to create this tool that we can test other combinations of different parameters and indicators used within the Stochastic.
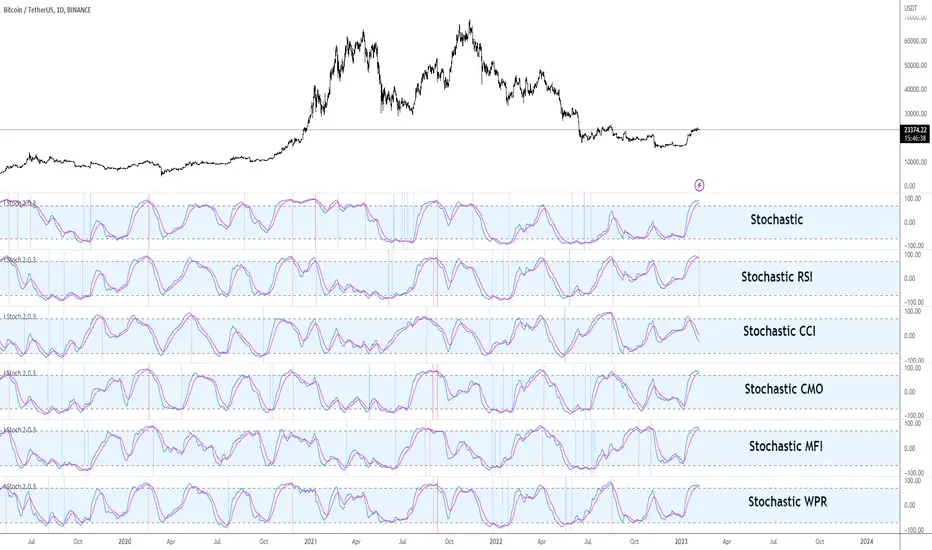
I Stoch provides traders the perfect back-testing environment for Stochastic indicator. Why not Stochastic CCI, ATR, CMO, MFI, and ROC? There might be better combinations of setups that are more optimal within the Stochastic. With this, you can design and test various types of indicators to “Stochastic-fy” also with different settings, lengths or sensitivities just fitted for your own trading style. For example, I found 14, 14, 60, 60, EMA(instead of SMA), and RSI parameters useful for myself which is the default setting.
Furthermore, for your convenience I added a few extra side features in setting as listed below. You can turn these on and off accordingly to your preferences and circumstances.
1. Crossovers of Stochastic line and MA: Death-crosses on overbought and golden-crosses on oversold area are signaled with vertical lines.
2. Histogram: Just like the MACD oscillator, this feature visualizes the distance between the Stochastic line and the MA. The greater histogram bar is the wider the distance is between these two lines.
3. Divergence Sensitivity: This feature spots both the regular and hidden divergences of Stochastic line. Higher sensitivity searches for the divergences within the waves of the larger degree and vice versa for the lower sensitivity.
Please let me know if you get to find out some insightful combinations of parameters. Thank you. Your subscriptions, likes, and comments inspire me a lot!
#Istoch #스토캐스틱
안녕하세요 트레이더 여러분. 토미입니다.
지난번 I MACD라는 커스터마이징 지표에 이어 제가 최근에 오랜 공을 들인 I Stochastic 지표에 대해 소개도 드릴 겸 간단한 강의를 준비해봤습니다.
1950년대 George Lane이라는 사람에 의해 개발된 스토캐스틱은 RSI 그리고 MACD와 더불어 요즘 차트 세계에서 가장 대중적으로 이용되는 보조지표입니다. 아래 공식과 같이 본 지표는 주어진 기간 동안의 가격 변동폭과 현재 가격의 상대적 관계를 통해 현 추세의 정도와 잠재적 변곡점을 알려줍니다. 다른 지표들에 비해 노이즈 빈도는 조금 높지만 추세 반전 신호를 꽤 빨리 알려준다는 점과 해석이 직관적이라는 점에서 요즘 많은 트레이더분들의 최애 지표 중 하나로 뽑힙니다.
스토캐스틱 = (현재가 - K길이 중 최저가) / (K길이 중 최고가 – K길이 중 최저가)
한편 스토캐스틱 RSI는 주가가 아닌 RSI에서 도출한 값을 스토캐스틱화 시켜놓은 보조지표이며 아래 공식에서 보실 수 있듯 다른 말로 RSI의 스토캐스틱이라고 보시면 됩니다. 최근에는 일반 스토캐스틱보다 파동의 사이클을 더 잘 반영하고 노이즈 및 Outlier들을 잘 처리해준다는 장점들 때문에 스토캐스틱 RSI를 더 선호하는 트레이더분들이 많아졌습니다.
스토캐스틱 RSI = (현재 RSI – K길이 중 최저 RSI) / (K길이 중 최고 RSI – K길이 중 최저 RSI)
이렇듯 RSI를 스토캐스틱화한 지표는 존재하는데 왜 CCI, MFO, 그리고 CMO 등 다른 지표를 스토캐스틱화한 지표는 없을까요? 왜 스토캐스틱 CCI, 스토캐스틱 MFO, 그리고 스토캐스틱 CMO는 안쓸까요? 요즘 모두 다 비슷한 지표들을 보는 마당에 더 좋은 조합의 스토캐스틱 지표가 존재하지 않을까요? 이러한 발상을 시작으로 이것저것 테스팅도 해볼 겸 해당 지표의 최적화 테스팅 툴을 만들어봤습니다. RSI가 아닌 다른 보조지표들도 클릭 하나로 쉽게 스토캐스틱화 시킬 수 있게끔 디자인해봤습니다.
오늘날 보편적으로 사용되고 있는 스토캐스틱 RSI 기본 설정 값은 3, 3, 14, 14 SMA입니다. RSI 보다 스토캐스틱에 더 잘 맞는 지표 종류뿐만 아니라 더 최적화된 파라미터 값들이 분명 존재할 겁니다. 여러 조합의 테스트를 통해 주가를 더 잘 반영하는 설정 값을 찾아보면 좋을 듯 싶습니다. 제가 찾은 스토캐스틱 RSI 설정 값은 14, 14, 60, 60 EMA로 기존보다 조금 더 큰 추세를 반영해주는 나쁘지 않은 조합인듯 싶어 디폴트 값으로 설정해 두었습니다. 여러분들도 괜찮은 지표 종류 및 설정 값들 찾으면 치사하게 혼자 쓰지 말고 꼭 공유 부탁드립니다!
또한 주요 시그널들을 쉽게 잡아낼 수 있게 아래와 같이 몇가지 자동 기능들을 추가했습니다. 여러분들의 편의와 상황에 따라 사용하셔도 되고 거슬리면 끄셔도 됩니다.
1. 스토캐스틱 두 선들의 크로스: 과매수 구간에서 데드크로스, 과매도 구간에서 골든크로스가 발생하면 세로줄이 떠서 알려줍니다. 이 줄이 뜨면 어느정도 추세의 변환의 시그널로 볼 수 있습니다.
2. 히스토그램: MACD처럼 두 선들의 이격도 혹은 간격을 히스토그램 오실레이터처럼 표시해주는 기능입니다. 혹시 몰라서 넣었습니다.
3. 다이버전스 및 민감도: 스토캐스틱 선의 다이버전스를 표시해줍니다. 민감도를 키울수록 더 큰 단위의 파동 사이클을 기반으로 다이버전스를 잡아냅니다.
트레이딩뷰 차트 상단 지표 창에 I Stoch 검색하시거나 밑에 즐겨찾기 인디케이터 넣기 클릭하시면 사용하실 수 있습니다. 그럼 이만 마치겠습니다. 감사합니다.
여러분의 구독, 좋아요, 그리고 댓글은 저에게 큰 동기부여가 됩니다.
Stochasticcci
Multi Oscillators Price LevelsThis script draws price levels corresponding to the highest price reached in overbought situations, and the lowest price reached in oversold situations, depending on the oscillator and the timeframe the user has configured.
These levels correspond, most of time, to good supports and resistances prices.
Price levels drawings can be based on the following indicators:
Stochastic RSI (default)
Stochastic CCI
RSI
CCI
You can customize this indicator with the following options:
Source: The candle source to use in indicators calculation
Source Indicator: The indicator on which you cant to base your levels
Timeframe: The timeframe on which you want to apply the selected indicator, and calculate levels
Show supports/resistances: enable/disable price levels, depending on there status (overbought - resistances) / (oversold - supports)
Lines width: width of price levels. (set to 10 by default in order to draw "zones")
Supports/Resistances source: Select the candle data you cant to use to draw supports and resistances levels
Extend levels: Select the line extension for price levels
Levels color: Select the desired color for price levels
And of course , all parameters corresponding to the supported indicators (Stoch, RSI, CCI)
Here are a few examples of different configurations:
This script will probably be modified in the future, don't hesitate to suggest any improvement.

CCI Stochastic and a quick lesson on Scalping & Trading SystemsHello traders
Still on holidays but I don't and will never forget you <3
I realize more and more that you guys don't only want some indicators and learn about pinescript. You also want some guidance and get some mentors providing you with comprehensive and simple trading methods and tricks.
I'm against those posting many scripts a day that in the end will make you lose your money because they don't give you the methodology to use them
It might look nice on the charts but we're not here to do some painting.... but to improve our lifestyle right :)
The today indicator is based on an indicator that I used for scalping : Fxcodebase CCI Stochastic
A CCI stochastic is very reactive and allows us to take many scalps trades per day with a few pips/USD gain for each trade. I don't recommend novice traders to use it and I strongly recommend everyone reading my disclaimer below basically saying "I'm not a financial advisor, don't be dumb, stay safe"
(I also recommend the few scripts copy-pasters to read my disclaimer as well)
What's a novice trader, sir? Well... thanks for asking. A novice trader is any trader with less than 5 years of live trading experience
From a pinescript perspective, this script will be however interesting for everyone :)
How to use it?
The indicator gives 3 possible entries for Longs and Shorts:
- Arrows at Enter - Will give signals whenever the Stoch CCI will enter in the BUY/SELL zone
- Arrows at Exit - Will give signals whenever the Stoch CCI will exit the BUY/SELL zone
- Arrows at Center - Signals whenever the Stoch CCI will cross the mid-line (50)
All arrows have different colors because ... painting is cool and nice.... kidding.... it gives clearer and more readable signals on the chart (but painting sir...)
A possible trading method could be to use the 3 modes at the same time to get the maximum of opportunities.
The safer bet is to use the "Arrows at Exit" only mode but for those who want to accumulate more scalping positions, adding the "Arrows at Enter" mode is an option as well. In other words, you accumulate a few scalping positions whenever the Stoch CCI get in the BUY/SELL zone and will stop accumulating whenever it will exit the BUY/SELL zone
You can add a few extra positions whenever the Stoch CCI will cross the mid-line as it often translates in a trend continuation
Life hack
Very important note : (probably the most important gem I shared until now) The inputs set by default will have to be changed for your asset/timeframe and can't be generic for everything. You have to play with the inputs until the signals will make sense to you
The indicator/strategy with a unique configuration that you'll never check or update according to the market condition DOES NOT exit.
If you find such a tool and prove me that you're making constant gains with it over a year, please patent it and then show it to me as I'd like to study it to replicate :) But most likely this is a myth/unicorn
Who I am to say this? Well, I worked in a Bank with real traders and I have a good sense of what works and what will certainly not work
My guru said scalping crypto in 1 second timeframe was the way to get rich quick. Do you agree sir?
But in trading, this is not because you take the maximum of trades possible that your gains will increase. This is the contrary.
There is a strong and proven inverse correlation between the number of trades taken and how fast you'll burn your capital. A swing trader taking 2/3 trades a month is more likely to beat 99% of the scalpers out there trying to predict all market movements. (and I'm not even talking about how dangerous it is to scalp with leverage)
You're starting to know me a bit more right now. I prefer to tell you what you need to hear vs what you want to hear because the second option doesn't allow to stay in the game very long.
I might lose some futures clients along the way by saying that but for my own conscience and ethics, I prefer to warn about the true risks of trading and to select who you listen very carefully (the advice also works for me, if you feel what I said doesn't make sense, this is totally your right but I hope this is because I'm french and not because of the content ^^).
See you tomorrow for another indicator or idea
Love you all
Dave
____________________________________________________________
Be sure to hit the thumbs up. Building those indicators take a lot of time and likes are always rewarding for me :) (tips are accepted too)
- If you want to suggest some indicators that I can develop and share with the community, please use my personal TRELLO board
- I'm an officially approved PineEditor/LUA/MT4 approved mentor on codementor. You can request a coaching with me if you want and I'll teach you how to build kick-ass indicators and strategies
Jump on a 1 to 1 coaching with me
- You can also hire for a custom dev of your indicator/strategy/bot/chrome extension/python
Disclaimer:
Trading involves a high level of financial risk, and may not be appropriate because you may experience losses greater than your deposit. Leverage can be against you.
Do not trade with capital that you can not afford to lose. You must be aware and have a complete understanding of all the risks associated with the market and trading. We can not be held responsible for any loss you incur.
Trading also involves risks of gambling addiction.
Please notice I do not provide financial advice - my indicators, strategies, educational ideas are intended to provide only some source code for anyone interested in improving their trading
The proprietary indicators and strategies developed by Best Trading Indicator, the object of intellectual property rights are and remain the exclusive property of Best Trading Indicator, at the exclusion of images and videos and texts free of rights or provided by the Company or external legal or physical person.
No assignment of intellectual property rights is carried out through these Terms and Conditions.
Any total or partial reproduction, modification or use of these properties for any reason whatsoever is strictly prohibited without the express written authorization of the Company.

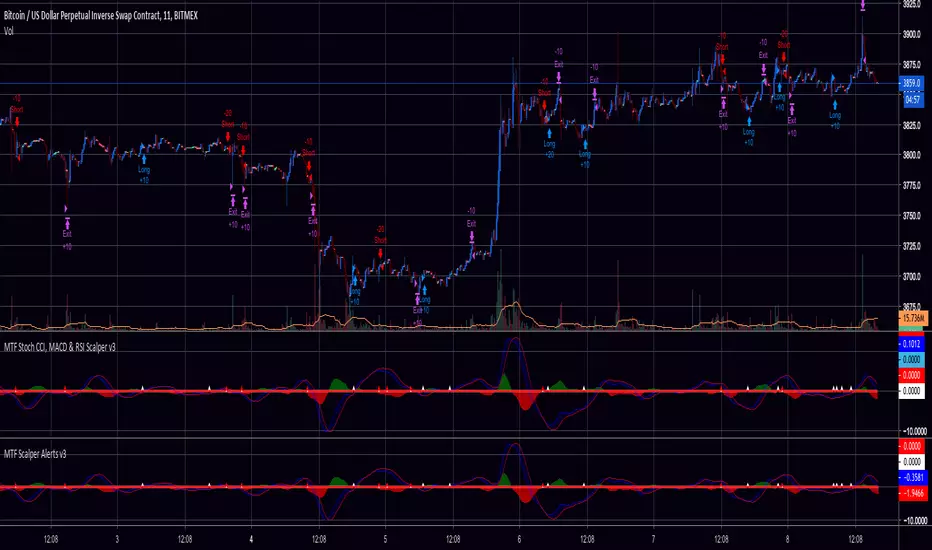
MTF Scalper for XBTUSDI've combined Stochastic CCI, MACD-DEMA and RSI on multiple timeframes to create this scalper for Bitmex XBTUSD
For personal use and friends only.