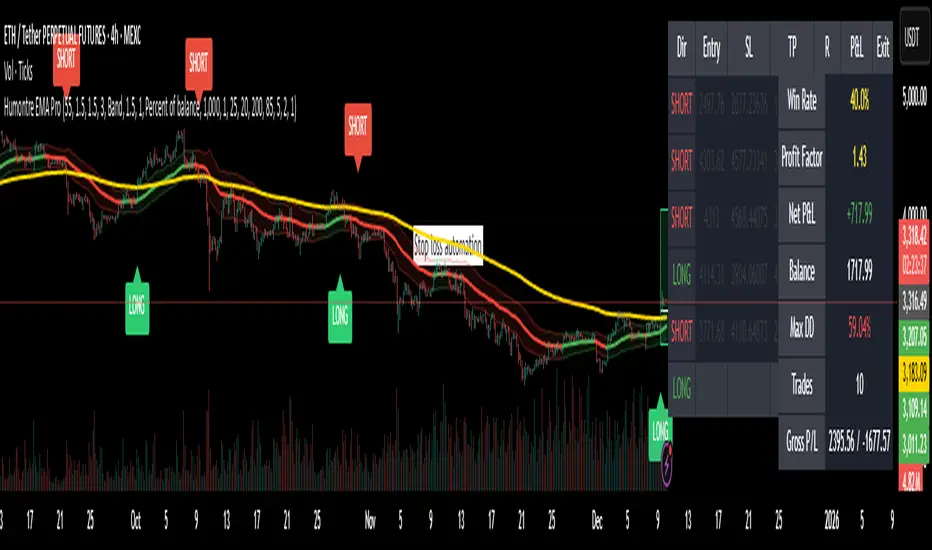
Adaptive Breakout & Risk Engine — Humontre EMA ProHumontre EMA Pro is a professional-grade trading system built for traders who want structure, clarity and real risk management integrated into every trade.
✔ No repainting
Instead of chasing signals or relying on unrealistic “high winrate” promises, this tool provides a consistent, repeatable process based on:
✔ Adaptive EMA breakout logic
✔ ATR-driven volatility channels
✔ Automatic SL/TP placement
✔ True R-multiple tracking
✔ Live trade visualization
✔ Smart signal filtering
✔ Performance statistics directly on the chart
This is more than an indicator — it’s a fully structured framework for traders who want discipline, confidence and objective risk management.
What’s included
✔ Private access to Humontre EMA Pro on TradingView
✔ Full feature set: breakout signals, EMA channel, risk engine
✔ Trailing stop system
✔ Live trade box & trade history table
✔ Win rate, profit factor, drawdown & R-metrics panel
✔ Alerts with Entry, SL, TP & risk-to-reward
✔ Continuous improvements & updates
Whether you're learning structure or refining your current system, this tool offers a clean and objective approach to trending markets: crypto, forex, metals and indices.
👤 About Humontre
I'm a trader and IT engineer who enjoys building tools that bring structure and clarity to the markets.
Humontre EMA Pro was designed to help traders visualize risk and understand trend dynamics with precision.
⚠️ Important
This is educational software. It does not guarantee profit.
Trading always carries risk.
Key Features
✔ Adapts to market volatility for precise SL/TP placement
✔ Trailing stop system
✔ Calculates Entry, Stop Loss, Take Profit and R-Multiples
✔ Filters duplicate entries and only signals the first valid setup per trend
✔ Visualizes active/past trades with P&L, R-values and exit reasons
✔ Detects high-quality trend breakouts using a dynamic EMA channel
Stop
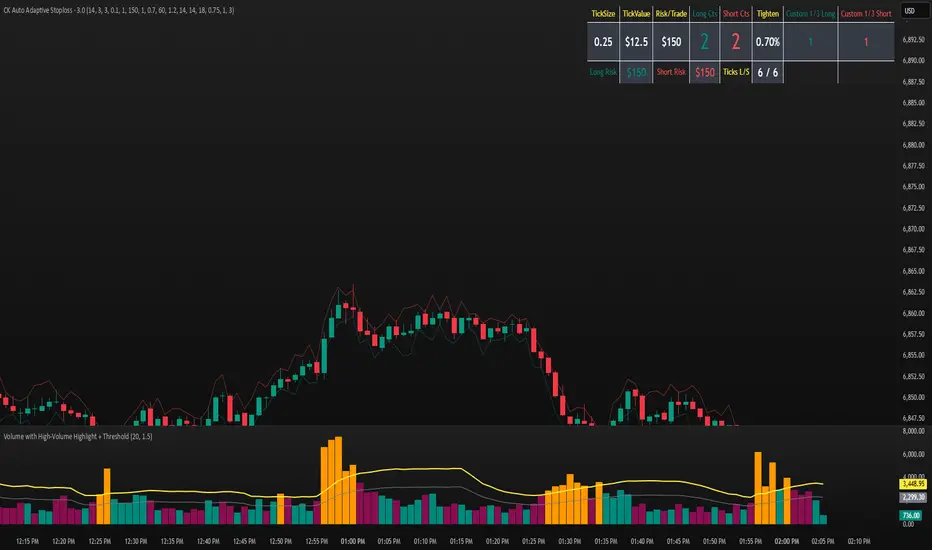
CK Auto Adaptive StoplossThis tool automatically finds the best stop-loss for every trade by analyzing candle structure, ATR volatility, volume spikes, and market momentum. It tightens or widens the stop dynamically and shows you exactly how many contracts you can use based on your risk per trade.
It also plots bold stop-loss lines on your chart and includes a live position-sizing table so you always stay consistent.
ATR or % Based Trailing Stop for Delta Exchange (trade_crush)This indicator calculates and visually displays a dynamic trailing stop line on the chart based on either the Average True Range (ATR) or a fixed percentage of the current close price. Designed especially for futures or crypto traders using Delta Exchange, it helps determine where to place trailing stop loss orders to manage risk effectively.

Stop Loss and TargetsEnter your purchase price, SL% and up to 3x TP%s. Automatically plots them on your chart to enable quicker set up of alerts.

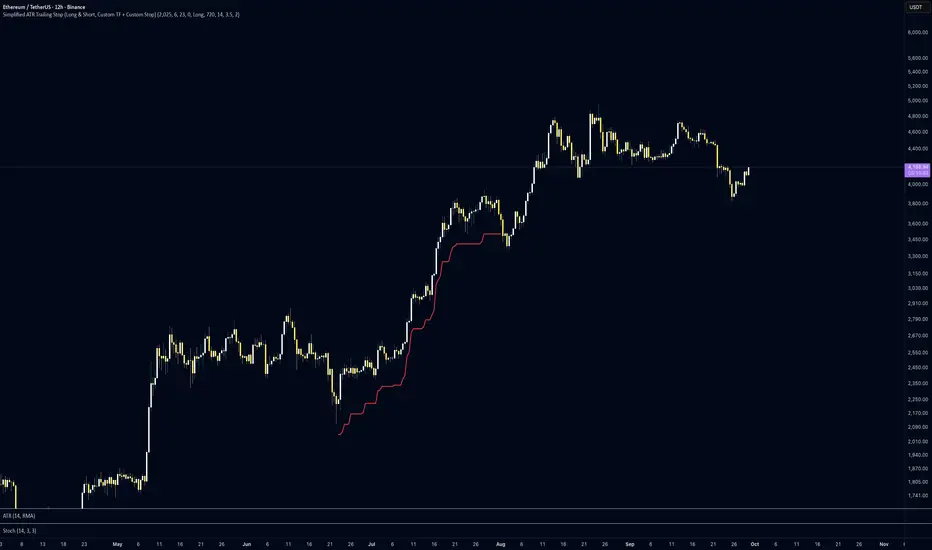
Simplified ATR Trailing Stop (Long & Short, Custom TF + Stop)This indicator plots a dynamic ATR-based trailing stop that adapts to price volatility and keeps you protected whether you’re trading long or short. It’s lightweight, customisable, and designed for traders who want clean risk management without unnecessary complexity.
✨ Key Features:
📅 Custom Entry Date & Price – choose the exact day you want the trailing stop to begin, or let it auto-start from the close.
🔀 Long or Short Mode – flip between bullish and bearish trade setups.
⏱️ Custom Timeframe Support – calculate ATR stops on any higher/lower timeframe (from 10m to 1M) for maximum flexibility.
📏 ATR-Based Logic – trailing stop adjusts dynamically using a multiplier of ATR, keeping stops adaptive to volatility.
🎯 Custom First-Day Stop – set a different ATR factor for day one to handle entries more cautiously.
✅ Stop Trigger Mode – choose between:
Stop on Wick Breach (default intraday aggressiveness)
Stop on Candle Close (extra confirmation, fewer false stops).
📊 How to Use:
Set your entry date and price (or leave price = 0 to use that day’s close).
Select trade direction (Long or Short).
Pick your ATR period, multiplier, and timeframe.
Watch the trailing stop line update automatically until it’s breached.
This tool is great for swing traders, intraday strategists, and anyone who wants a simple yet powerful trailing stop that adapts to price volatility.
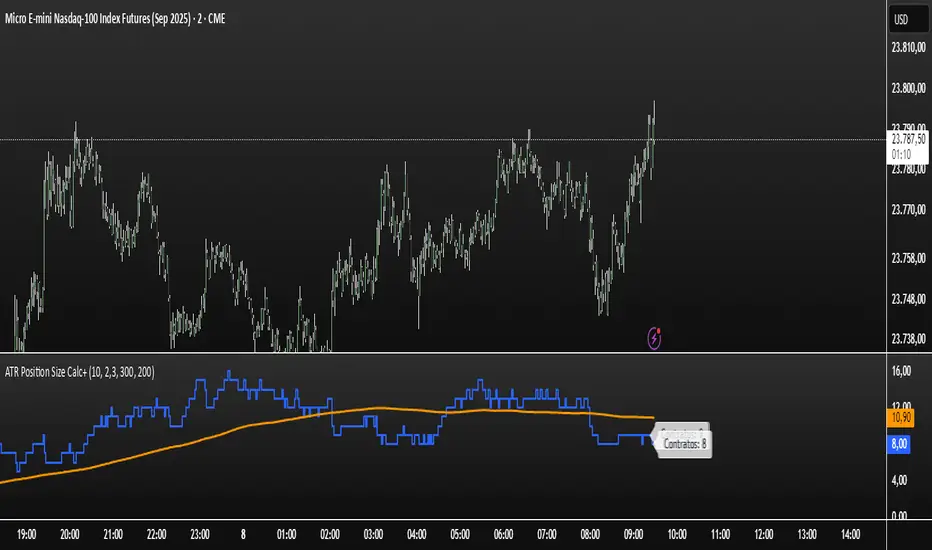
ATR Position Size Calc+Stop guessing your position size. This indicator automatically calculates the optimal number of contracts or shares for each trade.
It is designed for one purpose: to help you maintain consistent risk management by adjusting your trade size based on current market volatility (ATR) and your fixed monetary risk.
// KEY FEATURES
Consistent Risk : Set your max risk in dollars (e.g., $300), and the script calculates the exact position size to match it.
Volatility-Based Stops : Uses the ATR to define a logical stop loss that adapts to market conditions.
Stable Calculation : The calculation is based on the previous closed candle, so the value is reliable and doesn't change intra-bar.
// HOW TO USE
In the settings, simply define your max risk per trade ($) and your ATR parameters. The indicator does the rest.
The essential tool for disciplined trading.
% / ATR Buy, Target, Stop + Overlay & P/L% / ATR Buy, Target, Stop + Overlay & P/L
This tool combines volatility‑based and fixed‑percentage trade planning into a single, on‑chart overlay—with built‑in profit‑and‑loss estimates. Toggle between ATR or percentage modes, plot your Buy, Target and Stop levels, and see the dollar gain or loss for a specified position size—all in one interactive table and chart display.
NOTE: To activate plotted lines, price labels, P/L rows and table values, enter a Buy Price greater than zero.
What It Does
Mode Toggle: Choose between “ATR” (volatility‑based) or “%” (fixed‑percentage) calculations.
Buy Price Input: Manually enter your entry price.
ATR Mode:
Target = Buy + (ATR × Target Multiplier)
Stop = Buy − (ATR × Stop Multiplier)
Percentage Mode:
Target = Buy × (1 + Target % / 100)
Stop = Buy × (1 – Stop % / 100)
P/L Estimates: Specify a dollar amount to “invest” at your Buy price, and the script calculates:
Gain ($): Profit if Target is hit
Loss ($): Cost if Stop is hit
Visual Overlay: Draws horizontal lines for Buy, Target and Stop, with optional price labels on the chart scale.
Interactive Table: Displays Buy, Target, Stop, ATR/timeframe info (in ATR mode), percentages (in % mode), and P/L rows.
Customization Options
Line Settings:
Choose color, style (solid/dashed/dotted), and width for Buy, Target, Stop lines.
Extend lines rightward only or in both directions.
Table Settings:
Position the table (top/bottom × left/right).
Toggle individual rows: Buy Price; Target (multiplier or %); Stop (multiplier or %); Target ATR %; Stop ATR %; ATR Time Frame; ATR Value; Gain ($); Loss ($).
Customize text colors for each row and background transparency.
General Inputs:
ATR length and optional ATR timeframe override (e.g. use daily ATR on an intraday chart).
Target/Stop multipliers or percentages.
Dollar Amount for P/L calculations.
How to Use It for Trading
Plan Your Entry: Enter your intended Buy Price and position size (dollar amount).
Select Mode: Toggle between ATR or % mode depending on whether you prefer volatility‑based or fixed offsets.
Assess R:R and P/L: Instantly see your Target, Stop levels, and potential profit or loss in dollars.
Visual Reference: Lines and price labels update in real time as you tweak inputs—ideal for live trading, backtesting or trade journaling.
Ideal For
Traders who want both volatility‑based and percentage‑based exit options in one tool
Those who need on‑chart P/L estimates based on position size
Swing and intraday traders focused on objective, rule‑based trade management
Anyone who uses ATR for adaptive stops/targets or fixed percentages for simpler exits
NQ Position Size CalculatorNQ Position Size Line Calculator is designed specifically for Nasdaq 100 futures (NQ) and micro futures (MNQ) traders who want to maintain disciplined risk management. This visual tool eliminates the guesswork from position sizing by displaying distance lines and contract calculations directly on your chart.
The indicator creates horizontal lines at 10-tick intervals from your stop loss level, showing you exactly how many contracts to trade at each distance to maintain your predetermined risk amount. Whether you're trading regular NQ contracts or micro MNQ contracts, this calculator ensures you never risk more than intended while providing instant visual feedback for optimal position sizing decisions.
How to Use the Indicator
Step 1: Configure Your Settings
Stop Loss Price: Enter your exact stop loss level (e.g., 20000.00)
Risk Amount ($): Set your maximum dollar risk per trade (e.g., $500)
Contract Type: Choose between:
NQ (Regular): $5 per tick - for larger accounts
MNQ (Micro): $0.50 per tick - for smaller accounts or conservative sizing
Display Options:
Max Lines: Number of distance lines to show (default: 30)
Show Labels: Toggle tick distance and contract count labels
Line Color: Customize the color of distance lines
Label Size: Choose tiny, small, or normal label sizes
Step 2: Read the Visual Display
Once configured, the indicator displays:
Stop Loss Line:
Thick yellow line marking your exact stop loss level
Yellow label showing the stop loss price
Distance Lines:
Dashed red lines at 10-tick intervals above and below your stop loss
Lines appear on both sides for long and short position planning
Labels (if enabled):
Green labels (right side): For long positions above your stop loss
Red labels (left side): For short positions below your stop loss
Format: "20T 5x" means 20 ticks distance, 5 contracts maximum
Step 3: Use the Information Tables
The indicator provides two helpful tables:
Position Size Table (top-right):
Shows common tick distances (10, 20, 40, 80, 160 ticks)
Displays risk per contract at each distance
Contract count for your specified risk amount
Total risk with rounded contract numbers
Settings Table (bottom-right):
Confirms your current risk amount
Shows selected contract type
Displays current settings for quick reference
Step 4: Apply to Your Trading
For Long Positions:
Look at the green labels on the right side of your chart
Find your desired entry level
Read the label to see: distance in ticks and maximum contracts
Example: "30T 8x" = 30 ticks from stop, buy 8 contracts maximum
For Short Positions:
Look at the red labels on the left side of your chart
Find your desired entry level
Read the label for tick distance and contract count
Example: "40T 6x" = 40 ticks from stop, sell 6 contracts maximum
Step 5: Trading Execution
Before Entering a Trade:
Identify your stop loss level and input it into the indicator
Choose your entry point by looking at the distance lines
Note the contract count from the corresponding label
Verify the risk amount matches your trading plan
Execute your trade with the calculated position size
Risk Management Features:
Contract rounding: All position sizes are rounded down (never up) to ensure you don't exceed your risk limit
Zero position filtering: Lines only show where position size is at least 1 contract
Dual-sided display: Plan both long and short opportunities simultaneously

Statistical Trailing Stop [LuxAlgo]The Statistical Trailing Stop tool offers traders a way to lock in profits in trending markets with four statistical levels based on the log-normal distribution of volatility.
The indicator also features a dashboard with statistics of all detected signals.
🔶 USAGE
The tool works out of the box, traders can adjust the data used with two parameters: data & distribution length.
By default, the tool takes volatility measures of groups of 10 candles, and statistical measures of the last 100 of these groups then traders can adjust the base level to use as trailing, the larger the level, the more resistant the tool will be to moves against the trend.
🔹 Base Levels
Traders can choose up to 4 different levels of trailing, all based on the statistical distribution of volatility.
As we can see in the chart above, each higher level is more resistant to market movements, so level 0 is the most reactive and level 3 the least.
It is up to the trader to determine the best level for each underlying, time frame and market conditions.
🔹 Dashboard
The tool provides a dashboard with the statistics of all trades, making it very easy to assess the performance of the parameters used for any given market.
As we can see on the chart, all Daily BTC signals with default parameters but different base levels, level 2 is the best performing of all four, giving a positive expectation of $2435 per trade, taking into account all long and short trades.
Of note are the long trades with a win rate of 76.47% and a risk-to-reward of 3.34, giving a positive expectation of $4839 per trade, with winners having an average duration of 210 days and losers 32 days.
This, compared to short trades with negative expectation, speaks to the uptrend bias of this particular market.
🔶 SETTINGS
Data Length: Select how many bars to use per data point
Distribution Length: Select how many data points the distribution will have
Base Level: Choose between 4 different trailing levels
🔹 Dashboard
Show Statistics: Enable/disable dashboard
Position: Select dashboard position
Size: Select dashboard size

Liquidity VisualizerThe "Liquidity Visualizer" indicator is designed to help traders visualize potential areas of liquidity on a price chart. In trading, liquidity often accumulates around key levels where market participants have placed their stop orders or pending orders. These levels are commonly found at significant highs and lows, where traders tend to set their stop-losses or take-profit orders. The indicator aims to highlight these areas by drawing unbroken lines that extend indefinitely until breached by the price action.
Specifically, this indicator identifies and marks pivot highs and pivot lows, which are price levels where a trend changes direction. When a pivot high or pivot low is formed, it is represented on the chart with a horizontal line that continues to extend until the price touches or surpasses that level. The line remains in place as long as the level remains unbroken, which means there is potential liquidity still resting at that level.
The concept behind this indicator is that liquidity is likely to be resting at unbroken pivot points. These levels are areas where stop-loss orders or pending buy/sell orders may have accumulated, making them attractive zones for large market participants, such as institutions, to target. By visualizing these unbroken levels, traders can gain insight into where liquidity might be concentrated and where potential price reversals or significant movements could occur as liquidity is taken out.
The indicator helps traders make more informed decisions by showing them key price levels that may attract significant market activity. For instance, if a trader sees multiple unbroken pivot high lines above the current price, they might infer that there is a cluster of liquidity in that area, which could lead to a price spike as those levels are breached. Similarly, unbroken pivot lows may indicate areas where downside liquidity is concentrated.
In summary, this indicator acts as a "liquidity visualizer," providing traders with a clear, visual representation of potential liquidity resting at significant pivot points. This information can be valuable for understanding where price might be drawn to, and where large movements might occur as liquidity is targeted and removed by market participants.

Trailing Stop ProTrailing Stop Pro is a sophisticated TradingView indicator designed to enhance your trading strategy by dynamically managing trailing stops based on market volatility. This tool leverages the Average True Range (ATR) to adjust stop levels, providing traders with a robust mechanism to protect profits and minimize losses.
Key Features:
Dynamic Trailing Stops: Automatically adjusts stop levels using ATR, allowing for responsive and adaptive risk management.
Customizable Inputs: Tailor the indicator to your trading style with adjustable parameters such as ATR Length, ATR Multiplier, and Source Vector.
Visual Clarity: Distinct color settings for long and short stops, with adjustable line thickness and transparency, ensuring clear visualization on your charts.
Professional Grade: The "Pro" designation signifies advanced features suitable for both novice and experienced traders seeking reliable and efficient stop management.
How It Works:
To set up the indicator, begin by defining the Chrono Point, which specifies the exact time you want the trailing stop mechanism to activate. This allows for precise control over when your stops begin to trail. Next, set the Credit Unit as the initial entry price for your trade, serving as the baseline from which the trailing stops will adjust.
The indicator uses ATR-based adjustments to determine stop levels. Customize the sensitivity of the trailing stop by adjusting the ATR Length (default is 14) and ATR Multiplier (default is 0.5). A longer ATR length smooths out volatility, while a higher multiplier increases the distance of the stop from the price.
Select your Source Vector from "High/Low," "Close," or "Open" prices as the basis for stop calculation. This flexibility allows you to align the indicator with your preferred trading strategy. The indicator plots trailing stops directly on the chart, with color-coded lines indicating long (teal) and short (red) positions. You can adjust the line thickness and transparency for optimal visibility.
The Mission Status feature automatically detects whether the trade is long or short and adjusts the trailing stop accordingly. If the price hits the trailing stop, the trade is considered exited, and the indicator calculates the profit or loss percentage.
Benefits:
Risk Management: Protect your trades from adverse market movements while locking in profits as prices move favorably.
Automation: Reduce manual intervention with automatic stop adjustments, allowing you to focus on strategic decision-making.
User-Friendly Interface: Intuitive settings and clear visual cues make it easy to integrate into your existing trading workflow.
Conclusion:
Trailing Stop Pro is an essential tool for traders looking to enhance their risk management strategies with precision and ease. By automating the trailing stop process and providing clear visual feedback, this indicator empowers you to navigate the markets with confidence. Whether you're a seasoned trader or just starting, Trailing Stop Pro offers the functionality and flexibility needed to optimize your trading performance.
The Trailing Stop Pro indicator is a tool designed to assist traders in managing risk and optimizing their trading strategies. However, it should not be considered as financial advice or a guarantee of profitability. Trading involves significant risk, and it is possible to lose more than your initial investment. Users are encouraged to thoroughly test the indicator in a demo environment and consider their own financial situation and risk tolerance before using it in live trading. Past performance is not indicative of future results, and users should seek advice from a qualified financial advisor if needed.

Custom ATR Trailing StopThis Script creates a custom ATR (Average True Range) trailing stop. It allows traders to set up automated stop-loss levels based on the ATR, which adjusts dynamically to market volatility. The script is designed to support both long and short trades, offering flexibility and precision in trade management.
When loading the indicator to your chart, simply click to set the trade begining time, confirm various settings and you are set.
Check tooltips for more details in the input settigns menu.
User Inputs
Trade Setup: Allows users to set the trade direction (Long or Short), the signal source for entries, and the specific bar time for the trade setup.
ATR Settings: Configurable ATR lookback period, ATR smoothing period, initial ATR multiplier for setting the stop-loss, breakeven ATR multiplier, and a manual breakeven level.
ATR Calculations
Computes the ATR and its moving average.
Determines initial and breakeven stop levels based on the ATR.
Signal Validation
Validates long or short trade signals based on the specified bar time and trade direction.
Triggers alerts when a valid trade signal is detected.
Trailing Stop Logic
For long trades, adjusts the stop-loss level dynamically based on the ATR.
For short trades, performs similar adjustments in the opposite direction.
Updates the trailing stop level to ensure it follows the price, moving closer as the price moves favorably.
Resets the trade state when the stop-loss is hit, triggering an alert.
Plotting
Plots the trailing stop levels on the chart.
Uses green for stop levels indicating profit and red for stop levels indicating a loss.

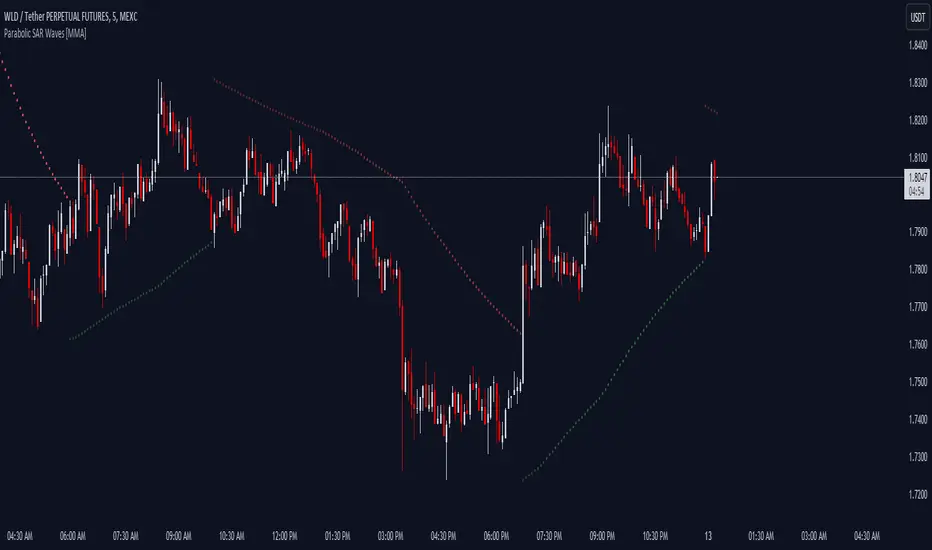
Parabolic SAR Waves [MMA]Parabolic SAR Waves
Description:
The "Parabolic SAR Waves " is an advanced version of the traditional Parabolic SAR indicator, customized for TradingView. This script incorporates dynamic acceleration factors and optional gradient coloration to enhance visual interpretation and utility for traders aiming to accurately capture trends and predict potential reversals.
Features:
- Dynamic Acceleration: Adjust the initial, incremental, and maximum values of the acceleration factor to suit various market conditions and trading preferences.
- Gradient Coloring: Use gradient colors to indicate the strength and stability of the trend, providing visual cues that are easy to interpret.
- Trend Visibility: The SAR dots are plotted directly on the price chart, making it easy to spot trend changes and maintain situational awareness.
- Overlay Feature: Designed to overlay directly on the price charts, allowing for seamless integration with other technical analysis tools.
Benefits:
- Trend Detection: Helps in identifying the beginning and potential reversal of trends, aiding in timely decision-making.
- Stop-Loss Management: Utilizes the positions of the SAR dots as dynamic stop-loss points, which helps in risk management.
- Visual Simplicity: Enhances the decision-making process through a straightforward visual representation of trend data.
Parameters:
- Acceleration Start (accel_start): The initial value for the acceleration, set to 0.02 by default.
- Acceleration Increment (accel_inc): The amount by which the acceleration increases, set to 0.005 by default.
- Acceleration Maximum (accel_max): The maximum limit of the acceleration factor, set to 0.1 by default.
- Use Gradient Colors (use_gradient): A boolean toggle to enable or disable gradient coloring, enabled by default.
Indicator Usage:
1. To apply, select this indicator from TradingView's indicator library.
2. Adjust the acceleration parameters based on your specific trading strategy and market analysis.
3. Interpret the indicator signals:
- Green SAR dots below the price bars indicate a bullish trend.
- Red SAR dots above the price bars signify a bearish trend.
- Gradient colors, if enabled, provide insights into the acceleration factor's intensity relative to trend strength.
Alerts:
- Bullish Reversal Alert: Issues a notification if there is a potential upward reversal when the trend shifts to bullish.
- Bearish Reversal Alert: Alerts when there's potential for a downward move as the trend turns bearish.
The "Parabolic SAR Waves " is a robust tool, ideal for traders who need precise, customizable trend-following capabilities that integrate seamlessly with other market analysis strategies. Enhance your trading with detailed trend insights and adaptive parameter controls.
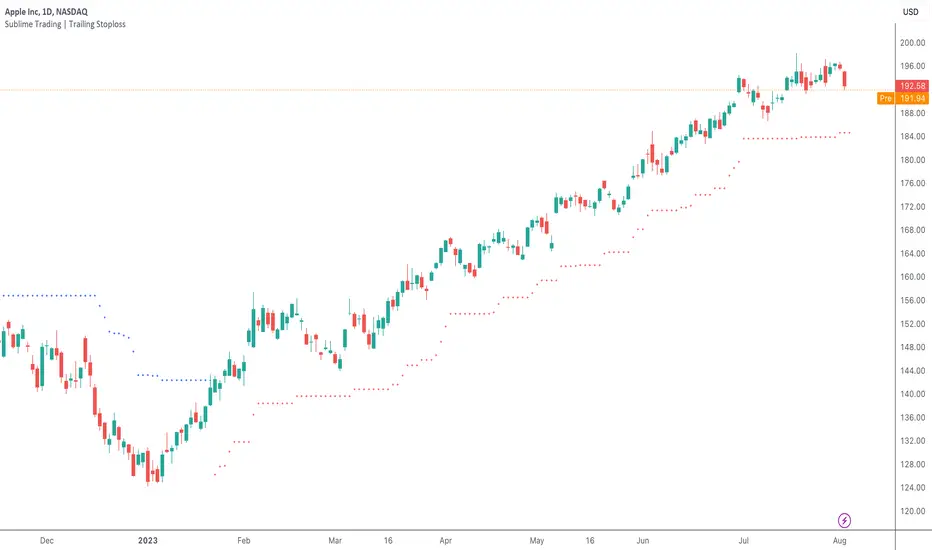
Sublime Trading | Trailing StoplossWhat kind of traders/investors are we?
We are trend followers. Our scripts are designed to be used on the higher timeframes (weekly/daily) to catch the large moves/trends in the market.
Most have heard of long-term trend following. Few know how to execute the strategy.
Our scripts are designed specifically to identify and invest in long-term market trends.
What does this script do?
The exit from a position is arguably more important than the entry.
Traders/Investors will regularly find themselves in an asset based on some logic, but the exit management is very much an afterthought.
Hence why traders often take profit too early and hold onto losing positions. It is emotionally driven.
The Trailing Stoploss script is designed to remove the guesswork and show you precise levels you will want to consider exiting a position when an asset reverses.
How is the trailing stoploss produced?
The script uses the formula ATR 15 x 4.
We use ATR as it produces a stoploss which is unique to the volatility of the asset. The more volatile the asset, the wider the stoploss.
We use ATR 15 as it brings an average reading across half a month, incorporating days of extreme volatility.
The multiplier 4 works well to avoid positions being stopped out prematurely on pullbacks.
When the trailing stoploss is hit, this is where you will want to consider taking profit.
What is the best timeframe to use the script?
We recommend the daily timeframe as this is where trend followers enter assets to maximise the potential of long-term trends.
The higher timeframes are where traders and investors take fewer positions and hold for longer time periods.
The trailing stoploss follows the price of the asset a distance away to give the trend structure enough space and time to develop.
A trend is ultimately a function of time. If you eliminate time, you eliminate the trend. If you eliminate the trend, you eliminate profit.
The Trailing Stoploss script is necessary for investors who appreciate that profit is accumulated by letting winning positions run and not taking profit too early.
What makes this script unique?
Exit management and knowing when to let go of an asset is one of the main struggles budding investors face. This script has been coded specifically for the daily timeframe to:
Create a trailing stoploss that is unique to the volatility of the asset.
Allow investors to stay in positions for the duration of the trend over many months.
To distinguish between a pullback and a market reversal, allowing for discretion.
This TSL script is designed to manage positions investors take in line with long-term market trends.
Spinn: SuperStopAdaptive Trailing Stop-Loss Indicator
This indicator will be beneficial for traders who have already opened a position and are looking to maximize their profits but are uncertain about the optimal time to exit. It provides clear and adaptive stop-loss levels based on market data, especially in highly volatile markets. It offers the ability to close trades automatically (through the use of web-hooks).
The algorithm is based on using the Average True Range (ATR) to set stop-loss levels. The scaling factor allows you to adjust the optimal distance from the stop-loss line to the price line.
A unique feature of this indicator is that the user can set the target timeframe (Target TF). This means that instead of just using the current chart's timeframe, you can set a multiplier or choose the target timeframe manually. This offers the ability to analyze volatility across different timeframes, which can be valuable for various trading strategies.
The timeframe multiplier is a highlight of this indicator. When switching the current timeframe, there is no need to manually change the target timeframe - this is very convenient.
The ability for automatic alerts when the price touches or crosses stop-loss levels is included.
--
Индикатор адаптивных плавающих Стоп-лоссов
Индикатор будет полезен для трейдеров, которые уже открыли сделку и хотят максимизировать свою прибыль, но не уверены в оптимальном моменте для выхода. Он предоставляет четкие и адаптивные уровни стоп-лоссов, основанные на рыночных данных, особенно при высокой волатильности. Дает возможность закрывать сделки в автоматическом режиме (через использование веб-хуков).
Алгоритм основан на использовании среднего истинного диапазона (ATR) для определения уровней стоп-лоссов. Коэффициент масштабирования дает возможность настроить оптимальное расстояние от линии стоп-лосса до линии цены.
Особенность индикатора в том, что пользователь может настроить целевой таймфрейм (Target TF). Это значит, что вместо того чтобы просто использовать текущий таймфрейм графика, можно установить множитель или выбрать целевой таймфрейм вручную. Это дает возможность анализировать волатильность на разных временных рамках, что может быть полезно для различных торговых стратегий.
Множитель таймфрейма - это фишка данного индикатора. При переключении текущего таймфрейма не придется вручную менять целевой таймфрейм - это очень удобно.
Предусмотрена возможность автоматических оповещений при касании или пересечении уровней стоп-лоссов.

[TTI] ATR Trailing Stop Alerts––––HISTORY & CREDITS 🏦
The Trailing Stop Alert is a TradingView indicator developed by TintinTrading, which is designed to help traders manage their positions by updating and alerting them about their trailing stop levels. This tool is a valuable addition to a trader's arsenal, as it automates the process of maintaining trailing stop levels and alerts the user when they are updated or hit.
––––WHAT IT DOES 💡
The Trailing Stop Alert indicator calculates trailing stop levels based on the Average True Range (ATR) of an asset over a specified lookback period. It takes user inputs for trail type (Long or Short), lookback period, ATR length, ATR multiplier, and bar time. The indicator can be applied to any financial instrument and will dynamically update the trailing stop level based on price action. When the trailing stop level is updated or hit, the indicator generates alerts to inform the user of these events.
––––HOW TO USE IT 🔧
1. Add the Trailing Stop Alert indicator to your TradingView chart.
2. Configure the settings according to your preferred parameters:
👉Trail Type: Choose between "Long" or "Short" based on your trading position.
👉Lookback: Set the number of bars to look back for determining the highest high or lowest low.
👉ATR Length: Set the period for calculating the Average True Range.
👉ATR Multiplier: Set the multiplier to adjust the trailing stop distance.
👉Bar Time: Set the time at which the indicator starts updating the trailing stop levels.
3. The indicator will plot the trailing stop level on the chart, and update it as the price action unfolds.
4. When the trailing stop level is updated or hit, you will receive an alert in the form of a message with the new level or a notification that the stop has been hit.
5. Adjust your stop loss orders accordingly based on the trailing stop levels provided by the indicator.
By using the Trailing Stop Alert indicator, you can effectively manage your positions and reduce the risk of giving back profits in a trade.

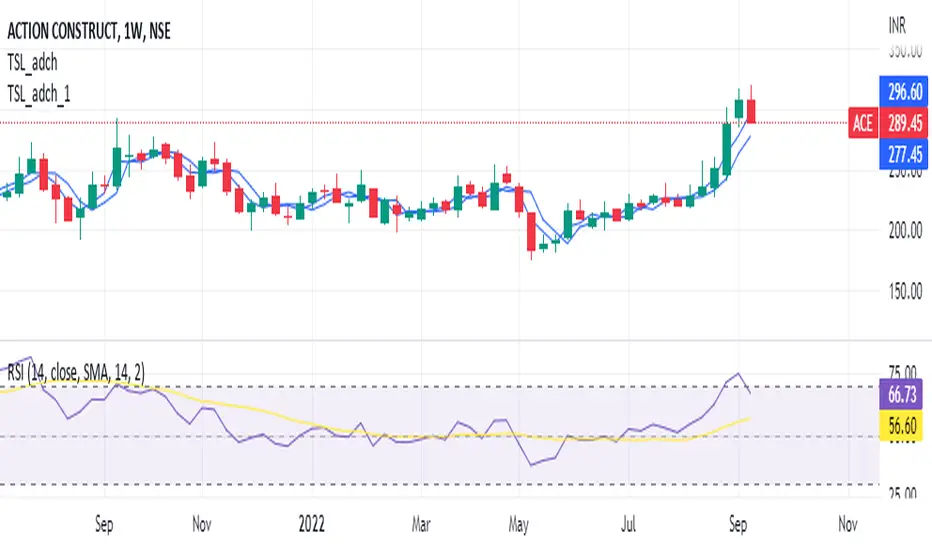
cankardesler stoploss v2This stoploss allows to filter high volatility fake trends;
But how we are made it; we are calculating the last spikes value average and calculating the standart deviation, after we added to the standart stoploss formula price+2atr and voila!!
Your stop loss is ready.
The idea behind this formula: what is explosing our stops? fake-out spikes.
We think if we get the last spikes average and calculate the standart deviation on it and after add it to the original stop formula, its gonna help for bypassing the spikes.
Thanks a lot @ocankardes for helping me to developing this formula

Interactive SAR Stop-Loss [TANHEF]This indicator is "Interactive" which means some inputs can are manually added through the first click after adding the indicator to the chart (SAR Trailing Stop-loss start point).
Unlike the normal Parabolic SAR, this indicator allows for the modification of the start point of the Parabolic SAR’s first bar calculation. Normally, the Parabolic SAR automatically has a start point after the first bar of an asset’s historical price that will then switch between trailing above and below price respectively. It must be noted that due to how the first position of the Parabolic SAR is calculated, on occasion the Parabolic SAR will immediately flip on the next bar to the opposite side relative to price that it was just located. Modifying the setting “⭐Initial Interactive SAR Position Source”, then selecting either 'Clicked' or 'ATR' level as the vertical start position will prevent this. See images below for more explanation.
Why use a trailing stop-loss?
A trailing stop-loss provides an exit when price moves against you but also enables you to move the exit point further into profit when price is moving in the desired direction of a trade. The Parabolic SAR ( stop and reverse ) which is used to determine price direction as well as when price direction is changing, is very effective at functioning as a trailing stop loss.
Indicator Explanation
Initially when this indicator is added to the chart, you will be prompted to select where to begin the SAR Trailing Stop-loss.
For a long stop-loss, select below price.
For a short stop-loss, select above price.
After this indicator is placed, it can be modified via dragging or from within the settings by modifying the time and the price input. Or simply re-add the indicator to the chart. Another option is to have this Parabolic SAR begin directly on the price that was initially ‘Clicked’ or the ‘ATR’ level, which requires selecting the option in settings labeled “⭐Initial Interactive SAR Position Source”
The SAR Stop Loss plotted. Note that the calculation that occurs on this first bar of the ‘Interactive SAR’ is as if the prior bar was the oldest historical bar of the asset. Due to the SAR’s calculations, if the ‘Normal SAR’ were to also flip sides over to the position that has been manually set for the ‘Interactive SAR’, they won’t necessarily have the same result.
An optional fixed profit target can be added within the settings. This profit target will only actively be plotted when the SAR Trailing Stop-loss has not be hit yet or until the profit target has been hit.
Here shows that the profit target was hit, then later on the SAR Trailing Stop-loss was hit.
Note, trailing stop-loss will continue to be plotted until it has been hit regardless of the profit target being hit or not.
Here is an example of when the Parabolic SAR will immediately flip on the next bar to the opposite side relative to price that it was just first located. This is due to how the Parabolic SAR is calculated and will also occur with the traditional Parabolic SAR that is not interactively (manually) given a start location. To prevent this, either relocate this time in which this SAR beings or consider modifying the SAR’s (start, increment, max) settings specifically.
Here instead of using the SAR’s calculation for an initial bar, the ‘ATR’ was selected as the start point within the setting “⭐Initial Interactive SAR Position Source”.
Alerts
1. 'Check' alerts to use within indicator settings (trailing stop hit and/or profit target hit).
2. Select 'Create Alert'
3. Set the condition to 'Interactive SAR''
4. Select create.

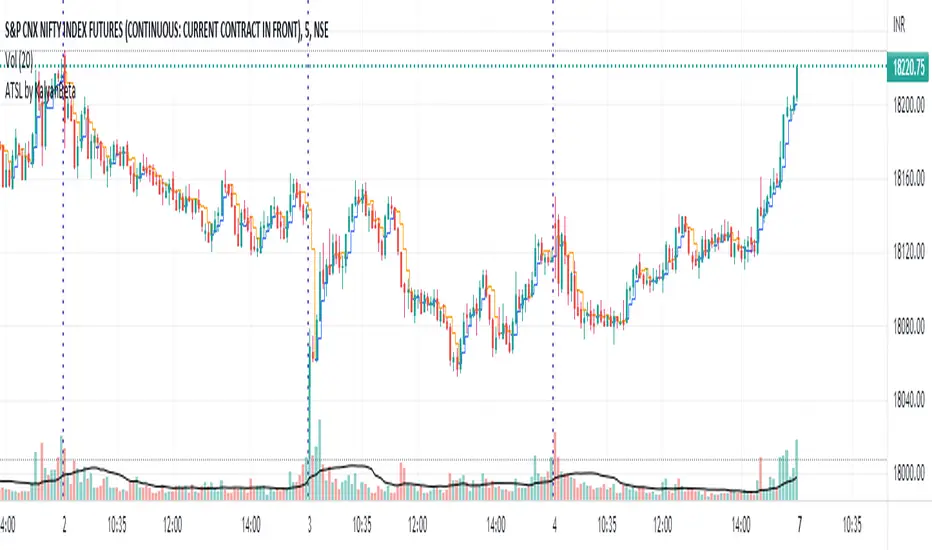
Anti-trap Trailing Stop Loss by KalyanBetaAnti-trap Trailing Stop Loss by KalyanBeta or ATSL
ATSL changes color when there it identifies price manipulation/ SL Hunting / Traps by Smart Money.
Change in color may be an exit signal for your trade in current direction.
This is a very simple indicator which can be used to predict Traps or Stop-loss hunting.
This can help in Trailing Stop-loss and in Exit decisions along with your own strategy.
ATSL may be used in all timeframes.
Please back-test it along with your strategy and then use it for Trailing the Stop-loss without getting trapped by operators and stop-loss hunters.
All the best.
Do post your feedback in comments below. Thank you.
Movable Stop + Trail + Alerthello everybody !
.....
this indicator helps you to get a better trading setting.
it's similar to the default draw tool from the trading view but the difference is you can add Trail stop and Alert .
.....
It also helps to free accounts to set more than 1 Alarm !!!
.....
Alert setting
just remember after you see set an alert if you change stop or entry, the alert will work with previous values/settings.
so you need to recreate an alert.
also don't change alert setting
.....
indicator setting
How is it works ?
...
settings
...
everything on :
you can see the information on the table
...
short sample :
everything on
...
simple short trade setting:
.....
my goal is to upgrade this indicator with your ideas.
not financial advice !
please , share your ideas with me to improve the indicator
I would like to see what you think about this indicator <3
also if you have any ideas to create an indicator or strategy you can make contact with me .
have a great day.

Liquidity Raid - Stop HuntLiquidity Raid - Stop Hunt
The market always seeks liquidity. Liquidity rests above previous highs and below previous lows as many traders see these as obvious points to place their stops. These are areas in the chart where many orders are placed together and serve as tipping points for market makers.
The script marks the breach of a market structure high/low with a vertical line. The script has the option to show the current W,D,4H & 1H market structure high and low.
How to use:
Once a raid occurs, use a higher timeframe to search for high probability supply and demand zones. Price needs to react to something. You may have multiple breaches before a reversal happens as price is likely looking for fresh(untested) zones. So don't trade blindly.
A good understanding of supply and demand concepts, odds enhancers, and how to identify fresh levels is expected to utilise it's full potential.
Lines and colours are all customizable
Alerts function included.
Indicator in use:

Trailing Stop AlertsThis script is designed as an ATR-based trailing stop tool to assist in managing open positions.
Once you're involved in a profitable trade, if you add this script to your chart you'll be prompted to select a bar to begin trailing from.
You can then adjust the candle lookback distance for swing high/lows (7 by default), the ATR multiplier (1.0 by default), and the direction to trail (Long/Short).
You can also adjust the ATR period in the settings menu if you want to (14 period by default).
Once the script is added to your chart, it will begin drawing your trailing stop and you can then set up alerts.
Alert Options:
Any alert() function call : Will trigger an alert for both conditions (trailing stop updated, trailing stop hit)
Alert Conditions : Trailing Stop Update will trigger whenever the stop is updated, Trailing Stop Hit will trigger whenever the stop is hit.
Note: the alerts will only fire once per bar close and the trailing stop will not update on realtime bars.
