Jurik-Filtered, Gann HiLo Activator [Loxx]Jurik-Filtered, Gann HiLo Activator is a Gann HiLo activator that has been smoothed using Jurik Filtering to reduce noise and better identify trending markets.
What is Gann HiLo
The HiLo Activator study is a trend-following indicator introduced by Robert Krausz as part of the Gann Swing trading strategy. In addition to indicating the current trend direction, this can be used as both entry signal and trailing stop.
Here is how the HiLo Activator is calculated:
1. The system calculates the moving averages of the high and low prices over the last several candles. By default, the average is calculated using the last three candles.
2. If the close price falls below the average low or rises above the average high, the system plots the opposite moving average. For example, if the price crosses above the average high, the system will plot the average low. If the price crosses below the average low afterward, the system will stop plotting the average low and will start plotting the average high, and so forth.
The plot of the HiLo Activator thus consists of sections on the top and bottom of the price plot. The sections on the bottom signify bullish trending conditions. Vice versa, those on the top signify the bearish conditions.
What is Jurik Volty used in the Juirk Filter?
One of the lesser known qualities of Juirk smoothing is that the Jurik smoothing process is adaptive. "Jurik Volty" (a sort of market volatility ) is what makes Jurik smoothing adaptive. The Jurik Volty calculation can be used as both a standalone indicator and to smooth other indicators that you wish to make adaptive.
What is the Jurik Moving Average?
Have you noticed how moving averages add some lag (delay) to your signals? ... especially when price gaps up or down in a big move, and you are waiting for your moving average to catch up? Wait no more! JMA eliminates this problem forever and gives you the best of both worlds: low lag and smooth lines.
Ideally, you would like a filtered signal to be both smooth and lag-free. Lag causes delays in your trades, and increasing lag in your indicators typically result in lower profits. In other words, late comers get what's left on the table after the feast has already begun.
Included
-Toggle bar color on/off
Stoploss

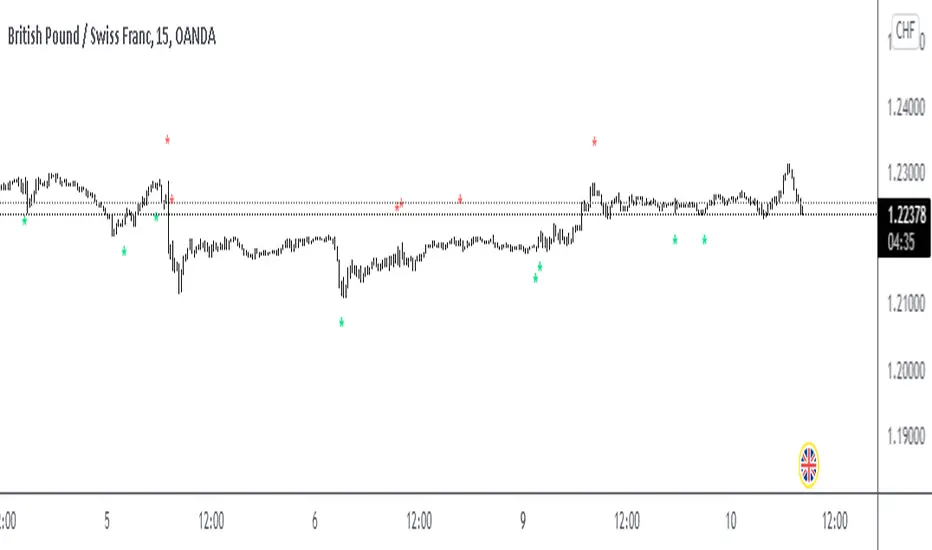
'last red low / last green high' exitThis is a good alternative to pivot points and ma lines to find long and short exit points (stop loss prices) for a trade.
When you hear traders say "set the stop loss to the recent swing", this indicator seems to do a reasonable job of finding those.
This script marks
the low of the most recent red candle
the high of the most recent green candle
in order to help identify a reasonable stop loss exit point for long and short trades.
You can also specify a distance threshold to the stop loss point.
How to use it.
Decide how far from the current price the exit should be (default 1.5%)
Use your chosen trading strategy to identify a long or short entry position
Add a long/short drawing to the close of the trade candle
Set the stop loos of your drawing to the exit line of this indicator
Set the take profit of your drawing using the desired risk to reward ratio
Note: A good rule is that if this indicator does not show a valid exit line, do not enter the trade.
Note: If the change of a new "last Green High" or the "last Red Low" is below 0.5%, the indicator will keep the previous values

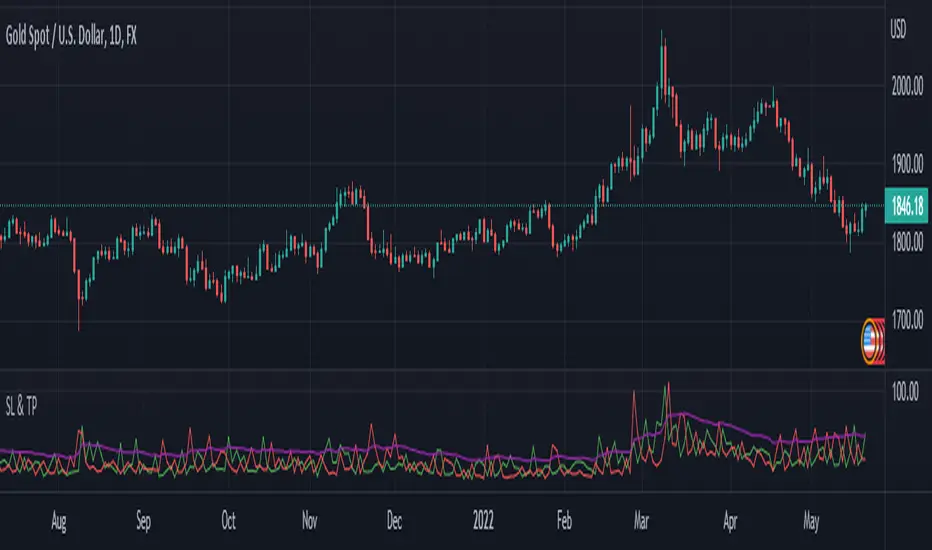
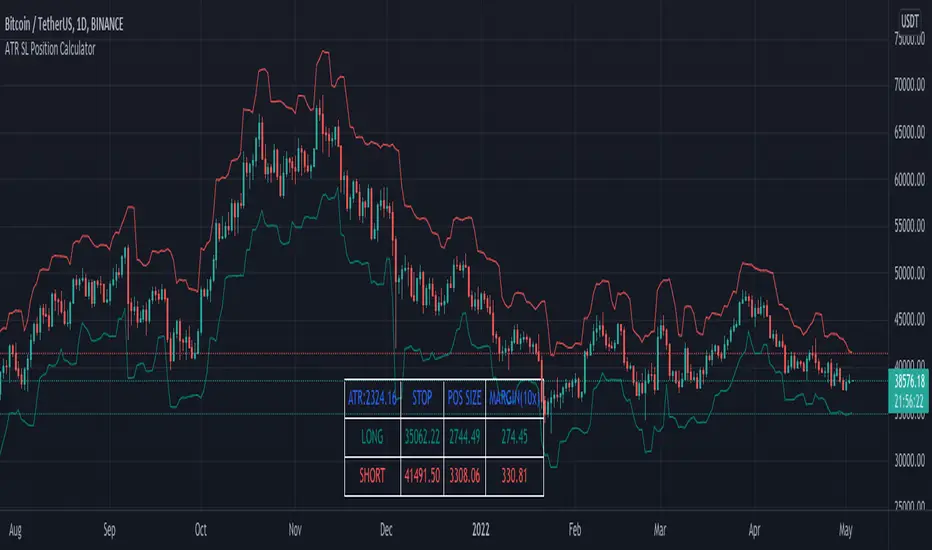
SL and TP - ATRThis indicator is using ATR ( Average True Range ) to set the Target point and Stop loss.
Use the pink number as target, always.
If you are in Long position, use the green number as stop loss, so the red number is not useful in Buys.
If you are in Short position, use the Red number as stop loss, so the green number is not useful in Sells.
** Need to enter the numbers in ticks --> VERY IMPORTANT: Write it completely, even the numbers after the point sign but DO NOT WRITE the point sign itself. e.g. : if the target tick on indicator is 123.75, you have to write 12375 ticks for your TP. ( one more example: If the number is 0.0001203 , write 1203 ticks. )
Enter the information of the opening candle.
Most of the times, risk/reward ratio is a bit higher than 1.
Works on multi timeframes. P.S: Haven't checked the weekly timeframe.
Not trying to oversell the indicator, but this is perhaps the best TP/SL specifier.
For beauty purposes, change (Sl @ buy) and (TP @ sell) to histograms.
Histograms are only for visual purposes. Customize the indicator as you want :)) Hope you enjoy
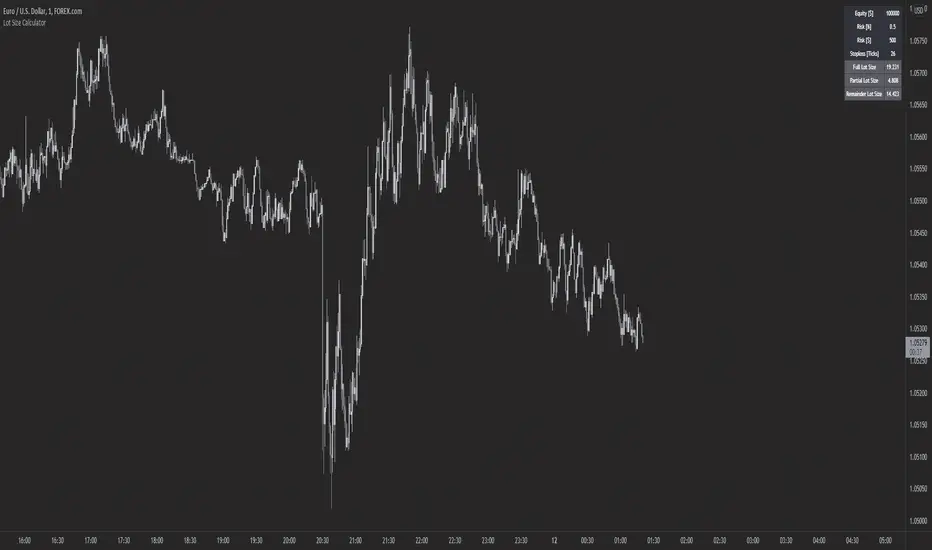
Forex Lot Size Calculator [AKCHOOO]Forex Lot Size Calculator based off stop loss (ticks), also shows the lot size needed for taking partials (based of % of trade to close partial position).
credits
inspired by @DewMic
adapted from @hanabil
UTG Trade Manager [V1]Position Sizing and Risk Management tool
See your trading plan directly on your chart . Enter >> Entry price, Take profit, Stoploss, capital, leverage, and see liquidation prices directly in association with entrys and stop losses

Stop Hunt MMMConcept to detect candle with body and tail ratio and filter by ATR.
Detect Stop hunt, normally use in TF15 min
Stop Loss With Average True Range (ATR)Stop Loss With Average True Range (ATR)
It simplifies the calculation of stop loss price for stop loss method using the average true range (ATR).
For example;
You want to stop loss below 3 ATR. Let's assume the price is 100, the average true range is 5. You will multiply the average true range by 3 and subtract from the price and enter a stop loss order at the 85 price you have reached. Instead of doing this calculation every time, you just need to use this script and set the multiplier to 3. A stop loss line will be drawn below the price candles.
You can set the method to be used when averaging the true range. Methods you can use to average: EMA (exponentially moving average), HMA (hull moving average), RMA (moving average used in RSI), SMA (simple moving average), SWMA (symmetrically weighted moving average), VWMA (volume-weighted moving average), WMA (weighted moving average).
You can set the length to be used when averaging the true range.
You can set the multiplier to be used when determining the stop loss price.
Turkish
Ortalama Gerçek Aralıkla (ATR) Zarar Durdurma
Gerçek aralığın ortalamasını kullanarak zarar durdurma yöntemi için zarar durdurma fiyatının hesaplanmasını kolaylaştırır.
Örneğin;
3 ATR kadar aşağıda zarar durdurmak istiyorsunuz. Fiyatın 100, ortalama gerçek aralığın 5 olduğunu varsayalım. Ortalama gerçek aralığı 3 ile çarparak fiyattan çıkaracaksınız ve ulaştığınız 85 fiyatına zarar durdurma emri gireceksiniz. Bu hesabı her seferinde yapmak yerine bu betiği kullanmanız ve çarpanı 3 olarak ayarlamanız yeterli. Bu sayede fiyat mumlarının altına zarar durdurma çizgisi çizilecektir.
Gerçek aralığın ortalaması alınırken kullanılacak yöntemi ayarlayabilirsiniz. Ortalama almak için seçebileceğiniz yöntemler: EMA (üstel hareketli ortalama), HMA (gövde hareketli ortalama), RMA (göreceli hareketli ortalama), SMA (basit hareketli ortalama), SWMA (simetrik ağırlıklı hareketli ortalama), VWMA (hacim ağırıklı hareketli ortalama), WMA (ağırlıklı hareketli ortalama).
Gerçek aralığın ortalaması alınırken kullanılacak periyot uzunluğunu ayarlayabilirsiniz.
Zarar durdurma fiyatını belirlerken kullanılacak çarpanı ayarlayabilirsiniz.

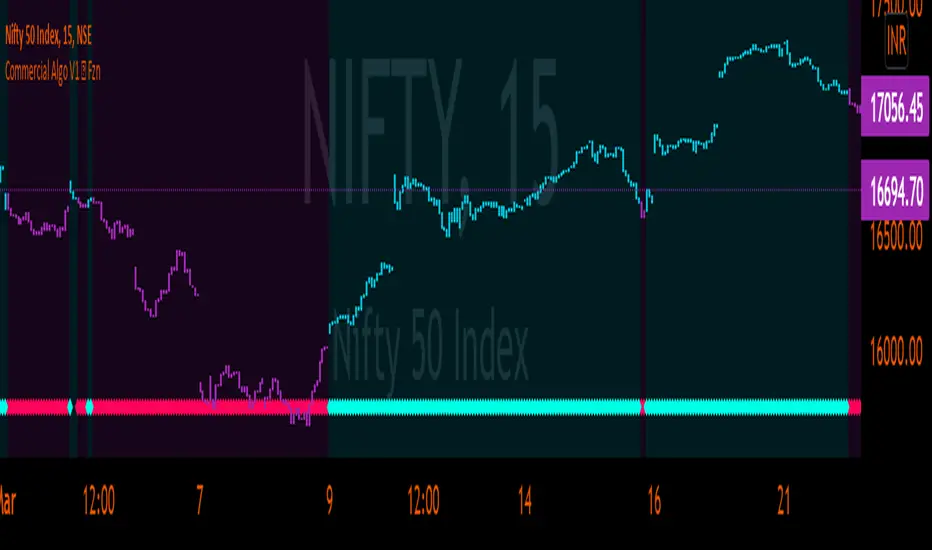
Commercial Algo Trend © Fzn V1Hello Traders,
Here i bring to you my 2nd Price Action Atr based Indictor combined with fib entry and exit trailing levels with minimum risk and maximum profit , as we must have seen at times as we enter the trend reverse and hits our stop losses . Keeping that in mind as i too struggled and made losses so i decided and focused more on minimizing the stop loss and only on confirmation of Long or Short trade is been initiated with proper Stop loss as explained in the images below , why should we give market our money ;) as we are here to make money :D .. There is no holy grail as Stop loss wont be hit but yes it will be way less and all alerts are based on candle close . One can use this on any chart and any timeframe and its very good for scalping too .ATR Trailing SL is added too just incase you want to enter and exit trend manually . Better results are on 15m and above . Hope you guys will like it and comment if you have any doubts..
-----------------
Disclaimer
Copyright by FaizanNawazz.
The information contained in my scripts/indicators/strategies/ideas does not constitute financial advice or a solicitation to buy or sell any securities of any type. I will not accept liability for any loss or damage, including without limitation any loss of profit, which may arise directly or indirectly from the use of or reliance on such information.
All investments involve risk, and the past performance of a security, industry, sector, market, financial product, trading strategy, or individual’s trading does not guarantee future results or returns. Investors are fully responsible for any investment decisions they make. Such decisions should be based solely on an evaluation of their financial circumstances, investment objectives, risk tolerance, and liquidity needs.
My scripts/indicators are only for educational purposes!
Happy Trading!
ATR SL + Position Size Calculator [DoctaBot]Props to @Veryfid for his original script 'ATR Stop Loss Finder'.
The concept is simple. We use the average true range to determine an appropriate stop loss distance based on recent volatility. The original script calculated the stop loss offset from the current candle's high or low. Here, I've added the option to offset stop loss from the recent local low or local high (a better way in my opinion).
I have also added a feature to automatically calculate position size by either dollar amount or as a percent of your account size to suit your risk profile (percent of account at risk per trade). This calculator supports use of leverage to calculate the amount of margin required to open desired position size.
ATR BandsIn many strategies, it's quite common to use a scaled ATR to help define a stop-loss, and it's not uncommon to use it for take-profit targets as well. While it's possible to use the built-in ATR indicator and manually calculate the offset value, we felt this wasn't particularly intuitive or efficient, and could lead to the potential for miscalculations. And while there are quite a few indicators that plot ATR bands in some form or another already on TV, we could not find one that actually performed the exact way that we wanted. They all had at least one of the following gaps:
The ATR offset was not configurable (usually hard-coded to be based off the high or low, while we generally prefer to use close)
It would only print a single band (either the upper or lower), which would require the same indicator to be added twice
The ATR scaling factor was either not configurable or only stepped in whole numbers (often time fractional factors like 1.5 yield better results)
To that end, we took to making this enhanced version to meet all of the above requirements. While we were doing so, we decided to take this opportunity to also make some non-functional enhancements as well:
Updated the indicator to the most recent version of Pine
Updated the indicator definition to allow alternate (non-chart) timeframe usage
Made the input types explicitly defined to improve consistency
Updated the inputs with appropriate minimum values and step sizes where appropriate
Separated settings into logical groups
Added helptext to the indicator settings noting usage and common settings values
Explicitly titled the on-chart plots of the ATR bands so that they can more easily be identified and referenced in other indicators/scripts, as well as the Data Window
Food for thought : When looking at some of the behaviors of these ATR bands, you can see that when price first levels out, you can draw a "consolidation zone" from the first peak of the upper ATR band to the first valley of the lower ATR band that price will generally respect. Look for price to break and close outside of that zone. When that happens, price will usually (but not always) make a notable move in that direction, which can be used as either a potential trigger or as an additional confluence with other indicators/price action.
Finally, while we have made what we feel are some noteworthy updates and enhancements to this indicator, and have every intention of continuing to do so as we find worthy opportunities for enhancement, credit is still due to the original author: AlexanderTeaH

StopLossThat indicator helps us to determine the stop loss levels or prices in terms of atr levels. It includes 4 (four) options which are 1-Don't Risk, 2-Low Risk, 3-High Risk, 4-Risk Lover their exploding rates are 1-2.4% , 2-3.9% , 3-6.7% , 4-16.7% in sort. It helps us to produce new methods to decreace our risk/reward ratio. It is ATR Trailing StopLoss indicator. The indicator is awesome in terms of comfortable. Thanks and waiting for your feedbacks.

ATR stoploss bands ATR止损通道线计算方式为开盘价,方便一开始就知道这根k线的止损位置。
用21和1.618作为参数,在btc上经常能看见刚好差一点打破到这个止损,不知是否是我的错觉。
使用方法:
出现信号后,将止损设置在当前k线止损点处,也可以用前一根的止损点,或前几根k线之内的最高价K线的ATR来止损。

ATR Take Profit / Stop Loss [JoseMetal]============
ENGLISH
============
- Description:
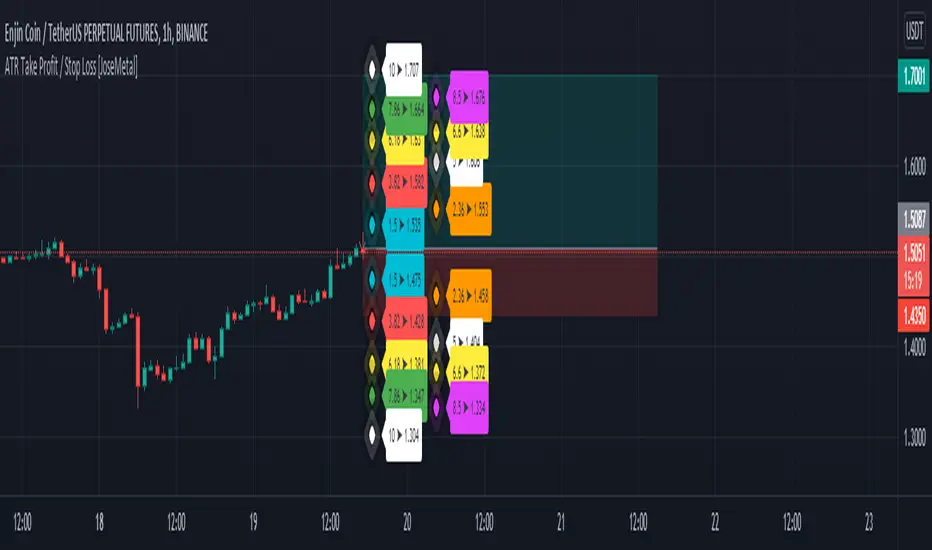
This indicator is based on ATR to print current ATR multiple values for Take Profits or Stop Loss levels, it's real time, so you can use the replay feature to test it or calculate these levels anytime on any candle.
Therefore, levels are calculated by multiplying the ATR by the level multiplier.
- Visual:
Both a "diamond" and label with the ATR multiplier and price value are printed for each level.
Each level has a color for both, diamond and label to make it easier to read.
The levels are split in 2 columns for better visualization.
- Usage and recommendations:
Fibonacci's levels are used for default, but you can customize them as you like.
I usually take 3.82 level (red by default) as stop loss, and I take profit every 2 levels depending on the timeframe, is good to let a small part run until break even or ATR 10 (last level).
- Customization:
Custom ATR period, 10 is default.
Each level has custom multiplier and level.
Customizable offset for diamonds and labels.
Custom precision for prices (because it greatly depends on the asset you're working with).
============
ESPAÑOL
============
- Descripción:
Este indicador se basa en el ATR para mostrar múltiples niveles de Take Profits o Stop Loss, es en tiempo real, por lo que se puede utilizar la función de repetición para probarlo o calcular estos niveles en cualquier momento y en cualquier vela.
Por lo tanto, los niveles se calculan multiplicando el ATR por el multiplicador del nivel.
- Visual:
Tanto un "diamante" como una etiqueta con el multiplicador ATR y el valor del precio se imprimen para cada nivel.
Cada nivel tiene un color tanto para el diamante como para la etiqueta para facilitar su lectura.
Los niveles están divididos en 2 columnas para una mejor visualización.
- Uso y recomendaciones:
Se usan los niveles de Fibonacci defecto, pero puedes personalizarlos como quieras.
Yo suelo usar el nivel 3.82 (rojo por defecto) como stop loss, y tomo beneficios cada 2 niveles dependiendo de la temporalidad, es bueno dejar correr una pequeña parte hasta el break even o ATR 10 (último nivel).
- Personalización:
Periodo ATR personalizable, 10 es el predeterminado.
Cada nivel tiene multiplicador y nivel personalizables.
Desplazamiento (offset) personalizable para los diamantes y las etiquetas.
Precisión para decimales personalizada (porque depende mucho del activo con el que se trabaje).
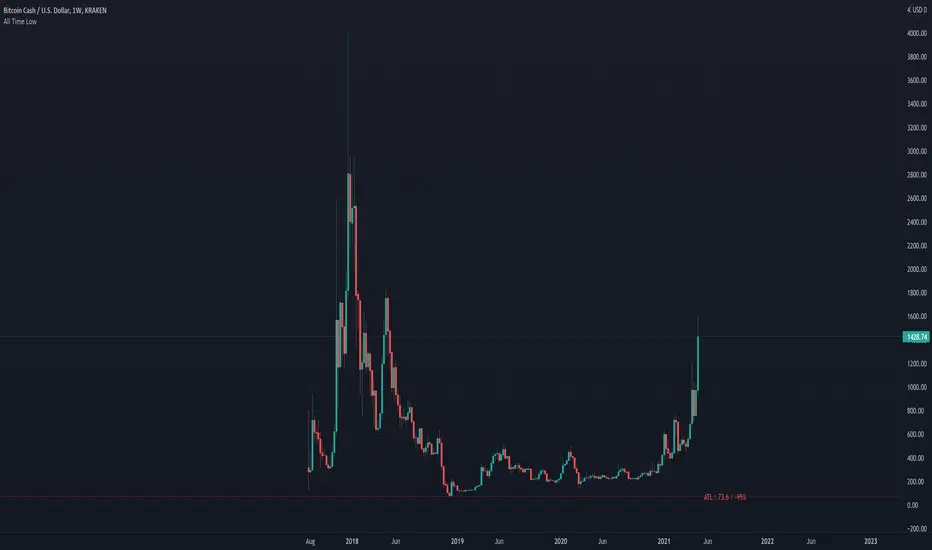
All Time LowThis script is to remind you of how much you would lose if the price went down to the all time low.
This will make you think twice about your purchases!
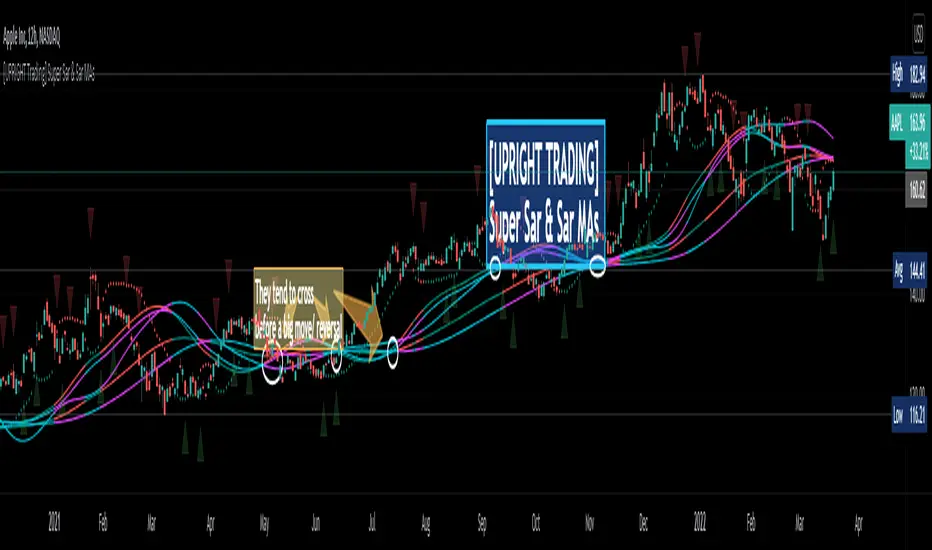
[UPRIGHT Trading] Super Sar & (New) Sar Moving Averages (cc)Hello Traders,
(This is an original creation and a proof of concept.)
As most of you know the PSAR, parabolic SAR indicator, was developed by J. Welles Wilder Jr. and used to determine trend direction and potential reversals in price. This technical indicator uses a trailing stop and reverse method, 'SAR,' or "stop and reverse," to find potential exit and entry points.
My question was: Is it possible to create meaningful Moving Averages by using PSAR?
Turns out, the answer is yes.
As you can see on the above chart, not only is it possible, it does work.
Features:
I've created buy/sell signals, which act as early indication of a potential reversal.
5 original MAs.
My Super Sar
Customizability: For now, the ability to adjust the length and turn on/off the MAs (maybe more features to come).
Enjoy!
As always, please: Like, Follow, Support, etc...
Cheers,
Mike
(UPRIGHT Trading)
[BA] ATR Stop LineThis indicator helps you to set your stoploss levels by using ATR. Traders often use atr values in order to calculate their stoploss levels.
This indicator does the calculation for you and draw two tiny lines without messing up the chart so that you can easily see your stoploss levels and get an idea about the volatility and risk amount as well.
One line is below the last candle as a long trade stop loss level and the other one is above the last candle as a short trade stop loss level.
Calculation is simple:
For short trades, 2 times ATR added to last price;
For long trades, 2 times ATR subtracted from last price.
You can change ATR length, ATR multiplier and the line length.
Good luck.

Position Size Calc. (Risk Management Tool)Programmed this tool to help prevent overtrading.
Example of application:
Suppose you want to trade ETHUSDT on a 1 minute chart and you are only willing to risk $10 in one single trade. This way, if you get stopped out, then you will only lose $10. Say you are using ATR based stop loss at 2x current ATR to set the initial stop. All these variables are now fixed, so you must make an adjustment to the size of your position.
Quick illustration: Tolerable loss per trade is $10 , the current ATR of ETHUSDT is $4.06, the size of your stop is $8.12 (4.06*2), then your position size should be 1.2 ETH ($10/$8.12).
This script will constantly monitor the current ATR and display the optimal position size on chart. Tolerable loss (aka "Risk amount") is defined by user in settings. Lines showing the size of SL and TPs on chart are optional, it was added to the script to help users draw the long/short position measuring tools built into TradingView.
Other notes: Always consider market liquidity, size of bid-ask spreads, and the possibilities of gap ups/downs. It can never be guaranteed that stop market/limit orders will get filled at desirable prices. Actual stop losses might differ.

Anna-LysaEspecially useful when using it for stocks in intraday screening for daytrading.
This gives you quick information about the volatility at the moment when you look at the stock.
The current range of the last candles (adjustable) is calculated so that you can stop based on the Vola.
In addition, the daily volume and daily range are calculated in the table and what is left of the average.
So that you can adjust your ideas for the movement in order to take profit. No matter what the timeframe, you can see how the volume compares to that of the previous few candles and thus anticipate the most likely breakout.
Then the most relevant day trading levels ( Premarkets, Lastday high/lows and some Ma´s ) are shown so that you can get a very fast overview of the stock at the moment.
All levels and labels and colors are adjustable or hidden in the settings.

MACD Cross [Momentum & Trend Filter]This is MTF MACD crossover and crossunder, with EMA trend filter and MTF RSI overbought/oversold filter.
Guidelines:
- User can set stop loss, take profit target and risk to reward ratio in setting
- ATR Stop and ATR Multiplier are use to set stop loss and take profit levels, setting are varies depend on what you are trading, play around and find appropriate number
- Don't trade if range between stop loss and target profit are too small or if there are too many small range try to increase multiplier
- If MACD Zero Line Filter enable, detect MACD crossover only under zero line for LONG, and detect MACD crossunder only above zero line for SHORT
- If EMA Trend Filter enable, detect MACD crossover which price above EMA for LONG, and detect MACD crossunder which price below EMA for SHORT
- RSI timeframe 1-3 should not lower than chart timeframe to display Overbought and Oversold correctly
- Enable MTF Overbought and Oversold just to display red background for Overbought, and green background for Oversold
There are 3 alert options:
(For those free user which can get only 1 alert, please choose "MACD crossover & crossunder" if you want to get alert for both long and short directions)
Have fun :)

SignalsThis script allows you to calculate position size, and future profit, loses.
- You can add 3 target values and 1 stop loss
- Optionally you can display table, position it as you like, and see risk ratio
Plans:
- add profit loss to the labels

Kzx PT mod v1.0 by RX-RAYKzx Position tracker mod v1.0 by RX-RAY
Original script by K-zax
The modification was made for the USDRUB ticker (the number of digits in the values of price, interest, lot volume and profit loss for other tickers may affect the positioning of the inscription, but it is fully operative and it may be used with other tickers )
Typical label view:
74.30 - ENTRY PRICE
+/-0.16% - % of price chang ( range +/-9.99)
20 - position value (range 0-99)
(S) - position type (L) - long (S) - short
+/-0017 - actual profit/loss in cash (range +/- 9999)
(All range value for correct label position,
but script mod can be used out off range)
List of additions and changes:
1. Added display of position value, short / long position type and profit / loss value (including broker commission).
2. Positive interest change now corresponds to profit, negative change in interest to loss in accordance with the type of position ( short/long )
3. The position of the inscription and the digits of the values are fixed and now insignificantly depends on the change in the time interval and the change in the scale of the graph and the change in data values and their signs.
4. Added changing the color of the inscription in the situation positive price change, but profit < commission fee. (critical gain).

Heikin Ashi Trailing Stoploss ActivationThe Basics
This indicator should be used on regular candle sticks. It is possible to trigger an alert, when the block flips from red to green bar. Or vice versa.
Red block represents a red Heikin Ashi candle.
Green block for green Heikin Ashi candle.
It can be used as a trailing stoploss for (DCA/ TV) bots, when riding trends.
What Makes It Different
The user can preset the price (of the asset e.g. BTC), where it will start looking for Heikin Ashi flips. Every Heikin Ashi flip before this preset price will be ignored. Preset prices could be chosen tactically at resistance levels.
Different time frames of Heikin Ashi flips can be used together. E.g. 10 min, 3 hour or 2 Day time frames. If this is possible within your Tradingview subscription.
Example
The user has a long position (bought at the green arrow.) The user wants to start trailing at price 88 USDT (blue line).
The indicator will only trigger when the following conditions are met:
Cross of red block on the indicator (representing red Heikin Ashi candle)
Price has crossed 88 USDT
If the candlestick turns from a green to a red block, before crossing 88 USDT. It will NOT trigger the alert. Visible as the orange down arrows. In the indicator below it is displayed as a red block.The alert will go off at the red down arrow on 10th Nov (if chosen for Once per bar close). The price condition of 88 USDT was already met at 7th Nov.
Final Words
Disclaimer: Please use it with care and at own risk. The owner of this indicator is not liable for any financial losses.
Past performance is no guarantee of future returns.

Trailing Stop AlertsThis script is designed as an ATR-based trailing stop tool to assist in managing open positions.
Once you're involved in a profitable trade, if you add this script to your chart you'll be prompted to select a bar to begin trailing from.
You can then adjust the candle lookback distance for swing high/lows (7 by default), the ATR multiplier (1.0 by default), and the direction to trail (Long/Short).
You can also adjust the ATR period in the settings menu if you want to (14 period by default).
Once the script is added to your chart, it will begin drawing your trailing stop and you can then set up alerts.
Alert Options:
Any alert() function call : Will trigger an alert for both conditions (trailing stop updated, trailing stop hit)
Alert Conditions : Trailing Stop Update will trigger whenever the stop is updated, Trailing Stop Hit will trigger whenever the stop is hit.
Note: the alerts will only fire once per bar close and the trailing stop will not update on realtime bars.
