NSDT HAMA Candles STRATThis is a STRATEGY based on our popular HAMA Candles Indicator.
It is an "Always On" strategy, meaning it will stay in a Long position until the Short criteria shows up, and then it will close the Long position and immediately enter a Short position.
Since this is a strategy, we added a few more components. The most notable one is the grid at the top right that shows the statistics of whatever the current settings are. The user can change the MA lengths and see the potential results update in real time.
Since this is Always On and uses Moving Averages, we added an ADX setting to help filter our trades in a ranging/choppy market.
The settings will need to be adjusted to find the best fit for your instrument, chart time, and risk management plan.
Strategy!

action zone - ATR stop reverse order strategy v0.1 by 9nckACTION ZONE-ATR MOD v0.1 DOCUMENTATION
Overview
This tradingview pine script strategy is mainly created to enrich my coding skill. It is a combination of “CDC-ACTIONZONE” and my personal studies of trading techniques in various sources e.g.book, course or blog. This strategy purposefully built to connect with my automatic trading bot. However, It will be very useful to aid your trading routine by diminishing mental distraction which possibly leads to bad trades.
How does it work?
This strategy will do a basic simple thing that most traders do by creating entry signals on both sides long/short and also set the stop loss. Furthermore, It will also reverse the order (from long to short and vice versa (if long/short conditions are met). Finally, it will recalculate the stop loss/take profit price in every complete bar to increase the chance of winning and limit our loss.
Entry rules(Long/Short)
If you have no open order, an order will be created when a fast EMA crosses(up(long)/down(short) the slow EMA(It’s as simple as that).
If you have an open order, the current order will be (sold if long, covered if short) and the opposite side order will be created.
Exit and Reverse rules(Long/Short)
If fast EMA cross (DOWN(long), UP(short)), the current order will be closed, THE OPPOSITE SIDE ORDER WILL ALSO BE CREATED.
Risk management
FLEX STOP PRICE : initial value will be set at the bar which order created. It is a fast ema (+/-) MIDDLE ATR value.
If MIDDLE ATR value rises, it will be our new stop price.
If MIDDLE ATR value falls, stop price unchanged
If Price OVERBOUGHT(long)/SOLD(short), LOW of that bar will be a new stop price.
Minimum position hold period
In order to eliminate risk of repeatedly open, close orders in sideway trends. Minimum hold period must be passed to start exit our position. However, It always respects stop loss prices. The value refers to the number of bars.
MUST READ!!!
This strategy uses only MARKET ORDER. If you trade with a bot, make sure you choose only enormous market cap tokens.
This strategy is bi-direction strategy. It will work best in the DERIVATIVE market.
It was initially designed to compete in the cryptocurrency market which has very high volume and volatility.
I only use this strategy in 1HR (acceptable change rate, optimum trade frequency)
How (should) we use it?
Choose crypto future pairs (recommend only top 10-15 market volume pairs in Binance, let’s say 1000M+ trade value)
Choose your time frame (1H is strongly recommended)
Setup your portfolio profile (Setting->Properties) such as Initial cap, order size, commission. DO NOT USE CAL ON EVERY TICK IT WILL CAUSE REPAINTING AND YOUR CAPITAL IS BLEEDING !!!
BACKTEST FIRST!! Back test is a combination of art, math and statis(and a bit of luck). You can apply to train and test methods or whatever you are familiar with. In my opinion, your test period should include UPTREND, SIDEWAY, DOWNTREND. Fine tune fast, slow ema first(my best ema length of 1H timeframe around 7-10, 17-22). Try to eliminate fault breakout trade and use other options only necessary. Hopefully we can use automatic optimization on Pine Script soon.
Don’t forget to turn off using a specific backtest date option to start your strategy.A
THIS IS NOT A PERFECT (OR EVEN PROFITABLE) STRATEGY. USE AT YOUR OWN RISK AND TRADE RESPONSIBLY. DYOR DUDE.

WhaleCrew VisionVision is an advanced momentum oscillator that visualizes momentum strength with overbought and oversold readings.
Features
Momentum Waves
Divergence Detection (regular and hidden divergences)
Detection for momentum shifts (detects higher lows/lower highs on the oscillator)
Detection for momentum stagnation
Moneyflow
Most important: Our Custom Strategy Builder
Custom Strategy Builder
The custom strategy builder is a framework that allows you to easily create custom strategies.
1. Configure long/short conditions
Pre-defined conditions for custom timeframes, under which you're looking to potentially enter a trade.
2. Configure trigger
Select a trigger (e.g. "Wave Cross" or "Wave Lower High") to generate labels/alerts for potential entries, whenever long/short conditions are met.
3. Configure Take Profit Conditions
Potential Take Profits are triggered by momentum stagnation.
4. Backtest your strategy
By using our open-source backtester script (published on our profile).
5. Trade responsibly
Manually review each signal/alert before taking any actions.
Note: The "Strategy Backtest" input section can also help you develop your strategy.
Usage
You can use this indicator to follow the trend, detect momentum shifts or memorize patterns.
Take a systematic approach by using our strategy builder.
Access to this indicator can be obtained through our website.

TEMA/HMA/VWMACD - Short Strategy 4HAs we can discover by studying the history of BTCUSD, the fall is always swift. Confirmation of this - today's collapse. In this strategy, an attempt is made to catch such drop by using quick entry and quick exit.
Let's describe what this strategy consists of:
• TEMA (you can find this strategy separately on this page or on platform)
• VWMACD
• HMA
• Take-profit and Stop-losses
Logic:
Firstly we VWMACD (the difference between VWMACD and simple MACD is only in the way of calculating moving average) and plot it as a histogram.
Then HMA is adding as a trend filter. For easy understanding let's plot it now on chart separately.
Next step is to create and add TEMA. After it is needed to subtract slow TEMA from fast TEMA and plot this value around 0 on histogram. This is the main decision for the implementation of the short trade.
ENTRY the trade:
When VMACD is below 0 and price (src = close) is below the HMA and TEMA below 0.
CLOSE the trade:
When VWMACD is upper than 0 or price is upper than HMA or TEMA is upper than 0
You can find more strategies on tradingammo.pro.

BjCandlePatternsLibrary "BjCandlePatterns"
Patterns is a Japanese candlestick pattern recognition Library for developers. Functions here within detect viable setups in a variety of popular patterns. Please note some patterns are without filters such as comparisons to average candle sizing, or trend detection to allow the author more freedom.
doji(dojiSize, dojiWickSize) Detects "Doji" candle patterns
Parameters:
dojiSize : (float) The relationship of body to candle size (ie. body is 5% of total candle size). Default is 5.0 (5%)
dojiWickSize : (float) Maximum wick size comparative to the opposite wick. (eg. 2 = bottom wick must be less than or equal to 2x the top wick). Default is 2
Returns: (series bool) True when pattern detected
dLab(showLabel, labelColor, textColor) Produces "Doji" identifier label
Parameters:
showLabel : (bool) Shows label when input is true. Default is false
labelColor : (series color) Color of the label border and arrow
textColor : (series color) Text color
Returns: (series label) A label visible at the chart level intended for the title pattern
bullEngulf(maxRejectWick, mustEngulfWick) Detects "Bullish Engulfing" candle patterns
Parameters:
maxRejectWick : (float) Maximum rejection wick size.
The maximum wick size as a percentge of body size allowable for a top wick on the resolution candle of the pattern. 0.0 disables the filter.
eg. 50 allows a top wick half the size of the body. Default is 0% (Disables wick detection).
mustEngulfWick : (bool) input to only detect setups that close above the high prior effectively engulfing the candle in its entirety. Default is false
Returns: (series bool) True when pattern detected
bewLab(showLabel, labelColor, textColor) Produces "Bullish Engulfing" identifier label
Parameters:
showLabel : (bool) Shows label when input is true. Default is false
labelColor : (series color) Color of the label border and arrow
textColor : (series color) Text color
Returns: (series label) A label visible at the chart level intended for the title pattern
bearEngulf(maxRejectWick, mustEngulfWick) Detects "Bearish Engulfing" candle patterns
Parameters:
maxRejectWick : (float) Maximum rejection wick size.
The maximum wick size as a percentge of body size allowable for a bottom wick on the resolution candle of the pattern. 0.0 disables the filter.
eg. 50 allows a botom wick half the size of the body. Default is 0% (Disables wick detection).
mustEngulfWick : (bool) Input to only detect setups that close below the low prior effectively engulfing the candle in its entirety. Default is false
Returns: (series bool) True when pattern detected
bebLab(showLabel, labelColor, textColor) Produces "Bearish Engulfing" identifier label
Parameters:
showLabel : (bool) Shows label when input is true. Default is false
labelColor : (series color) Color of the label border and arrow
textColor : (series color) Text color
Returns: (series label) A label visible at the chart level intended for the title pattern
hammer(ratio, shadowPercent) Detects "Hammer" candle patterns
Parameters:
ratio : (float) The relationship of body to candle size (ie. body is 33% of total candle size). Default is 33%.
shadowPercent : (float) The maximum allowable top wick size as a percentage of body size. Default is 5%.
Returns: (series bool) True when pattern detected
hLab(showLabel, labelColor, textColor) Produces "Hammer" identifier label
Parameters:
showLabel : (bool) Shows label when input is true. Default is false
labelColor : (series color) Color of the label border and arrow
textColor : (series color) Text color
Returns: (series label) A label visible at the chart level intended for the title pattern
star(ratio, shadowPercent) Detects "Star" candle patterns
Parameters:
ratio : (float) The relationship of body to candle size (ie. body is 33% of total candle size). Default is 33%.
shadowPercent : (float) The maximum allowable bottom wick size as a percentage of body size. Default is 5%.
Returns: (series bool) True when pattern detected
ssLab(showLabel, labelColor, textColor) Produces "Star" identifier label
Parameters:
showLabel : (bool) Shows label when input is true. Default is false
labelColor : (series color) Color of the label border and arrow
textColor : (series color) Text color
Returns: (series label) A label visible at the chart level intended for the title pattern
dragonflyDoji() Detects "Dragonfly Doji" candle patterns
Returns: (series bool) True when pattern detected
ddLab(showLabel, labelColor) Produces "Dragonfly Doji" identifier label
Parameters:
showLabel : (bool) Shows label when input is true. Default is false
labelColor : (series color) Color of the label border and arrow
Returns: (series label) A label visible at the chart level intended for the title pattern
gravestoneDoji() Detects "Gravestone Doji" candle patterns
Returns: (series bool) True when pattern detected
gdLab(showLabel, labelColor, textColor) Produces "Gravestone Doji" identifier label
Parameters:
showLabel : (bool) Shows label when input is true. Default is false
labelColor : (series color) Color of the label border and arrow
textColor : (series color) Text color
Returns: (series label) A label visible at the chart level intended for the title pattern
tweezerBottom(closeUpperHalf) Detects "Tweezer Bottom" candle patterns
Parameters:
closeUpperHalf : (bool) input to only detect setups that close above the mid-point of the candle prior increasing its bullish tendancy. Default is false
Returns: (series bool) True when pattern detected
tbLab(showLabel, labelColor, textColor) Produces "Tweezer Bottom" identifier label
Parameters:
showLabel : (bool) Shows label when input is true. Default is false
labelColor : (series color) Color of the label border and arrow
textColor : (series color) Text color
Returns: (series label) A label visible at the chart level intended for the title pattern
tweezerTop(closeLowerHalf) Detects "TweezerTop" candle patterns
Parameters:
closeLowerHalf : (bool) input to only detect setups that close below the mid-point of the candle prior increasing its bearish tendancy. Default is false
Returns: (series bool) True when pattern detected
ttLab(showLabel, labelColor, textColor) Produces "TweezerTop" identifier label
Parameters:
showLabel : (bool) Shows label when input is true. Default is false
labelColor : (series color) Color of the label border and arrow
textColor : (series color) Text color
Returns: (series label) A label visible at the chart level intended for the title pattern
spinningTopBull(wickSize) Detects "Bullish Spinning Top" candle patterns
Parameters:
wickSize : (float) input to adjust detection of the size of the top wick/ bottom wick as a percent of total candle size. Default is 34%, which ensures the wicks are both larger than the body.
Returns: (series bool) True when pattern detected
stwLab(showLabel, labelColor, textColor) Produces "Bullish Spinning Top" identifier label
Parameters:
showLabel : (bool) Shows label when input is true. Default is false
labelColor : (series color) Color of the label border and arrow
textColor : (series color) Text color
Returns: (series label) A label visible at the chart level intended for the title pattern
spinningTopBear(wickSize) Detects "Bearish Spinning Top" candle patterns
Parameters:
wickSize : (float) input to adjust detection of the size of the top wick/ bottom wick as a percent of total candle size. Default is 34%, which ensures the wicks are both larger than the body.
Returns: (series bool) True when pattern detected
stbLab(showLabel, labelColor, textColor) Produces "Bearish Spinning Top" identifier label
Parameters:
showLabel : (bool) Shows label when input is true. Default is false
labelColor : (series color) Color of the label border and arrow
textColor : (series color) Text color
Returns: (series label) A label visible at the chart level intended for the title pattern
spinningTop(wickSize) Detects "Spinning Top" candle patterns
Parameters:
wickSize : (float) input to adjust detection of the size of the top wick/ bottom wick as a percent of total candle size. Default is 34%, which ensures the wicks are both larger than the body.
Returns: (series bool) True when pattern detected
stLab(showLabel, labelColor, textColor) Produces "Spinning Top" identifier label
Parameters:
showLabel : (bool) Shows label when input is true. Default is false
labelColor : (series color) Color of the label border and arrow
textColor : (series color) Text color
Returns: (series label) A label visible at the chart level intended for the title pattern
morningStar() Detects "Bullish Morning Star" candle patterns
Returns: (series bool) True when pattern detected
msLab(showLabel, labelColor, textColor) Produces "Bullish Morning Star" identifier label
Parameters:
showLabel : (bool) Shows label when input is true. Default is false
labelColor : (series color) Color of the label border and arrow
textColor : (series color) Text color
Returns: (series label) A label visible at the chart level intended for the title pattern
eveningStar() Detects "Bearish Evening Star" candle patterns
Returns: (series bool) True when pattern detected
esLab(showLabel, labelColor, textColor) Produces "Bearish Evening Star" identifier label
Parameters:
showLabel : (bool) Shows label when input is true. Default is false
labelColor : (series color) Color of the label border and arrow
textColor : (series color) Text color
Returns: (series label) A label visible at the chart level intended for the title pattern
haramiBull() Detects "Bullish Harami" candle patterns
Returns: (series bool) True when pattern detected
hwLab(showLabel, labelColor, textColor) Produces "Bullish Harami" identifier label
Parameters:
showLabel : (bool) Shows label when input is true. Default is false
labelColor : (series color) Color of the label border and arrow
textColor : (series color) Text color
Returns: (series label) A label visible at the chart level intended for the title pattern
haramiBear() Detects "Bearish Harami" candle patterns
Returns: (series bool) True when pattern detected
hbLab(showLabel, labelColor, textColor) Produces "Bearish Harami" identifier label
Parameters:
showLabel : (bool) Shows label when input is true. Default is false
labelColor : (series color) Color of the label border and arrow
textColor : (series color) Text color
Returns: (series label) A label visible at the chart level intended for the title pattern
haramiBullCross() Detects "Bullish Harami Cross" candle patterns
Returns: (series bool) True when pattern detected
hcwLab(showLabel, labelColor, textColor) Produces "Bullish Harami Cross" identifier label
Parameters:
showLabel : (bool) Shows label when input is true. Default is false
labelColor : (series color) Color of the label border and arrow
textColor : (series color) Text color
Returns: (series label) A label visible at the chart level intended for the title pattern
haramiBearCross() Detects "Bearish Harami Cross" candle patterns
Returns: (series bool) True when pattern detected
hcbLab(showLabel, labelColor) Produces "Bearish Harami Cross" identifier label
Parameters:
showLabel : (bool) Shows label when input is true. Default is false
labelColor : (series color) Color of the label border and arrow
Returns: (series label) A label visible at the chart level intended for the title pattern
marubullzu() Detects "Bullish Marubozu" candle patterns
Returns: (series bool) True when pattern detected
mwLab(showLabel, labelColor, textColor) Produces "Bullish Marubozu" identifier label
Parameters:
showLabel : (bool) Shows label when input is true. Default is false
labelColor : (series color) Color of the label border and arrow
textColor : (series color) Text color
Returns: (series label) A label visible at the chart level intended for the title pattern
marubearzu() Detects "Bearish Marubozu" candle patterns
Returns: (series bool) True when pattern detected
mbLab(showLabel, labelColor, textColor) Produces "Bearish Marubozu" identifier label
Parameters:
showLabel : (bool) Shows label when input is true. Default is false
labelColor : (series color) Color of the label border and arrow
textColor : (series color) Text color
Returns: (series label) A label visible at the chart level intended for the title pattern
abandonedBull() Detects "Bullish Abandoned Baby" candle patterns
Returns: (series bool) True when pattern detected
abwLab(showLabel, labelColor, textColor) Produces "Bullish Abandoned Baby" identifier label
Parameters:
showLabel : (bool) Shows label when input is true. Default is false
labelColor : (series color) Color of the label border and arrow
textColor : (series color) Text color
Returns: (series label) A label visible at the chart level intended for the title pattern
abandonedBear() Detects "Bearish Abandoned Baby" candle patterns
Returns: (series bool) True when pattern detected
abbLab(showLabel, labelColor, textColor) Produces "Bearish Abandoned Baby" identifier label
Parameters:
showLabel : (bool) Shows label when input is true. Default is false
labelColor : (series color) Color of the label border and arrow
textColor : (series color) Text color
Returns: (series label) A label visible at the chart level intended for the title pattern
piercing() Detects "Piercing" candle patterns
Returns: (series bool) True when pattern detected
pLab(showLabel, labelColor, textColor) Produces "Piercing" identifier label
Parameters:
showLabel : (bool) Shows label when input is true. Default is false
labelColor : (series color) Color of the label border and arrow
textColor : (series color) Text color
Returns: (series label) A label visible at the chart level intended for the title pattern
darkCloudCover() Detects "Dark Cloud Cover" candle patterns
Returns: (series bool) True when pattern detected
dccLab(showLabel, labelColor, textColor) Produces "Dark Cloud Cover" identifier label
Parameters:
showLabel : (bool) Shows label when input is true. Default is false
labelColor : (series color) Color of the label border and arrow
textColor : (series color) Text color
Returns: (series label) A label visible at the chart level intended for the title pattern
tasukiBull() Detects "Upside Tasuki Gap" candle patterns
Returns: (series bool) True when pattern detected
utgLab(showLabel, labelColor, textColor) Produces "Upside Tasuki Gap" identifier label
Parameters:
showLabel : (bool) Shows label when input is true. Default is false
labelColor : (series color) Color of the label border and arrow
textColor : (series color) Text color
Returns: (series label) A label visible at the chart level intended for the title pattern
tasukiBear() Detects "Downside Tasuki Gap" candle patterns
Returns: (series bool) True when pattern detected
dtgLab(showLabel, labelColor, textColor) Produces "Downside Tasuki Gap" identifier label
Parameters:
showLabel : (bool) Shows label when input is true. Default is false
labelColor : (series color) Color of the label border and arrow
textColor : (series color) Text color
Returns: (series label) A label visible at the chart level intended for the title pattern
risingThree() Detects "Rising Three Methods" candle patterns
Returns: (series bool) True when pattern detected
rtmLab(showLabel, labelColor, textColor) Produces "Rising Three Methods" identifier label
Parameters:
showLabel : (bool) Shows label when input is true. Default is false
labelColor : (series color) Color of the label border and arrow
textColor : (series color) Text color
Returns: (series label) A label visible at the chart level intended for the title pattern
fallingThree() Detects "Falling Three Methods" candle patterns
Returns: (series bool) True when pattern detected
ftmLab(showLabel, labelColor, textColor) Produces "Falling Three Methods" identifier label
Parameters:
showLabel : (bool) Shows label when input is true. Default is false
labelColor : (series color) Color of the label border and arrow
textColor : (series color) Text color
Returns: (series label) A label visible at the chart level intended for the title pattern
risingWindow() Detects "Rising Window" candle patterns
Returns: (series bool) True when pattern detected
rwLab(showLabel, labelColor, textColor) Produces "Rising Window" identifier label
Parameters:
showLabel : (bool) Shows label when input is true. Default is false
labelColor : (series color) Color of the label border and arrow
textColor : (series color) Text color
Returns: (series label) A label visible at the chart level intended for the title pattern
fallingWindow() Detects "Falling Window" candle patterns
Returns: (series bool) True when pattern detected
fwLab(showLabel, labelColor, textColor) Produces "Falling Window" identifier label
Parameters:
showLabel : (bool) Shows label when input is true. Default is false
labelColor : (series color) Color of the label border and arrow
textColor : (series color) Text color
Returns: (series label) A label visible at the chart level intended for the title pattern
kickingBull() Detects "Bullish Kicking" candle patterns
Returns: (series bool) True when pattern detected
kwLab(showLabel, labelColor, textColor) Produces "Bullish Kicking" identifier label
Parameters:
showLabel : (bool) Shows label when input is true. Default is false
labelColor : (series color) Color of the label border and arrow
textColor : (series color) Text color
Returns: (series label) A label visible at the chart level intended for the title pattern
kickingBear() Detects "Bearish Kicking" candle patterns
Returns: (series bool) True when pattern detected
kbLab(showLabel, labelColor, textColor) Produces "Bearish Kicking" identifier label
Parameters:
showLabel : (bool) Shows label when input is true. Default is false
labelColor : (series color) Color of the label border and arrow
textColor : (series color) Text color
Returns: (series label) A label visible at the chart level intended for the title pattern
lls(ratio) Detects "Long Lower Shadow" candle patterns
Parameters:
ratio : (float) A relationship of the lower wick to the overall candle size expressed as a percent. Default is 75%
Returns: (series bool) True when pattern detected
llsLab(showLabel, labelColor, textColor) Produces "Long Lower Shadow" identifier label
Parameters:
showLabel : (bool) Shows label when input is true. Default is false
labelColor : (series color) Color of the label border and arrow
textColor : (series color) Text color
Returns: (series label) A label visible at the chart level intended for the title pattern
lus(ratio) Detects "Long Upper Shadow" candle patterns
Parameters:
ratio : (float) A relationship of the upper wick to the overall candle size expressed as a percent. Default is 75%
Returns: (series bool) True when pattern detected
lusLab(showLabel, labelColor, textColor) Produces "Long Upper Shadow" identifier label
Parameters:
showLabel : (bool) Shows label when input is true. Default is false
labelColor : (series color) Color of the label border and arrow
textColor : (series color) Text color
Returns: (series label) A label visible at the chart level intended for the title pattern
bullNeck() Detects "Bullish On Neck" candle patterns
Returns: (series bool) True when pattern detected
nwLab(showLabel, labelColor, textColor) Produces "Bullish On Neck" identifier label
Parameters:
showLabel : (bool) Shows label when input is true. Default is false
labelColor : (series color) Color of the label border and arrow
textColor : (series color) Text color
Returns: (series label) A label visible at the chart level intended for the title pattern
bearNeck() Detects "Bearish On Neck" candle patterns
Returns: (series bool) True when pattern detected
nbLab(showLabel, labelColor, textColor) Produces "Bearish On Neck" identifier label
Parameters:
showLabel : (bool) Shows label when input is true. Default is false
labelColor : (series color) Color of the label border and arrow
textColor : (series color) Text color
Returns: (series label) A label visible at the chart level intended for the title pattern
soldiers(wickSize) Detects "Three White Soldiers" candle patterns
Parameters:
wickSize : (float) Maximum allowable top wick size throughout pattern expressed as a percent of total candle height. Default is 5%
Returns: (series bool) True when pattern detected
wsLab(showLabel, labelColor, textColor) Produces "Three White Soldiers" identifier label
Parameters:
showLabel : (bool) Shows label when input is true. Default is false
labelColor : (series color) Color of the label border and arrow
textColor : (series color) Text color
Returns: (series label) A label visible at the chart level intended for the title pattern
crows(wickSize) Detects "Three Black Crows" candle patterns
Parameters:
wickSize : (float) Maximum allowable bottom wick size throughout pattern expressed as a percent of total candle height. Default is 5%
Returns: (series bool) True when pattern detected
bcLab(showLabel, labelColor, textColor) Produces "Three Black Crows" identifier label
Parameters:
showLabel : (bool) Shows label when input is true. Default is false
labelColor : (series color) Color of the label border and arrow
textColor : (series color) Text color
Returns: (series label) A label visible at the chart level intended for the title pattern
triStarBull() Detects "Bullish Tri-Star" candle patterns
Returns: (series bool) True when pattern detected
tswLab(showLabel, labelColor, textColor) Produces "Bullish Tri-Star" identifier label
Parameters:
showLabel : (bool) Shows label when input is true. Default is false
labelColor : (series color) Color of the label border and arrow
textColor : (series color) Text color
Returns: (series label) A label visible at the chart level intended for the title pattern
triStarBear() Detects "Bearish Tri-Star" candle patterns
Returns: (series bool) True when pattern detected
tsbLab(showLabel, labelColor, textColor) Produces "Bearish Tri-Star" identifier label
Parameters:
showLabel : (bool) Shows label when input is true. Default is false
labelColor : (series color) Color of the label border and arrow
textColor : (series color) Text color
Returns: (series label) A label visible at the chart level intended for the title pattern
wrap(cond, barsBack, borderColor, bgcolor) Produces a box wrapping the highs and lows over the look back.
Parameters:
cond : (series bool) Condition under which to draw the box.
barsBack : (series int) the number of bars back to begin drawing the box.
borderColor : (series color) Color of the four borders. Optional. The default is color.gray.
bgcolor : (series color) Background color of the box. Optional. The default is color.gray.
Returns: (series box) A box who's top and bottom are above and below the highest and lowest points over the lookback
topWick() returns the top wick size of the current candle
Returns: (series float) A value equivelent to the distance from the top of the candle body to its high
bottomWick() returns the bottom wick size of the current candle
Returns: (series float) A value equivelent to the distance from the bottom of the candle body to its low
body() returns the body size of the current candle
Returns: (series float) A value equivelent to the distance between the top and the bottom of the candle body
highestBody() returns the highest body of the current candle
Returns: (series float) A value equivelent to the highest body, whether it is the open or the close
lowestBody() returns the lowest body of the current candle
Returns: (series float) A value equivelent to the highest body, whether it is the open or the close
barRange() returns the height of the current candle
Returns: (series float) A value equivelent to the distance between the high and the low of the candle
bodyPct() returns the body size as a percent
Returns: (series float) A value equivelent to the percentage of body size to the overall candle size
midBody() returns the price of the mid-point of the candle body
Returns: (series float) A value equivelent to the center point of the distance bewteen the body low and the body high
bodyupGap() returns true if there is a gap up between the real body of the current candle in relation to the candle prior
Returns: (series bool) true if there is a gap up and no overlap in the real bodies of the current candle and the preceding candle
bodydwnGap() returns true if there is a gap down between the real body of the current candle in relation to the candle prior
Returns: (series bool) true if there is a gap down and no overlap in the real bodies of the current candle and the preceding candle
gapUp() returns true if there is a gap down between the real body of the current candle in relation to the candle prior
Returns: (series bool) true if there is a gap down and no overlap in the real bodies of the current candle and the preceding candle
gapDwn() returns true if there is a gap down between the real body of the current candle in relation to the candle prior
Returns: (series bool) true if there is a gap down and no overlap in the real bodies of the current candle and the preceding candle
dojiBody() returns true if the candle body is a doji
Returns: (series bool) true if the candle body is a doji. Defined by a body that is 5% of total candle size

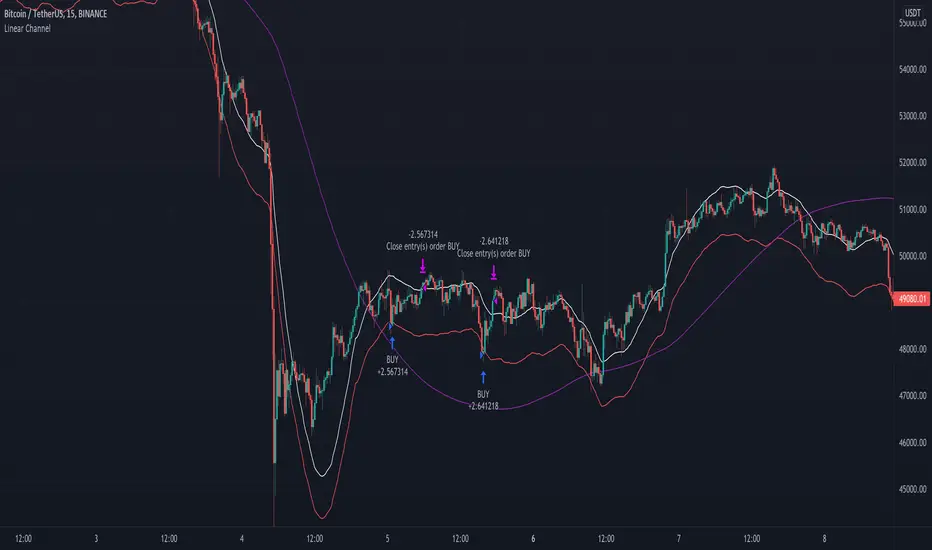
Linear Channel - Scalp Strategy 15MSimple way how to use Linear Regression for trading.
What we use:
• Linear Regression
• HMA as a trend filter
Logic:
Firstly we make simple linear regression moving. It is the white line which appears on the chart.
Then we make second line (named: band2) on the chart by multiplying linreg and value difference.
The third step is to ad HMA as a trend filter.
The trade open when price is below band2, but still upper than Hullma. The trade close when price again upper than linreg.
Automated Bitcoin (BTC) Investment Strategy from Wunderbit Automated Bitcoin (BTC) Investment Strategy from Wunderbit Trading
This strategy is designed for the automated long-term investment in Bitcoin. The BTC investment strategy is primarily suitable for long-term investors who want to increase the percentage of their investments through timely trading long-term transactions. The main feature is the difference from the indicator of long-term investment. Based on their statistics, this figure is 2 times less. That is, if we just bought Bitcoin and held it, we would receive 2 times less than if we applied the BTC Investment strategy.
This strategy uses the intersection of the triple exponential moving average and the least squares moving average. We also control the profit you will make during an uptrend by implementing a trailing stop based on the ATR indicator.
This is a spot market-only strategy and can be used primarily for long-term investors. The strategy is designed to create an automatic version of investing using a webhook.
Automation allows you to safely ignore the state of your portfolio and exclude emotions.
In order to create a cryptocurrency bot for this strategy, you need to:
1. Create alerts and link the URL to the webhook.
2. Connect the TradingView strategy with automated trading service.

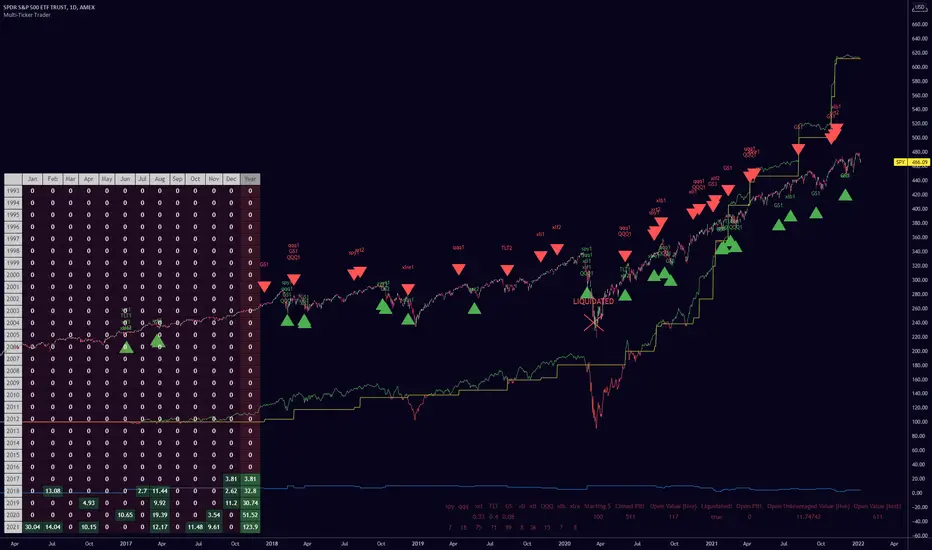
Multiple Ticker TraderThis indicator can be used as an alternative to the built in Strategy Tester for those who want to (back) test a strategy on multiple tickers simultaneously and see it's performance.
Just change the buy and sell conditions in the code to fit your needs.
The strategy I've used here is scaling into up to 10 tickers a maximum of 5 times per ticker every time they retrace (another) 10% from their all time high.
You can set the maximum number of total trades and disable scale ins by setting them to an impossible number (such as, 99% away from the all time high).
Credit to QuantNomad for the monthly/yearly returns table bottom left.
The bottom right table shows the current number of shares the algo is long and also the total all-time returns from each individual ticker, and other data.
The blue line is the number of positions the script is currently long. Each scale into the same ticker represents one position.
The yellow line is the closed P&L.
The green/red line is the live P&L.
I've used leverage for the example image just to showcase the liquidation display.
These particular buy/sell conditions cannot close positions at a loss, so be careful if you're wild enough to use this setup live without understanding the script yourself. I haven't used it live myself yet and you should assume there are serious bugs before thinking about using it live, though I'm using a similar thing on cryptos and it's going fine.
You can edit the leverage, maximum trades and back test range in the settings. The number following the ticker on each label represents which scale in was bought/sold.
Enjoy :) let me know if you find any good results
200DMA last DOM - ajhImplements and backtests a simple 200 day moving average trend following rules based on last day of month to limits trades to 12 per year.
From the book : 5 BEST Moving Average Strategies (That beat buy and hold) by Steve Burns and Holly Burns
Click on the cog to set the input date range eg; 2000-01-01 to 2016-12-31
The book back tested SP500 returns from 2000-2016 317% using this method vs 125% buy and hold only with less drawdown.
Simple 200 day moving average test and trading on last day of month.
(you may find it trades on next available day close to end of month as not all dates can be traded weekends etc..)
Rules are ;
1. if last day of month and stock over 200 day moving average, then go long 100%
2. if last day of month and stock under 200 day moving average, then close long 100% and goto cash.
Aims to miss market declines and keep you long for upside.
Note: Have found doesn't work well in choppy markets moving sideways like the FTSE100 for same period 2000-2016 and causes losses. Also for many stocks.

ETF 3-Day Reversion StrategyIntroduction: This strategy is a modification of the “3-day Mean Reversion Strategy” from the book "High Probability ETF Trading" by Larry Connors and Cesar Alvarez. In the book, the authors discuss a high-probability ETF mean reversion strategy for a 1-day time-frame with these simple rules:
The price must be above the 200 day SMA and below the 5 day SMA.
The low of today must be lower than the low of yesterday (must be true for 3 consecutive days)
The high of today must be lower than the high of yesterday (must be true for 3 consecutive days)
If the 3 rules above are true, then buy on the close of the current day.
Exit when the closing price crosses above the 5 day SMA.
In practice and in backtesting, I’ve found that the strategy consistently works better when using an EMA for the trend-line instead of an SMA. So, this script uses an EMA for the trend-line. I’ve also made the length of the exit EMA adjustable.
How it works:
The Strategy will buy when the buy conditions above are true. The strategy will sell when the closing price crosses over the Exit Moving Average
Plots:
Green line = Exit Moving Average (Default 5 Day EMA)
Blue line = 5 Day EMA (Used as Entry Criteria)
Disclaimer: Open-source scripts I publish in the community are largely meant to spark ideas that can be used as building blocks for part of a more robust trade management strategy. If you would like to implement a version of any script, I would recommend making significant additions/modifications to the strategy & risk management functions. If you don’t know how to program in Pine, then hire a Pine-coder. We can help!

Gap Absorption StrategyLike the nature, markets don't like the void, and this is something we can take advantage of by trading gaps on some markets.
This technique is well known, so I wanted to write a tiny script based on this strategy to get a bit more comfortable with it.
IMPORTANT: Default parameters wont give you good trades on every markets, you need to modify these parameters to see which proportions correspond to the stock you're trading.
This script triggers signals on predefined variation of a stock price after a gap, and allows its user to configure TP and SL prices corresponding to a specific percentage of this gap movement.
Note: We can observe that opening gaps are often the most interesting.
Options
Trigger: the price variation you want to trigger on (in % of the price)
Stop Loss : in % of the gap
Take profit : in % of the gap
A small table is displayed in the top right corner of the chart to give you TP/SL/Signal prices for each opportunity
SL (red line) and TP (green line) are also displayed on the chart when a signal is triggered
Information concerning the current opportunity is given at the bottom of the chart
Note: This script is based on the Gap-Size-Indicator that I published a few weeks ago.

Heikin Ashi Candle Startegy for Long PositionThis strategy utilize Heikin-Ashi candlestick chart.
Heikin-Ashi technique is a Japanese candlestick-based technical trading tool that uses candlestick charts to represent and visualize market price data.
Heikin-Ashi candle is essentially taking an average of the movement.
There is a tendency with Heikin-Ashi for the candles to stay red during a downtrend and green during an uptrend.
This strategy only apply for long trading position.
The idea is trader will waiting 3 green candles for validation period (confirmation) before entering long position.
Different timeframe will result different result.
Number of validation period can be changed to see different result
This strategy has parameter for take profit percentage, trailing stop and stop loss.
User can set maximum active position to minimize risk and qty order.
This tool is useful for user who wants to backtest Heikin-Ashi trading strategy.
Script will emit alert when long position is opened and closed.
Warning of Backtesting
Backtesting is backward-looking. As the name implies, you are testing how something would have worked if you traded it perfectly in the past.
Past performance does not indicate future performance and you should not assume it does.
Backtesting assumes you never miss-fire, that you get in and out at the exactly perfect moment each time.
Backtesting assumes you have perfect liquidity, and your limit orders fill at a specific, pre-defined price every time (either the open, close, low, high, or some average of these).
Disclaimer
Do your own research and consider fundamental price of asset.
The indicators provided on this script is for educational purposes only.
Author does not offer advisory or brokerage services, nor does it recommend or advise users to buy or sell particular stocks or securities.
Please examined script and give feedback for further improvement.
Script are open to public, everyone see and clone source code or just apply to chart. Please make comment for improvement.

Super Auto Breakout Day Trade Volatile stocksThis strategy is looking at MA and distance from MA to determine entry and exit for highly volatile day trade stocks.
This trading strategy is not good for big-cap stocks as the movement there is not much in terms of %.
The target for open trade is to close at a 10% gain or at 2.8% loss which is a good risk to reward ratio.
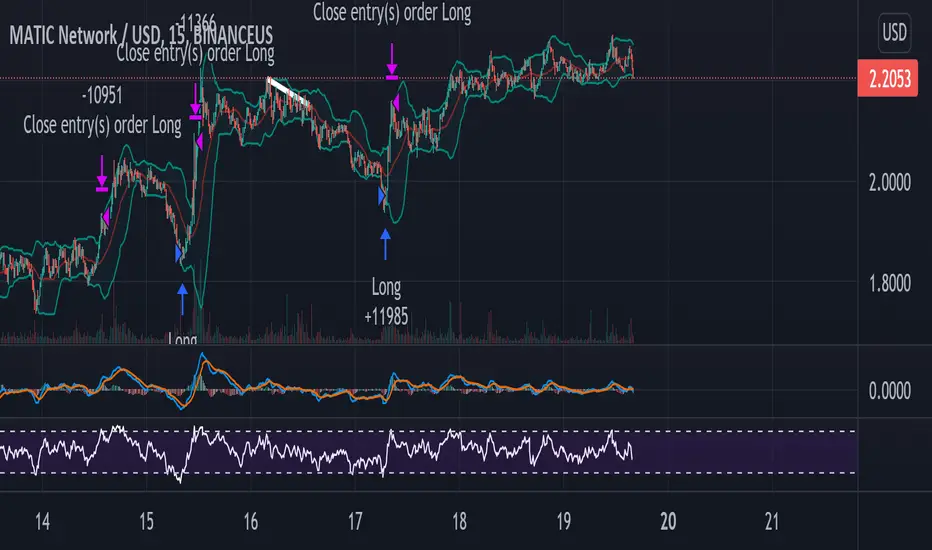
MATIC/USD 1H Bot for 3commas (works w/o 3commas too)This is a MATIC/USD or USDT specific implementation of my BNB/USD 1 hour bot. It should work out of the gate correctly for MATIC, at least based on what has been happening with it for the past seven weeks. You can fiddle with the following settings using the gear icon:
Fast and slow MACD length
The decision to use RSI thresholds as requirements for buys and/or sells, as well as the chart timeframe to use for that (make sure you use the same timeframe as your chart or a higher timeframe. You don't want to use a 1m RSI on a one hour chart but you can use a 4 hour RSI on a 1 hour chart with no issues.)
Buy and/or sell RSI threshold limits
Trailing stop loss %
Start date (for backtesting, I usually leave mine with 1-2 months trailing as those are usually better indicators than how they would have performed over the past few years)
Stress levels
Moving Average length and type
Linear regression amount
The gist of this bot is that it will use a smoothed EMA to make informed buys and sells. The smoothing prevents most noise from affecting your orders. It also allows you to set a trailing stop loss. If you don't want to use this feature set the value to 100 and it will effectively disable it.
Finally, you can disable RSI threshold point visibility. This won't affect bot operation, it just makes it cleaner to look at on your chart. Disabling RSI buys or sells will also disable visibility.
This bot takes a shotgun strategy to buys and sells. It makes a lot of buys and the majority of them are closed with little to no movement up or down. However, the ones that are profitable make a LOT as you will see once you start testing.
I make the full version of these bots available (though the script is protected) so users can test them, however if you want to use it with 3commas you will need access to the full script. Message me if you want the code and we can figure something out.

RSI-based strategy for MATIC on 3commas - uses a 15m chartI looked all over TradingView and could not find a script that specifically does this so I wrote one. It's not complicated but it works pretty well. Essentially the concept is that you specify two RSI values: a buying threshold and selling threshold. The indicator will make buys based on RSI crossing your buy threshold and sells based on it crossing your sell threshold.
You can change the actual RSI parameters though I have found it works best with the default settings I have listed. It is set for a 15m MATIC chart but you can use it with anything on any time period but you will need to modify the thresholds and check the backtester if you use it on anything other than a 15m MATIC chart.
There is also a date range selector so you can test it over a specific time period. I typically use the past 1-2 months to get a good feel for if the settings I have picked work well in current market conditions.
It also functions as a regular RSI indicator so if you use this you probably don't need to apply any other RSI indicators to your chart.
I have made the indicator usable so that you can test it out manually to verify that it works as expected and if you want access to the script itself (to enable automated trading on 3commas) please message me and we can work something out.
In the future I might add some extra settings to this like a smoothed EMA so you can make more discerning buys, it depends on how many people contact me for the full script.
EMA Cross + Divergence strategy (Div. signals by The Divergent)A sample strategy demonstrating the usage of The Divergent divergence indicator and The Divergent Library .
The Divergent is an advanced divergence indicator which you can easily incorporate into your own strategies.
In order to use this strategy (and to use the signals in your own strategy), you need to have the Pro version of The Divergent applied to your chart.
For more information, please see the comments inlined in the code.

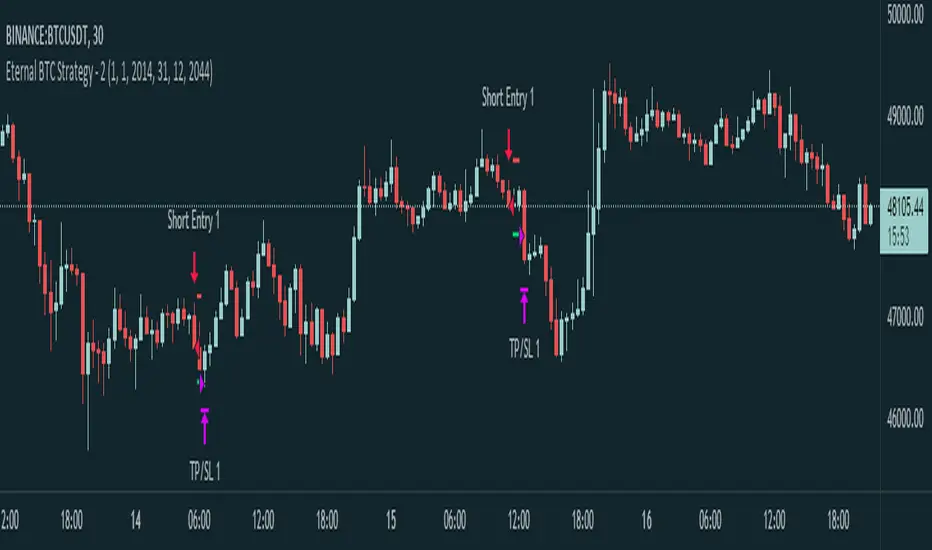
Eternal BTC Strategy - 2This is a summary of how this strategy works.
- Momentum, Volatility detection:
1. First of all detects market momentum
2. Uses volume indicators to make sure of the movement existence
- Trade execution:
3. Uses crossovers of some MAs
4. After crossovers, waits for trend analysis indicators signals to trigger the order
- Take profit & Stop loss:
5. Calculates SL and TP using a formula (combined of volume , MAs and others)
* This is just a simple representation of how this strategy works, It's coded in about a 2000 lines script.
This strategy works best on Bitcoin / TetherUS • BINANCE
No setting is needed to be applied by you, you'll just simply add the script and receive alarms.
Alarms are included opening of the trade, TP and SL touch.
BTC Strategy - EternalThis is a summary of how this strategy works.
- Momentum, Volatility detection:
1. First of all detects market momentum
2. Uses volume indicators to make sure of the movement existence
- Trade execution:
3. Uses crossovers of some MAs
4. After crossovers, waits for trend analysis indicators signals to trigger the order
- Take profit & Stop loss:
5. Calculates SL and TP using a formula (combined of volume , MAs and others)
* This is just a simple representation of how this strategy works, It's coded in about a 2000 lines script.
As you can see, it has a great performance, 71.59% win rate in 989 trades so it's a very confident result.
This strategy works best on Bitcoin / TetherUS • BINANCE
No setting is needed to be applied by you, you'll just simply add the script and receive alarms.
Alarms are included opening of the trade, TP and SL touch.

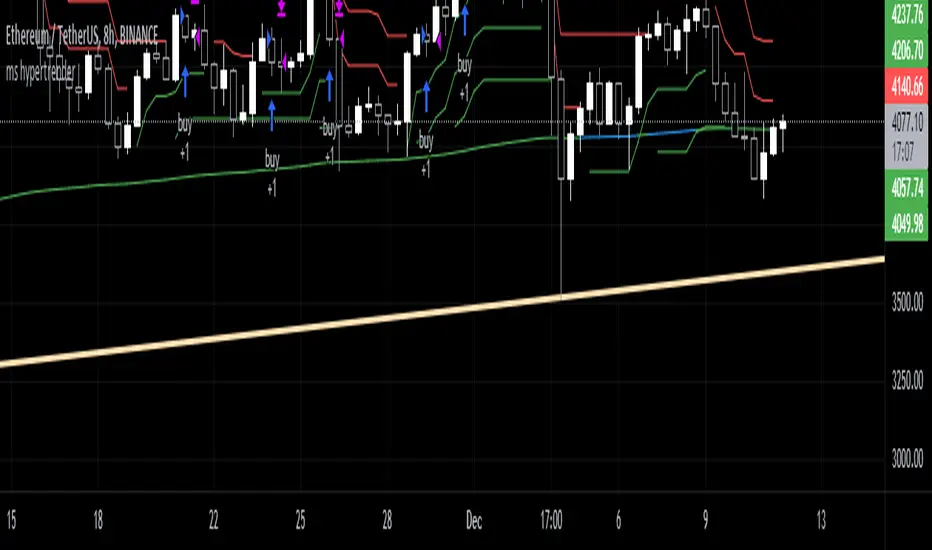
ms hypersupertrendThis is a well-known strategy by using 3 different Supertrends and a trend-defining EMA,
feel free to play around with the settings, a backtest on 8h ETHUSDT pair brought some good results using
the 233EMA and investing 75% of a 10k start capital
the idea is to have at least 2 super trends going green above the trend-EMA to go long and exit by turning
2 super trends red (idea: 1 super trend in red could initialize a take profit)
shorts work vice versa
The EMA shows in green for uptrends and in red for downtrends, if it is blue no Signal will be taken because
the 3 super trends are not all above or below the trendline(EMA)
//-------------------------------------------------------------------------------------------------------------------------------------------------
Update 1:
- Fixed a minor input error
- Added ATR stoploss, and commented out the percentage stop loss
- Added time window to backtest
- Added exit on risk/reward is met
- This version is only buy...wait for next update adding shorts and more
As always, thanks for your ideas, likes, and support. Feel free to mess around with the settings and give me your feedback.

Super Breakout day trading This is an intraday indicator which uses Bollinger band and volume flow and MA to alert buy and sell signal.
A user can use this indicator to help make entry and exits. This indicator wont show entry and exist of larger time frames like Day week month.
This indicator uses Bollinger bands but try to minimize it shortcoming where it will buy and keep holding and eventually sell at a loss.
By adding addition parameters around volume it check if the price has reached its peak

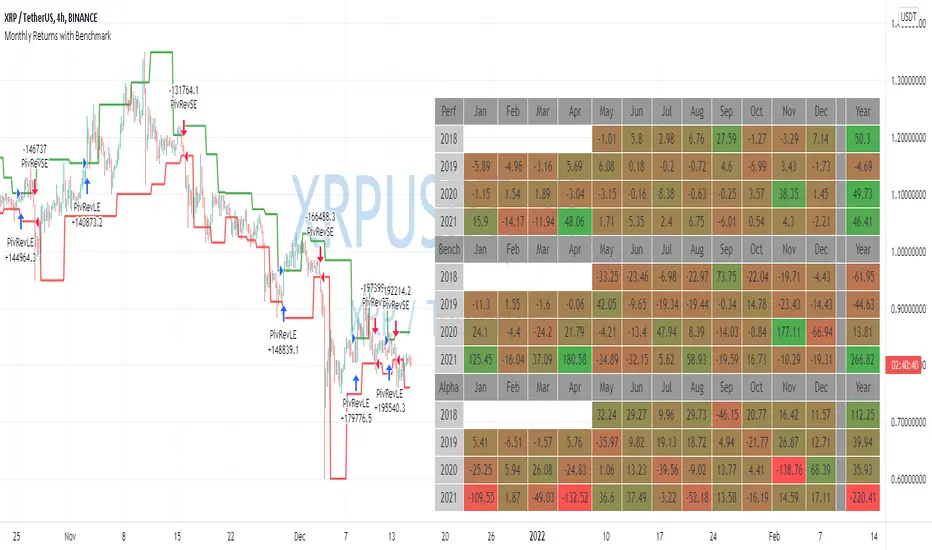
Monthly Returns with BenchmarkI keep working on trying to make TradingView strategies look fancier.
A few months ago I published the first version of the Monthly Returns for Strategies in Pine Script. I received quite a lot of good feedback and quite a lot of requests to update it.
This is a more advanced version of the Monthly Returns, in it, you can:
Display monthly returns of your strategy, benchmark, and alpha over this benchmark.
Select benchmark to be another instrument
Select the date from which you want to compute monthly returns
Show/hide benchmark and alpha
Choose colors for gradient for gain/loss values
Use it with any type of strategy
Use it with replay
I hope it will be useful for you.
It's not about the strategy itself but the way you display returns on your chart. So pls don't critique my choice of the strategy and its performance 🙂
Disclaimer
Please remember that past performance may not be indicative of future results.
Due to various factors, including changing market conditions, the strategy may no longer perform as well as in historical backtesting.
This post and the script don’t provide any financial advice.
Contrarian Scalping Counter Trend Bb Envelope Adx and StochasticContrarian Scalping is an trading strategy designed to take advanted of a counter-trend.
The advantage of these strrategies types is that they have a good profitability but with do not great gain (in relation at the time frame).
Indicators used:
Bollinger
Envelope
ADX
Stochastic
Rules for entry
For short: close of the price is above upper band from bb and envelope, adx is below 30 and stochastic is above 50
For long: close of the price is below lower band from bb and envelope, adx is below 30 and stochastic is below 50
Rules for exit
For short: either close of the candle is below lower band of bb or enveloper or stochastic is below 50
For long: either close o the candle is above upper band of bb or envelope or stochastic is above 50
If there are any questions let me know !

moonshot hypertrender (supertrend strategy)
This is a well-known strategy by using 3 different Supertrends and a trend-defining EMA,
feel free to play around with the settings, a backtest on 8h ETHUSDT pair brought some good results using
the 233EMA and investing 75% of a 10k start capital.
The idea is to have at least 2 Supertrends going green above the trend-EMA to go into a long position. The exit
will be triggered if 2 Supertrends change to red (idea: 1 super trend in red could initialize a take profit).
Taking shorts works vice versa.
The EMA shows in green for uptrends and in red for downtrends, if it is blue (ranging market) no Signal will be taken because
the 3 Supertrends are not all above or below the trendline(EMA).
I heard about this strategy on youtube but I can't get the promised 60% win-rate ;)
any suggestions to improve it are welcome
Hope you find it useful and it would be nice to get your feedback
-theasgard-