The Pivot Detector Oscillator Strategy The Pivot Detector Oscillator, by Giorgos E. Siligardos The related article is copyrighted material from Stocks & Commodities 2009 Sep WARNING: - This script to change bars colors.Pine Script®指標由HPotter提供1169
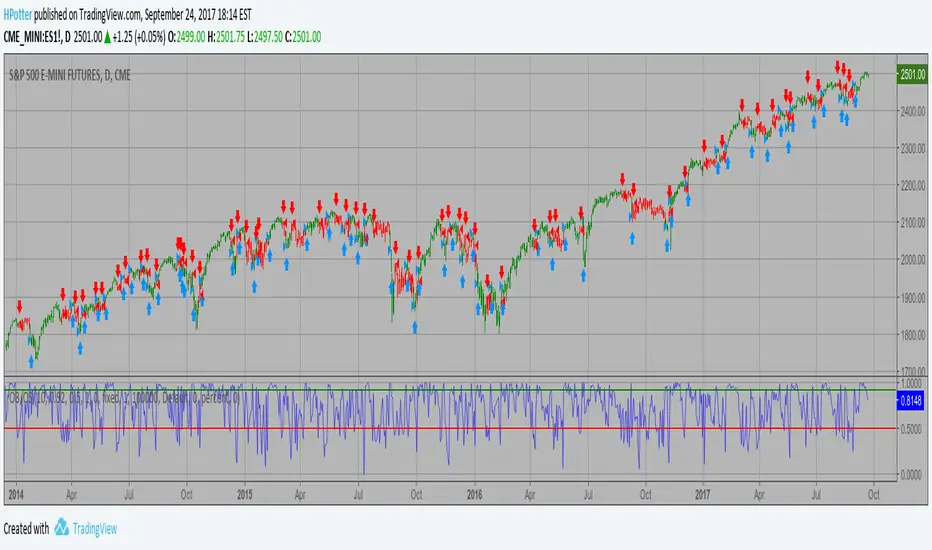
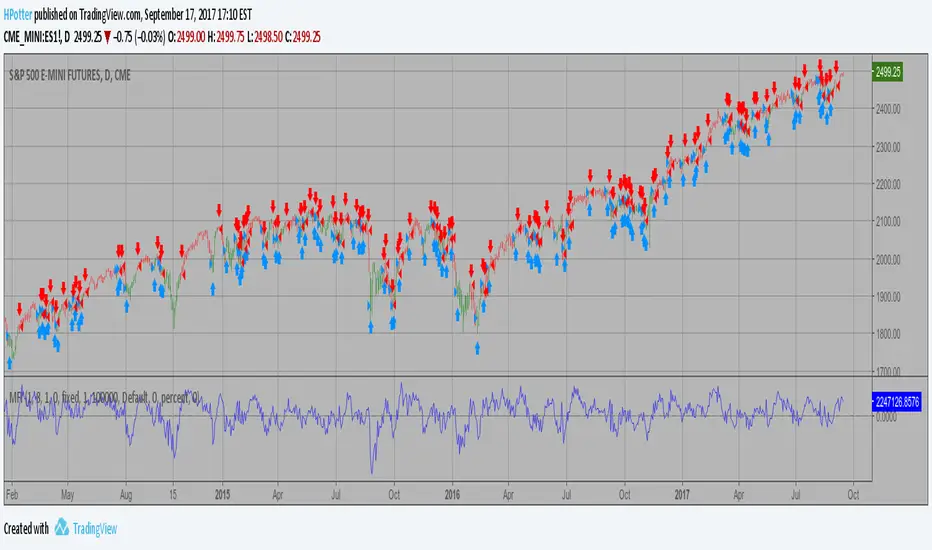
PFE (Polarized Fractal Efficiency) Backtest The Polarized Fractal Efficiency (PFE) indicator measures the efficiency of price movements by drawing on concepts from fractal geometry and chaos theory. The more linear and efficient the price movement, the shorter the distance the prices must travel between two points and thus the more efficient the price movement. You can change long to short in the Input Settings WARNING: - For purpose educate only - This script to change bars colors.Pine Script®策略由HPotter提供112
PFE (Polarized Fractal Efficiency) Strategy The Polarized Fractal Efficiency (PFE) indicator measures the efficiency of price movements by drawing on concepts from fractal geometry and chaos theory. The more linear and efficient the price movement, the shorter the distance the prices must travel between two points and thus the more efficient the price movement. WARNING: - This script to change bars colors.Pine Script®指標由HPotter提供75
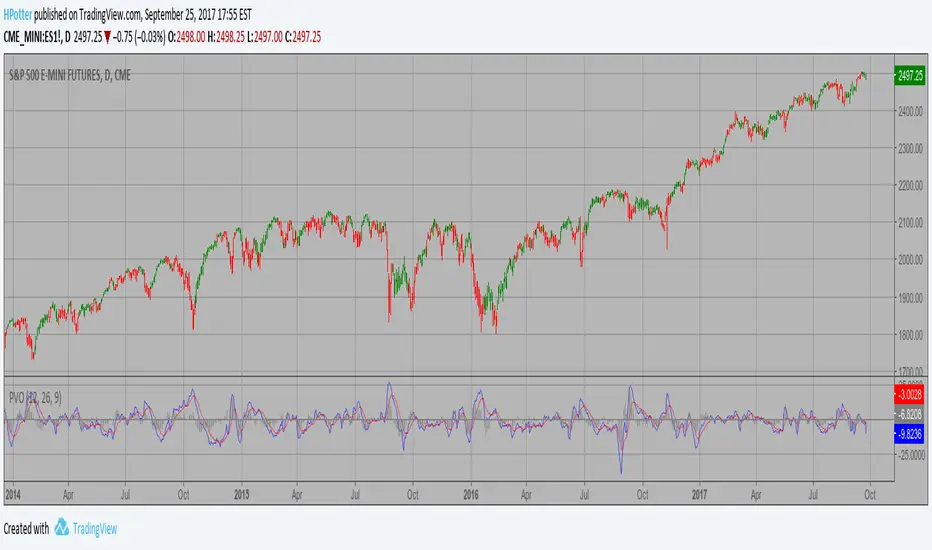
Percentage Volume Oscillator (PVO) Backtest The Percentage Volume Oscillator (PVO) is a momentum oscillator for volume. PVO measures the difference between two volume-based moving averages as a percentage of the larger moving average. As with MACD and the Percentage Price Oscillator (PPO), it is shown with a signal line, a histogram and a centerline. PVO is positive when the shorter volume EMA is above the longer volume EMA and negative when the shorter volume EMA is below. This indicator can be used to define the ups and downs for volume, which can then be use to confirm or refute other signals. Typically, a breakout or support break is validated when PVO is rising or positive. You can change long to short in the Input Settings WARNING: - For purpose educate only - This script to change bars colors.Pine Script®策略由HPotter提供81
Percentage Volume Oscillator (PVO) Strategy The Percentage Volume Oscillator (PVO) is a momentum oscillator for volume. PVO measures the difference between two volume-based moving averages as a percentage of the larger moving average. As with MACD and the Percentage Price Oscillator (PPO), it is shown with a signal line, a histogram and a centerline. PVO is positive when the shorter volume EMA is above the longer volume EMA and negative when the shorter volume EMA is below. This indicator can be used to define the ups and downs for volume, which can then be use to confirm or refute other signals. Typically, a breakout or support break is validated when PVO is rising or positive. WARNING: This script to change bars colors.Pine Script®指標由HPotter提供70
Overbought/Oversold Simple Overbought/Oversold indicator You can change long to short in the Input Settings WARNING: - For purpose educate only - This script to change bars colors.Pine Script®策略由HPotter提供11151
Overbought/Oversold Simple Overbought/Oversold indicator WARNING: This script to change bars colors.Pine Script®指標由HPotter提供105
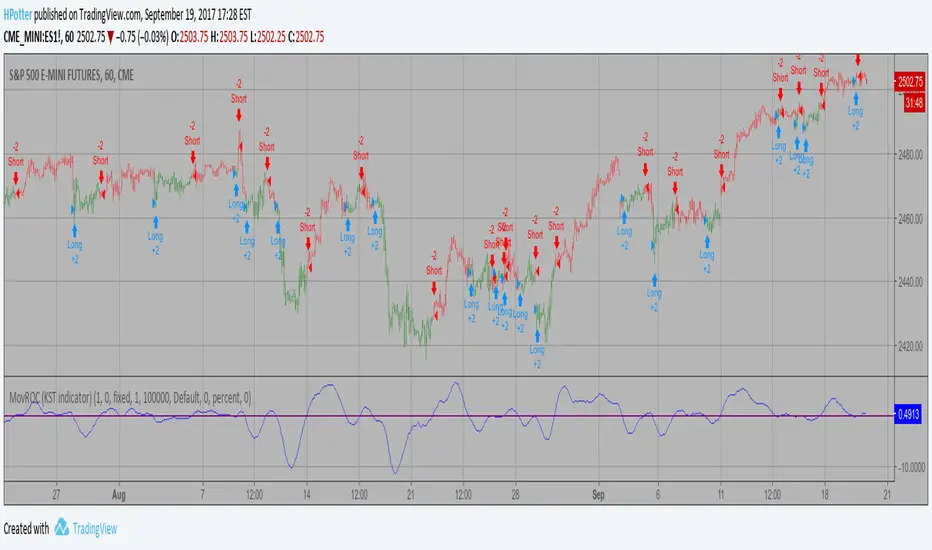
MovROC (KST indicator) Backtes This indicator really is the KST indicator presented by Martin Pring. the KST indicator is a weighted summed rate of change oscillator that is designed to identify meaningful turns. Various smoothed rate of change indicators can be combined to form different measurements of cycles. You can change long to short in the Input Settings WARNING: - For purpose educate only - This script to change bars colors.Pine Script®策略由HPotter提供235
MovROC (KST indicator) This indicator really is the KST indicator presented by Martin Pring. the KST indicator is a weighted summed rate of change oscillator that is designed to identify meaningful turns. Various smoothed rate of change indicators can be combined to form different measurements of cycles. WARNING: This script to change bars colors.Pine Script®指標由HPotter提供123
Money Flow Indicator (Chaikin Oscillator) Indicator plots Money Flow Indicator (Chaikin). This indicator looks to improve on Larry William's Accumulation Distribution formula that compared the closing price with the opening price. In the early 1970's, opening prices for stocks stopped being transmitted by the exchanges. This made it difficult to calculate Williams' formula. The Chaikin Oscillator uses the average price of the bar calculated as follows (High + Low) /2 instead of the Open. The indicator subtracts a 10 period exponential moving average of the AccumDist function from a 3 period exponential moving average of the AccumDist function. You can change long to short in the Input Settings WARNING: - For purpose educate only - This script to change bars colors.Pine Script®策略由HPotter提供582
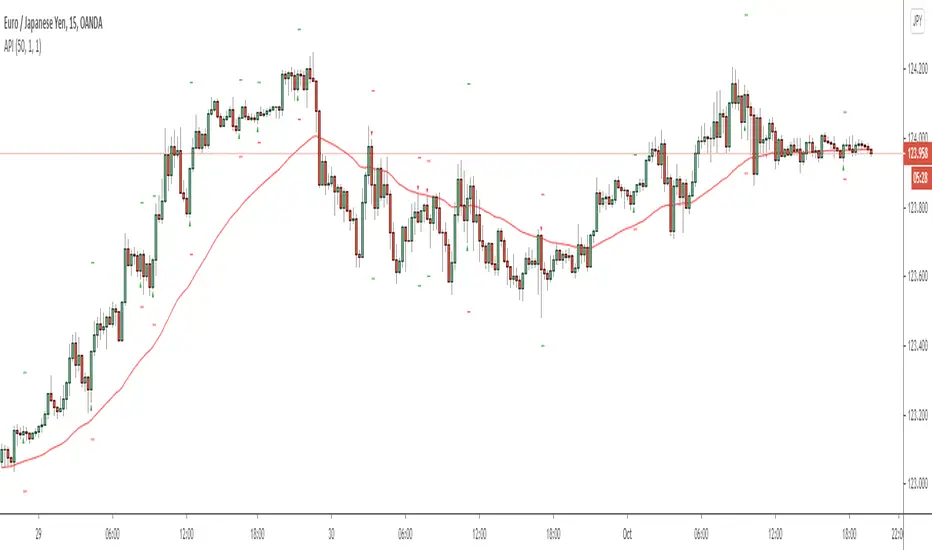
Aggressive Pullback IndicatorThis indicator is designed to be used with the rules of Steven Hart's Aggressive Pullback Strategy. It is intended for use on the 4-hour timeframe of certain currency pairs, but will work on all timeframes and instruments. The rules are customizable, but the default settings are designed to reflect the rules of Steven's pullback strategy as closely as possible. To enable alerts: Add the indicator to the chart and create a new alert with the settings Condition: API , Frequency: Once Per Bar (on Close). Feel free to message me if you have any questions :) - Matt.Pine Script®指標由ZenAndTheArtOfTrading提供已更新 1212 2.4 K
MASS Index Backtest The Mass Index was designed to identify trend reversals by measuring the narrowing and widening of the range between the high and low prices. As this range widens, the Mass Index increases; as the range narrows the Mass Index decreases. The Mass Index was developed by Donald Dorsey. You can change long to short in the Input Settings WARNING: - For purpose educate only - This script to change bars colors.Pine Script®策略由HPotter提供80
MASS Index Strategy The Mass Index was designed to identify trend reversals by measuring the narrowing and widening of the range between the high and low prices. As this range widens, the Mass Index increases; as the range narrows the Mass Index decreases. The Mass Index was developed by Donald Dorsey. WARNING: This script to change bars colors.Pine Script®指標由HPotter提供44
MACD Crossover Backtest MACD – Moving Average Convergence Divergence. The MACD is calculated by subtracting a 26-day moving average of a security's price from a 12-day moving average of its price. The result is an indicator that oscillates above and below zero. When the MACD is above zero, it means the 12-day moving average is higher than the 26-day moving average. This is bullish as it shows that current expectations (i.e., the 12-day moving average) are more bullish than previous expectations (i.e., the 26-day average). This implies a bullish, or upward, shift in the supply/demand lines. When the MACD falls below zero, it means that the 12-day moving average is less than the 26-day moving average, implying a bearish shift in the supply/demand lines. A 9-day moving average of the MACD (not of the security's price) is usually plotted on top of the MACD indicator. This line is referred to as the "signal" line. The signal line anticipates the convergence of the two moving averages (i.e., the movement of the MACD toward the zero line). Let's consider the rational behind this technique. The MACD is the difference between two moving averages of price. When the shorter-term moving average rises above the longer-term moving average (i.e., the MACD rises above zero), it means that investor expectations are becoming more bullish (i.e., there has been an upward shift in the supply/demand lines). By plotting a 9-day moving average of the MACD, we can see the changing of expectations (i.e., the shifting of the supply/demand lines) as they occur. You can change long to short in the Input Settings WARNING: - For purpose educate only - This script to change bars colors.Pine Script®策略由HPotter提供77569
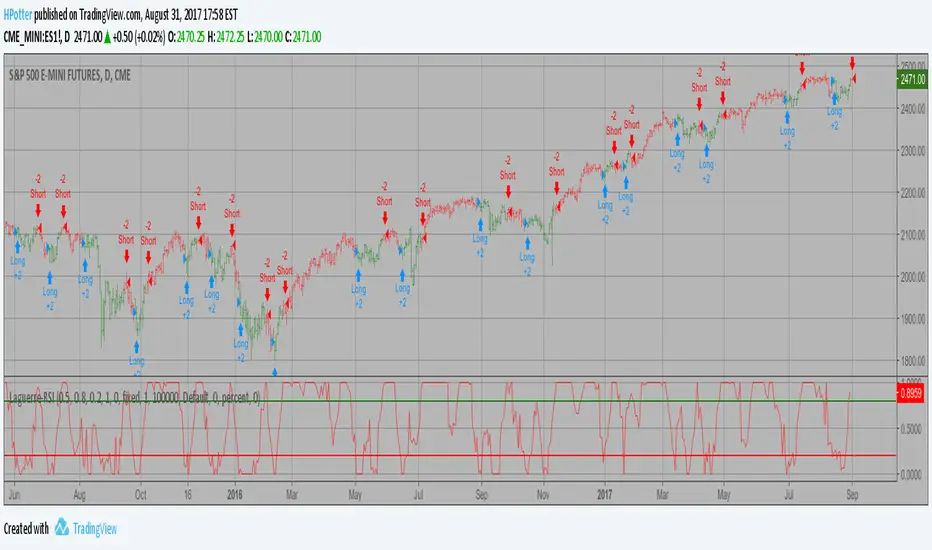
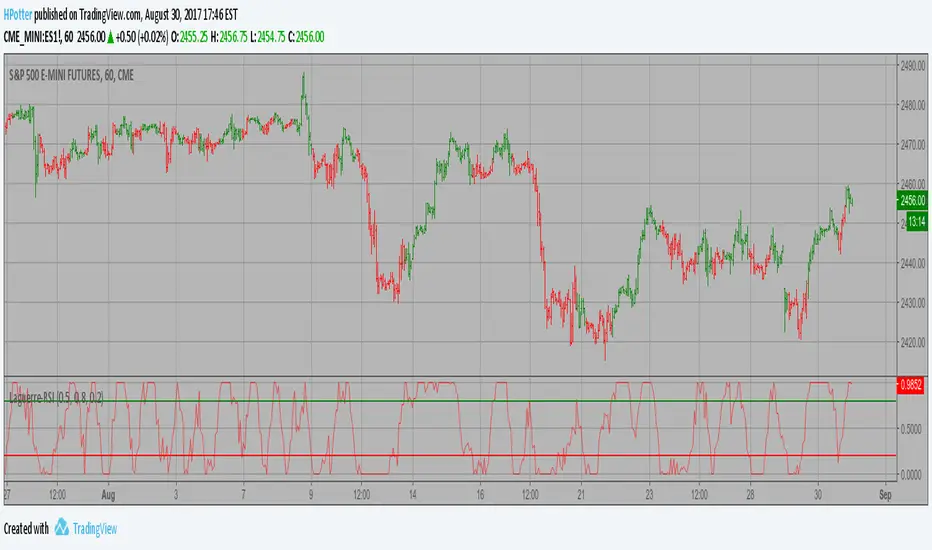
Laguerre-based RSI Backtest This is RSI indicator which is more sesitive to price changes. It is based upon a modern math tool - Laguerre transform filter. With help of Laguerre filter one becomes able to create superior indicators using very short data lengths as well. The use of shorter data lengths means you can make the indicators more responsive to changes in the price. You can change long to short in the Input Settings WARNING: - For purpose educate only - This script to change bars colors.Pine Script®策略由HPotter提供336
Laguerre-based RSI Strategy This is RSI indicator which is more sesitive to price changes. It is based upon a modern math tool - Laguerre transform filter. With help of Laguerre filter one becomes able to create superior indicators using very short data lengths as well. The use of shorter data lengths means you can make the indicators more responsive to changes in the price. WARNING: This script to change bars colors.Pine Script®指標由HPotter提供221
Klinger Volume Oscillator (KVO) Backtest The Klinger Oscillator (KO) was developed by Stephen J. Klinger. Learning from prior research on volume by such well-known technicians as Joseph Granville, Larry Williams, and Marc Chaikin, Mr. Klinger set out to develop a volume-based indicator to help in both short- and long-term analysis. The KO was developed with two seemingly opposite goals in mind: to be sensitive enough to signal short-term tops and bottoms, yet accurate enough to reflect the long-term flow of money into and out of a security. The KO is based on the following tenets: Price range (i.e. High - Low) is a measure of movement and volume is the force behind the movement. The sum of High + Low + Close defines a trend. Accumulation occurs when today's sum is greater than the previous day's. Conversely, distribution occurs when today's sum is less than the previous day's. When the sums are equal, the existing trend is maintained. Volume produces continuous intra-day changes in price reflecting buying and selling pressure. The KO quantifies the difference between the number of shares being accumulated and distributed each day as "volume force". A strong, rising volume force should accompany an uptrend and then gradually contract over time during the latter stages of the uptrend and the early stages of the following downtrend. This should be followed by a rising volume force reflecting some accumulation before a bottom develops. You can change long to short in the Input Settings Please, use it only for learning or paper trading. Pine Script®策略由HPotter提供33234
Kaufman Moving Average Adaptive (KAMA) Backtest Everyone wants a short-term, fast trading trend that works without large losses. That combination does not exist. But it is possible to have fast trading trends in which one must get in or out of the market quickly, but these have the distinct disadvantage of being whipsawed by market noise when the market is volatile in a sideways trending market. During these periods, the trader is jumping in and out of positions with no profit-making trend in sight. In an attempt to overcome the problem of noise and still be able to get closer to the actual change of the trend, Kaufman developed an indicator that adapts to market movement. This indicator, an adaptive moving average (AMA), moves very slowly when markets are moving sideways but moves swiftly when the markets also move swiftly, change directions or break out of a trading range. You can change long to short in the Input Settings Please, use it only for learning or paper trading. Do not for real trading.Pine Script®策略由HPotter提供11230
Kaufman Moving Average Adaptive (KAMA) StrategyEveryone wants a short-term, fast trading trend that works without large losses. That combination does not exist. But it is possible to have fast trading trends in which one must get in or out of the market quickly, but these have the distinct disadvantage of being whipsawed by market noise when the market is volatile in a sideways trending market. During these periods, the trader is jumping in and out of positions with no profit-making trend in sight. In an attempt to overcome the problem of noise and still be able to get closer to the actual change of the trend, Kaufman developed an indicator that adapts to market movement. This indicator, an adaptive moving average (AMA), moves very slowly when markets are moving sideways but moves swiftly when the markets also move swiftly, change directions or break out of a trading range.Pine Script®指標由HPotter提供11336
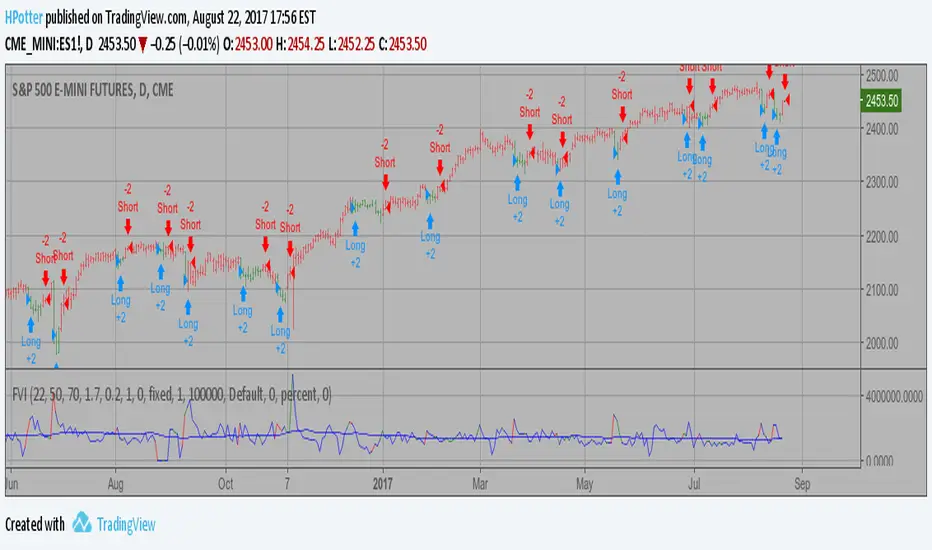
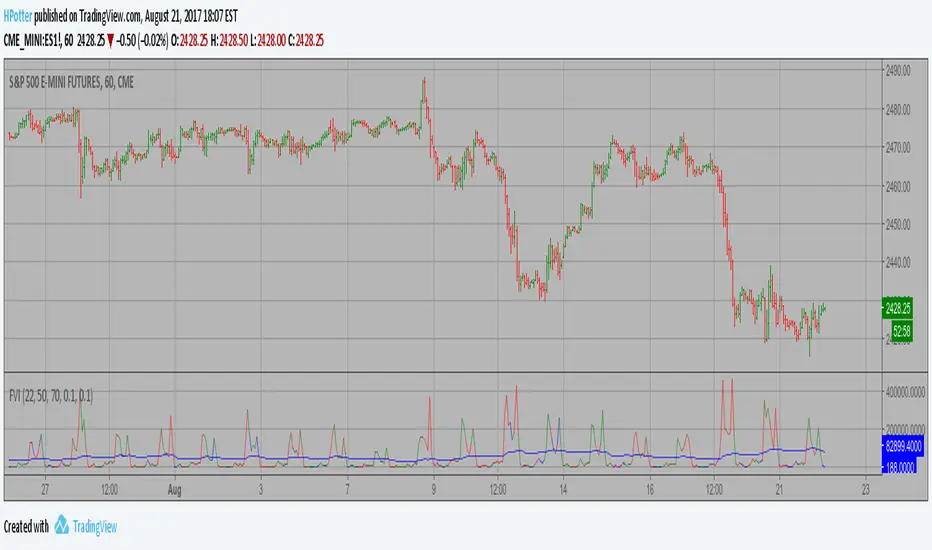
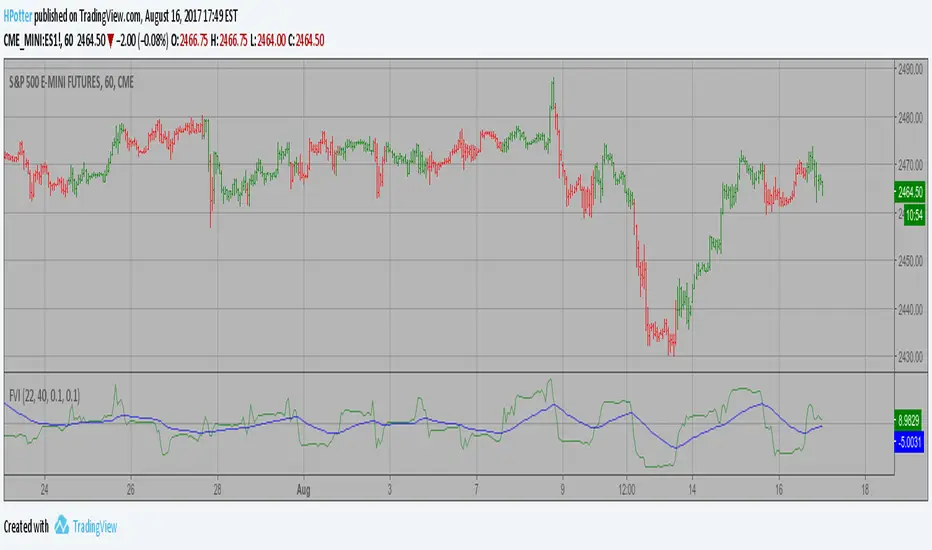
Volatility Finite Volume Elements Strategy The FVE is a pure volume indicator. Unlike most of the other indicators (except OBV), price change doesn?t come into the equation for the FVE (price is not multiplied by volume), but is only used to determine whether money is flowing in or out of the stock. This is contrary to the current trend in the design of modern money flow indicators. The author decided against a price-volume indicator for the following reasons: - A pure volume indicator has more power to contradict. - The number of buyers or sellers (which is assessed by volume) will be the same, regardless of the price fluctuation. - Price-volume indicators tend to spike excessively at breakouts or breakdowns. This study is an addition to FVE indicator. Indicator plots different-coloured volume bars depending on volatility. You can change long to short in the Input Settings Please, use it only for learning or paper trading. Do not Pine Script®策略由HPotter提供61
Volatility Finite Volume Elements Strategy The FVE is a pure volume indicator. Unlike most of the other indicators (except OBV), price change doesn?t come into the equation for the FVE (price is not multiplied by volume), but is only used to determine whether money is flowing in or out of the stock. This is contrary to the current trend in the design of modern money flow indicators. The author decided against a price-volume indicator for the following reasons: - A pure volume indicator has more power to contradict. - The number of buyers or sellers (which is assessed by volume) will be the same, regardless of the price fluctuation. - Price-volume indicators tend to spike excessively at breakouts or breakdowns. This study is an addition to FVE indicator. Indicator plots different-coloured volume bars depending on volatility.Pine Script®指標由HPotter提供38
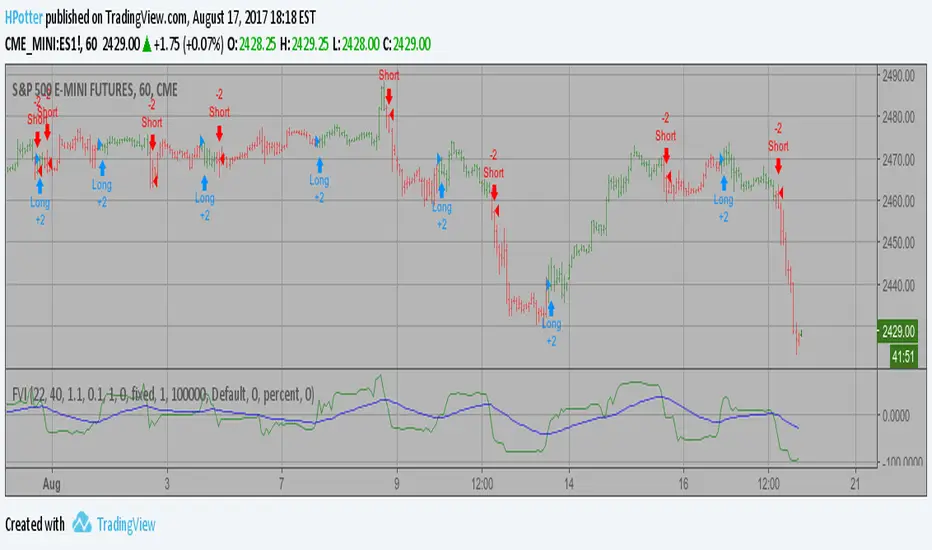
Volatility Finite Volume Elements Backtest This version has an important enhancement to the previous one that`s especially useful with intraday minute charts. Due to the volatility had not been taken into account to avoid the extra complication in the formula, the previous formula has some drawbacks: The main drawback is that the constant cutoff coefficient will overestimate price changes in minute charts and underestimate corresponding changes in weekly or monthly charts. And now the indicator uses adaptive cutoff coefficient which will adjust to all time frames automatically. You can change long to short in the Input Settings Please, use it only for learning or paper trading. Do not for real trading.Pine Script®策略由HPotter提供106
Volatility Finite Volume Elements Strategy This version has an important enhancement to the previous one that`s especially useful with intraday minute charts. Due to the volatility had not been taken into account to avoid the extra complication in the formula, the previous formula has some drawbacks: The main drawback is that the constant cutoff coefficient will overestimate price changes in minute charts and underestimate corresponding changes in weekly or monthly charts. And now the indicator uses adaptive cutoff coefficient which will adjust to all time frames automatically. WARNING: This script to change bars colors.Pine Script®指標由HPotter提供50