RSI OverTrend Strategy (by Marcoweb) v1.0Hi guys, just adapted the CCI Level zero Strategy with the Over Bought and Over Sold levels provided by the Relative Strength Index. The strat is opening a long position at RSI Oversold 30 Level closing it at RSI Overbought 70 Level flipping the position.
Enjoy :D
Strategy

Carpe Diem [Strategy]Carpe Diem Strategy, a wave cycle strategy that only enters when markets are up trending.
The script uses 3 different trend detection indicators including volume which helps with confirmation.
This script has 10 variations built within it which are fitted for the coins differnt coinditions
The coins included are
BTC/USDT 4H
ETH/USDT 4H
LTC/USDT 4H
ADA/USDT 4H
BNB/USDT 2H
BAND/USDT 4H
BAT/USDT 3H
OGN/USDT 4H
ZIL/USDT 4H
BZRX/USDT 2H
How to use the Indicator
You can change what plots are shown in the settings Cog
When the wave lines are green, the market is up trending and will be looking for a trade whereas when they are red, the market is in a sideways or downtrend.
The buy signal is given by the fast wave either crossing over the slow wave line, or crossing over the value of 25.
The exit signal is when the wave crosses back under the 75 value
This strategy includes Fees and there is NO Repaint. The script is written in version 4
There is an option in the settings cog to choose from 10 Coins and timeframes which the Strategies have been optimised for.
There is also another option in the settings cog to change the backtesting range.
There is also another option to adjust the stop loss. I have left it on the Default value which I believe works best
This strategy performs best on the Binance listings

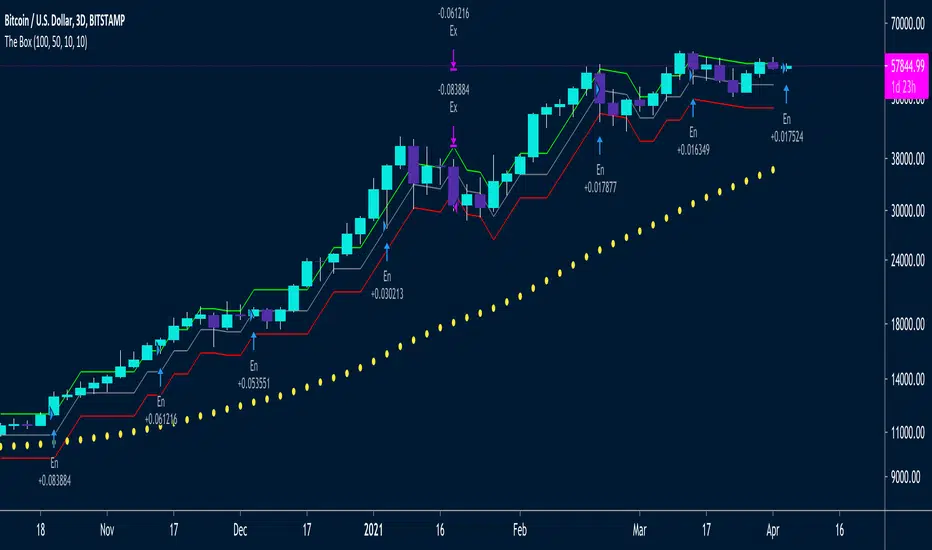
The Box Percent StratHi guys,
Version Zero (more work needed) of an idea I've been meaning to out into a strategy for a while. 🤯
This uses percent boxes🤔 instead of traditional indicators like RSI, MACD etc. 🤫
Takes the first close price of the series and creates a Top Band 10% up, buys if price reaches that level, and puts a stop on a Bot Band, 10% down
When the first trade is in profit by another 10%, it enters another trade and moves the stop of the first trade to breakeven ~ this way it only has one unit of risk at a time
/// Designed for LONG only on Daily, 2D or 3D Charts👌🏻
/// Uses fixed investment risk amount, meaning you're willing to lose that amount per trade
/// Limit buy to not overpay on entries
/// Idea Based on the Darvas system:
/// System only enters trades on strength, when prices equals of exceeds the green line
/// It ads onto the trades, but only *IF* the previous trade is in profit by the UpBoxSize percent size
/// The trailing stop loss is moved up, with the red line
/// A key idea is to only take one unit of risk at a time, meaning for a new add on trade to be taken, the previous trade should be in profit by the same box size as the new new trade's stop loss
/// This will keep adding trades again and again, and they will stop out at the same stop loss
/// Yellow Circles is an MA that filters out choppy areas -- this system only does really well on trending linear markets like: TQQQ, SSO, SPX, SPY
/// Base setting is 10% UpBox Size and 10% DnBox Size: 15% & 15% will be more accurate but fewer signals. 13% profit and 10% stop loss will give a higher risk to reward ratio
Trend Surfers - Premium Breakout + AlertsTrend Surfers - Premium Breakout Strategy with Alerts
I am happy today to release the first free Trend Surfers complete Breakout Strategy!
The strategy includes:
Entry for Long and Short
Stoploss
Position Size
Exit Signal
Risk Management Feature
How the strategy works
This is a Trend Following strategy. The strategy will have drawdowns, but they will be way smaller than what you would go through with buy and old.
As a Trend Following strategy, we will buy on strength, when a breakout occurs. And sell on weakness.
The strategy includes a FIX Stoploss determined by an ATR multiple and a trailing Stoploss/Takeprofit also determined by an ATR multiple.
You can also manage your risk by entering the maximum % you are willing to risk on every trade. Additionally, there is an option to enter how many pairs you will be trading with the strategy. This will change your position size in order to make sure that you have enough funds to trade all your favorite pairs.
Use the strategy with alerts
This strategy is alert-ready. All you have to do is:
Go on a pair you would like to trade
Create an alert
Select the strategy as a Trigger
Wait for new orders to be sent to you
Every Entry (Long/Short) will include:
Market Entry (Enter position NOW!)
Stoploss price
Position Size
Leverage
* If you do not wish to use leverage, you can multiply the Position Size by the Leverage. But doing that, you might end up with a position greater than your equity. Trading on Futures is better in order to have accurate risk management.
Exit signals:
When you receive an exit signal, you need to close the position ASAP. If you want to keep your results as close as possible to the backtest results, you need to execute quickly and follow what the strategy is telling you.
Do not try to outsmart the strategy
Leave your emotion out of trading! If you trust the strategy, you will have way better returns than if you try to outsmart it. Follow each signal you receive even if it doesn't seem logical at the moment.
Become a machine that executes. Don't look at fundamentals. Follow the trend! Trust the strategy!
I hope you enjoy it!

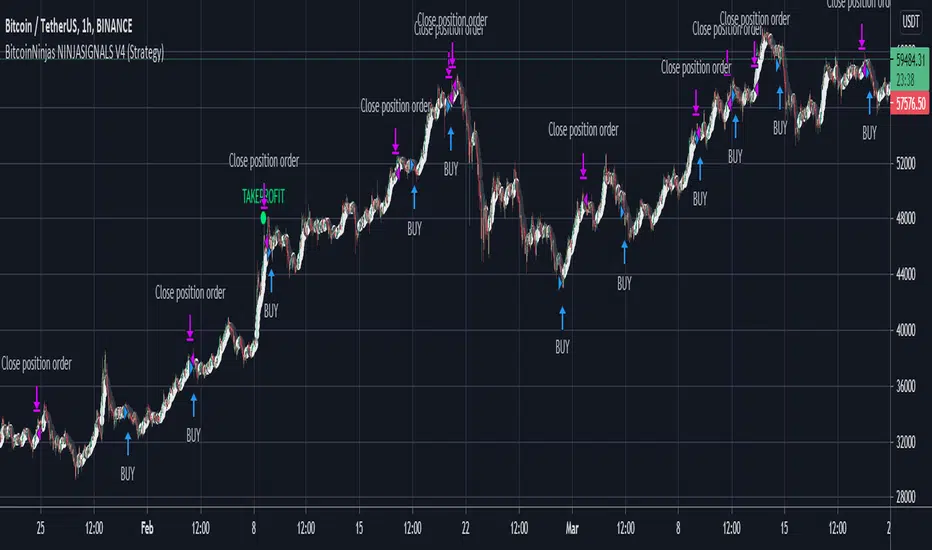
BitcoinNinjas NINJASIGNALS V4 (Strategy)BitcoinNinjas NINJASIGNALS V4 (Strategy)
(for Cryptocurrencies, Forex, GunBot, ProfitTrailer, Autoview, CryptoHopper, manual or automated trading, and more)
This is version 4 of our Ninja Signals trading script, with accompanying backtesting strategy.
BitcoinNinjas NINJASIGNALS V4 (Script)
•Allows users to easily set automated buy/long and sell/short alerts on TradingView for use with automatic and manual trading of cryptocurrencies, Forex securities, and more (alerts are compatible with automatic trading software such as GunBot, ProfitTrailer, Autoview, CryptoHopper, and more).
•Synthesizes many powerful indicators [e.g., Relative Strength Index (RSI), Stochastic RSI, Money Flow Index (MFI), Moving Average Convergence Divergence (MACD), etc.) into one powerful script to generate very precise buy and sell signals in virtually all market conditions.
•Features user-defined adjustable calibration settings, allowing traders to customize the script to fit any currency / security on any exchange available through TradingView.com, simply by adjusting settings.
•Buy/Long arrows, Sell/Short arrows, & EMA trendline can be customized or hidden, if desired.
•Complete with backtesting strategy version of script which allows users to test various trading strategies based on the alerts the script generates (see information and screenshots below).
•Backtesting strategy features a user-defined adjustable date range, so traders can estimate performance of the script over specific periods of time, such as the last week, month, or year.
•Script and backtesting strategy feature many user-adjustable settings including stop loss and take profit alerts, an ‘only sell for profit’ option (Gunbot-specific), many different buy and sell filters, and more. Simply adjust the script settings and the backtesting results will automatically refresh.
•Backtesting strategy allows for pyramid buying to test various average down / dollar cost average trading strategies. Simply adjust the number of pyramid buys and the quantity of each buy.
•Fully compatible with margin and futures trading for any currency / security on TradingView.com.
DISCLAIMER: By using our BitcoinNinjas ‘Ninja Signals’ planning script, you agree to the BitcoinNinjas 'Terms of Use'. No sharing, copying, reselling, modifying, or any other forms of use are authorized for our documents, script / strategy, and the information published with them. This informational planning script / strategy is strictly for individual use and educational purposes only. This is not financial or investment advice. Investments are always made at your own risk and are based on your personal judgement. BitcoinNinjas is not responsible for any losses you may incur. Please invest wisely.
MACD BTC Long/Short Strategy v1.0This strategy will use only default MACD with Simple MA(Signal Line) mode 'ON' to determine when it's time to long/short using its histogram value.
Current version has 2 more entries added to increase more trades and profits along the way while maintaining low 'max drawdown' and high returns.
Entry will be opened when macd line(blue) crossed with signal line(red).
Entry will be closed when histogram increased/decreased opposite its previous histogram.
Re-enter will opened a position when histogram continues after X delay (Re-enter Delay setting).
Sculp will opened a position when histogram is still in light colors for X delay (Sculp Delay setting).

Bollinger Bands Trending Reverse StrategyWelcome to yet another script. This script was a lot easier since I was stuck for so long on the Donchian Channels one and learned so much from that one that I could use in this one.
This code should be a lot cleaner compared to the Donchian Channels, but we'll leave that up to the pro's.
This strategy has two entry signals, long = when price hits lower band, while above EMA, previous candle was bearish and current candle is bullish.
Short = when price hits upper band, while below EMA, previous candle was bullish and current candle is bearish.
Take profits are the opposite side's band(lower band for long signals, upper band for short signals). This means our take profit price will change per bar.
Our stop loss doesn't change, it's the difference between entry price and the take profit target divided by the input risk reward.

Dankland Playground DCAing multi-strategy OPThis is essentially a script that I made for myself before deciding it may be good enough for you all as well.
How it works basically is this... you have 18 oscillators which can all be used as independently as you wish. That means there are 20 groups which they can be split amongst as you choose.
When in separate groups they should not be able to sell eachothers positions without triggering a stop loss. Every single oscillator has its own position sizing and exit sizing which can be stated as either a percent of balance or a flat amount of contracts. Each oscillator has a minimum amount of profit you can tell it to sell it, which is calculated from the average cost of your current position, which does include all groups. This works out to help you average out better entry and exit prices, essentially a method of DCAing.
You can set the minimum sale amount, which is to keep it from placing orders below your exchanges minimum dollar trade cost.
The included oscillators are as follows:
Chande Momentum cross
Moving Average Cross
MACD cross
%B Bollinger cross
Stochastic cross + region filter
Stochastic RSI cross + region filter
SMII cross and region
Three RMIs
Standard RSI
LSMA-smoothed RSI
Know Sure Thing
RSI of KST
Coppock Curve
RSI of Curve
PPO
RSI of PPO
Trix
RSI of Trix
So the idea is that this is essentially multiple strategies combined into one backtestable house. Balance is calculated for all position sizes in order to try to prevent false entries that plague so many scripts (IE, you set pyramiding to 2, each buy $1000, initial balance $1000, and yet it buys two orders off the bat for $2000 total and nets 400% profit because the second was considered free)/
You tune each side and position size them so that they work together as well as you can and in doing so you are able to create a single backtest that is capable of running a bot, essentially, between multiple strategies - you can run a slower Moving Average cross, a faster SMI cross or MACD, or Bollinger that grabs big moves only, all the while having MACD trade small bonuses along the way. This way you can weight the Risk to Reward of each against eachother.
I will not try to claim this is something you can open and with no work have the best bot on the planet. This scripts intention is to take a lot of relatively common trading strategies and combine them under on roof with some risk management and the ability to weigh each against eachother.
If you are looking for a super advanced singular algorithm that tries to capture every peak and valley exactly on the dot, this is not for you. If you are looking for a tool with a high level of customizability, with a publisher who intends to update it to the best of his ability in accordance to seeking to make the best product that I personally can make for both myself and the community (because I will be using this myself of course!) that was specifically designed with the intention of performing well in spot markets by averaging low entry costs and high exit costs, this is for you! That is the exact intention here.
I do not trade margin currently, I trade spot. I am sure this script can be tuned to work on margin but this is not my intention or area so if this is you and there is something you need for margin specifically implemented, ask, because I likely don't know what you need yet.
The current backtest shown is hand-optimized by myself for BTC/USD 1hr market with NO stop loss enabled and all sales weighed to be around 0% minimum profit from the total average entry cost.
I chose to run it myself with no stop losses because Bitcoin is so bullish to me. The stop losses can still be very profitable, but not 1495% net profit. This style of automation is not for everyone as when running with no stop loss and the requirement every sale is somewhat profitable, or at least no very noticeable loss, you wind up relying on yourself to manually stop out if things crash too much and the bot has to stop trading to wait for market to go back up. The thing to do here if you are playing without a stop loss is to have your own alerts set at your fear level, a % drop in a period of time or something like that, and when you reach that point I would consider resetting the bot so it continues to take trades. I personally will accept a temporary drop in USD as long as I can keep my BTC holdings up overall as the goal should always be to have as many BTC as possible by the start and end of the bull run.

Volume AdvancedI have found out this script some time ago. In fact it is not my code (just have modified a little) and I don't know the author (couldn't find). So now I would like to share with the community, maybe somebody would have some idea how to make it better. The script itself is modified volatility oscillator (like ATR) based on volume, making a deal at the moment of price change. To recognize the current trend I have add simple function just to compare the current price with the N bars before, because sometimes in moments of high volatility there may be wrong signals.
HatiKO Envelopes v3Published source code is subject to the terms of the GNU Affero General Public License v3.0
Old flaws have been resolved.
This script describes and provides backtesting functionality to internal strategy of algorithmic crypto trading software "HatiKO bot".
Suitable for backtesting any Cryptocurrency Pair on any Exchange/Platform, any Timeframe.
Core Mechanics of this strategy are based on theory of price always returning to Moving Average + Envelopes indicator (Moving_average_envelope from Wiki)
Developement of this script and trading software is inspired by:
"Essential Technical Analysis: Tools and Techniques to Spot Market Trends" by Leigh Stevens (published on 12th of April 2002)
"Moving Average Envelopes" by ChartSchool, StockCharts platform (published on 13th of April 2015 or earlier)
"Коля Колеснік" from Crypto Times channel ("Метод сетка", published on 19th of August 2018)
"3 ways to use Moving Average Envelopes" by Rich Fitton, published on Trader's Nest (published on 28st of November 2018 or earlier)
noro's "Robot WhiteBox ShiftMA" strategy v1 script, published on TradingView platform (published on 29th of August 2018)
"Moving Average Envelopes: A Popular Trading Tool" Investopedia article (published 25th of June 2019)
and KROOL1980's blogpost on Argolabs ("Гридерство или Сетка как источник прибыли на форекс", published on 27th of February 2015)
Core Features:
1) Up to 9 Envelopes in each direction (Long/Short)
2) Use any of 6 different basis MAs, optionally use different MAs for Opening and Closure
3) Use different Timeframes for MA calculation, without any repainting and lookahead bias.
4) Fixed order size, not Martingale strategy
5) Close open position earlier by using Deviation parameter
6) PineScript v4 code
7) Anti-Spire (protection against situations like LTCUSD (Bitmex) 12/26/2020)
9) Lottery for each level
10) Total profit for the day. When activated, a histogram is drawn.
Options description:
Lot - % from your initial balance to use for order size calculation
Timeframe Short - Timeframe to use for Short Opening MA calculation, can be chosen from dropdown list, default is Current Graph Timeframe
MA Type Short - Type of MA to use for Short Opening MA calculation, can be chosen from dropdown list, default is SMA
Data Short - Source of Price for Short Opening MA calculation, can be chosen from dropdown list, default is OHLC4
MA Length Short - Period used for Short Opening MA calculation, should be >=1, default is 3
MA offset Short - Offset for MA value used for Short Envelopes calculation, should be >= 0, default is 0
Timeframe Long - Timeframe to use for Long Opening MA calculation, can be chosen from dropdown list, default is Current Graph Timeframe
MA Type Long - Type of MA to use for Long Opening MA calculation, can be chosen from dropdown list, default is SMA
Data Long - Source of Price for Long Opening MA calculation, can be chosen from dropdown list, default is OHLC4
MA Length Long - Period used for Long Opening MA calculation, should be >=1, default is 3
MA offset Long - Offset for MA value used for Long Envelopes calculation, should be >= 0, default is 0
Mode close MA Short - Enable different MA for Short position Closure, default is "false". If false, Closure MA = Opening MA
Timeframe Short Close - Timeframe to use for Short Position Closure MA calculation, can be chosen from dropdown list, default is Current Graph Timeframe
MA Type Close Short - Type of MA to use for Short Position Closure MA calculation, can be chosen from dropdown list, default is SMA
Data Short Close - Source of Price for Short Closure MA calculation, can be chosen from dropdown list, default is OHLC4
MA Length Short Close - Period used for Short Opening MA calculation, should be >=1, default is 3
Short Deviation - % to move from MA value, used to close position above or beyond MA, can be negative, default is 0
MA offset Short Close - Offset for MA value used for Short Position Closure calculation, should be >= 0, default is 0
Mode close MA Long - Enable different MA for Long position Closure, default is "false". If false, Closure MA = Opening MA
Timeframe Long Close - Timeframe to use for Long Position Closure MA calculation, can be chosen from dropdown list, default is Current Graph Timeframe
MA Type Close Long - Type of MA to use for Long Position Closure MA calculation, can be chosen from dropdown list, default is SMA
Data Long Close - Source of Price for Long Closure MA calculation, can be chosen from dropdown list, default is OHLC4
MA Length Long Close - Period used for Long Opening MA calculation, should be >=1, default is 3
Long Deviation - % to move from MA value, used to close position above or beyond MA, can be negative, default is 0
MA offset Long Close - Offset for MA value used for Long Position Closure calculation, should be >= 0, default is 0
Short 1..9 - % from MA value to put Envelopes at, for Shorts numbers should be positive, the higher is number, the higher should be Short n position, example: "Short 1 = 1, Short 2 = 2, etc."
Long 1..9 - % from MA value to put Envelopes at, for Longs numbers should be negative, the lower is number, the lower should be Long n position, example: "Long 1 = -1, Long 2 = -2, etc."
Graph notes:
Green lines - Long Envelopes .
Red lines - Short Envelopes .
Orange line - MA for closing of Short positions.
Lime line - MA for closing of Long positions.
Histogram - Profit for the last day. Black = 0, Green> 0, Red <0.
Old flaws have been resolved.
At the moment, there is one bug - if the closing and opening occurs on the same candle, then there is no close on the same candle. The situation is possible with small values of Envelope.
**************************************************************************************************************************************************************************************************************
Опубликованный исходный код регулируется Условиями Стандартной Общественной Лицензии GNU Affero v3.0
Старые недоработки были решены.
Этот скрипт описывает и предоставляет функции бектеста для внутренней стратегии алгоритмического программного обеспечения "HatiKO bot".
Подходит для тестирования любой криптовалютной пары на любой бирже/платформе, на любом таймфрейме.
Кор-механика этой стратегии основана на теории всегда возвращающейся к значению МА цены с использованием индикатора Envelopes (Moving_average_envelope from Wiki)
Разработка этого скрипта и программного обеспечения для торговли вдохновлена следующими источниками:
Книга "Essential Technical Analysis: Tools and Techniques to Spot Market Trends" Ли Стивенса (опубликовано 12 апреля 2002 года)
«Moving Average Envelopes» от ChartSchool, платформа StockCharts (опубликовано 13 апреля 2015 года или раньше)
«Коля Колеснік» с канала Crypto Times («Метод сетка», опубликовано 19 августа 2018 года)
«Moving Average Envelopes: A Popular Trading Tool», статья Investopedia (опубликовано 25 июня 2019 года)
Блог KROOL1980 из Argolabs («Гридерство или Сетка как источник прибыли на форекс», опубликовано 27 февраля 2015 года)
Основные особенности:
1) До 9-х Ордеров в каждом из направлении (Лонг / Шорт)
2) Выбор из 6-ти разных базовых МА, опционально используйте разные МА для открытия и закрытия.
3) Используйте разные таймфреймы для расчета MA, без перерисовки и "эффекта стеклянного шара".
4) Фиксированный размер ордера, а не стратегия Мартингейла
5) Возможность закрытия открытой позиции заблаговременно, используя параметр Deviation
6) Код реализован на PineScript v4
7) Антишпиль ( защита от ситуаций типа LTCUSD ( Bitmex ) 26.12.2020 )
9) Лотность для каждого уровня
10) Суммарный профит за день. При активации рисуется гистограмма.
Описание параметров:
Lot - % от вашего первоначального баланса, используется при расчете размера Ордера
Timeframe Short - таймфрейм, используемый для расчета МА Открытия Шорт позиций, может быть выбран из списка, по умолчанию - таймфрейм текущего графика
MA Type Short - тип MA, используемый для расчета МА Открытия Шорт позиций, может быть выбран из списка, по умолчанию SMA
Data Short - источник цены для расчета МА Открытия Шорт позиций, может быть выбран из списка, по умолчанию OHLC4
MA Length Short - период, используемый для расчета МА Открытия Шорт позиций, должен быть >= 1, по умолчанию 3
MA Offset Short - смещение значения MA, используемого для расчета Шорт Ордеров, должно быть >= 0, по умолчанию 0
Timeframe Long - таймфрейм, используемый для расчета МА Открытия Лонг позиций, может быть выбран из списка, по умолчанию - таймфрейм текущего графика
MA Type Long - тип MA, используемый для расчета МА Открытия Лонг позиций, может быть выбран из списка, по умолчанию SMA
Data Long - источник цены для расчета МА Открытия Лонг позиций, может быть выбран из списка, по умолчанию OHLC4
MA Length Long - период, используемый для расчета МА Открытия Лонг позиций, должен быть >= 1, по умолчанию 3
MA Offset Long - смещение значения MA, используемого для расчета Лонг Ордеров, должно быть >= 0, по умолчанию 0
Mode close MA Short - Включает отдельное MA для закрытия Шорт позиции, по умолчанию «false». Если false, MA Закрытия = MA Открытия
Timeframe Short Close - таймфрейм, используемый для расчета МА Закрытия Шорт позиций, может быть выбран из списка, по умолчанию - таймфрейм текущего графика
MA Type Close Short - тип MA, используемый при расчете МА Закрытия Шорт позиции. Mожно выбрать из списка, по умолчанию SMA
Data Short Close - источник цены для расчета МА Закрытия Шорт позиций, может быть выбран из списка, по умолчанию OHLC4
MA Length Short Close - период, используемый для расчета МА Закрытия Шорт позиции, должен быть >= 1, по умолчанию 3
Short Deviation - % отклонения от значения MA, используется для закрытия позиции выше или ниже рассчитанного значения MA, может быть отрицательным, по умолчанию 0
MA Offset Short Close - смещение значения MA, используемого для расчета закрытия Шорт позиции, должно быть >= 0, по умолчанию 0
Mode close MA Long - Включает разные MA для закрытия Лонг позиции, по умолчанию «false». Если false, MA Закрытия = MA Открытия
Timeframe Long Close - таймфрейм, используемый для расчета МА Закрытия Лонг позиций, может быть выбран из списка, по умолчанию - таймфрейм текущего графика
MA Type Close Long - тип MA, используемый при расчете МА Закрытия Лонг позиции. Mожно выбрать из списка, по умолчанию SMA
Data Long Close - источник цены для расчета МА Закрытия Лонг позиций, может быть выбран из списка, по умолчанию OHLC4
MA Length Long Close - период, используемый для расчета МА Закрытия Лонг позиции, должен быть >= 1, по умолчанию 3
Long Deviation -% для перехода от значения MA, используется для закрытия позиции выше или ниже рассчитанного значения MA, может быть отрицательным, по умолчанию 0
MA Offset Long Close - смещение значения MA, используемого для расчета закрытия Лонг позиции, должно быть >= 0, по умолчанию 0
Short 1..9 - % от значения MA для размещения Ордеров, для Шорт Ордеров должен быть положительным, чем выше номер, тем выше должна располагаться позиция Short n, например: « Short 1 = 1, Short 2 = 2 и т.д. "
Long 1..9 - % от значения MA для размещения Ордеров, для Лонг Ордеров должно быть отрицательным, чем ниже число, тем ниже должна располагаться позиция Long n, например: « Long 1 = -1, Long 2 = -2, и т.д."
Пояснения к графику:
Зеленые линии - Лонг Ордера.
Красные линии - Шорт Ордера.
Оранжевая линия - MA Закрытия Шорт позиций.
Лаймовая линия - MA Закрытия Лонг позиций.
Гистограмма - Профит за последние сутки.Черная = 0, Зеленая > 0, красная < 0.
Старые недоработки были решены.
На данный момент есть один баг - если закрытие и открытие происходит на одной свече, то на этой же свече нет закрытия. Ситуация возможна при небольших значениях Envelope.
Published source code is subject to the terms of the GNU Affero General Public License v3.0
Old flaws have been resolved.
This script describes and provides backtesting functionality to internal strategy of algorithmic crypto trading software "HatiKO bot".
Suitable for backtesting any Cryptocurrency Pair on any Exchange/Platform, any Timeframe.
Core Mechanics of this strategy are based on theory of price always returning to Moving Average + Envelopes indicator (Moving_average_envelope from Wiki)
Developement of this script and trading software is inspired by:
"Essential Technical Analysis: Tools and Techniques to Spot Market Trends" by Leigh Stevens (published on 12th of April 2002)
"Moving Average Envelopes" by ChartSchool, StockCharts platform (published on 13th of April 2015 or earlier)
"Коля Колеснік" from Crypto Times channel ("Метод сетка", published on 19th of August 2018)
"3 ways to use Moving Average Envelopes" by Rich Fitton, published on Trader's Nest (published on 28st of November 2018 or earlier)
noro's "Robot WhiteBox ShiftMA" strategy v1 script, published on TradingView platform (published on 29th of August 2018)
"Moving Average Envelopes: A Popular Trading Tool" Investopedia article (published 25th of June 2019)
and KROOL1980's blogpost on Argolabs ("Гридерство или Сетка как источник прибыли на форекс", published on 27th of February 2015)
Core Features:
1) Up to 9 Envelopes in each direction (Long/Short)
2) Use any of 6 different basis MAs, optionally use different MAs for Opening and Closure
3) Use different Timeframes for MA calculation, without any repainting and lookahead bias.
4) Fixed order size, not Martingale strategy
5) Close open position earlier by using Deviation parameter
6) PineScript v4 code
7) Anti-Spire (protection against situations like LTCUSD (Bitmex) 12/26/2020)
9) Lottery for each level
10) Total profit for the day. When activated, a histogram is drawn.
Options description:
Lot - % from your initial balance to use for order size calculation
Timeframe Short - Timeframe to use for Short Opening MA calculation, can be chosen from dropdown list, default is Current Graph Timeframe
MA Type Short - Type of MA to use for Short Opening MA calculation, can be chosen from dropdown list, default is SMA
Data Short - Source of Price for Short Opening MA calculation, can be chosen from dropdown list, default is OHLC4
MA Length Short - Period used for Short Opening MA calculation, should be >=1, default is 3
MA offset Short - Offset for MA value used for Short Envelopes calculation, should be >= 0, default is 0
Timeframe Long - Timeframe to use for Long Opening MA calculation, can be chosen from dropdown list, default is Current Graph Timeframe
MA Type Long - Type of MA to use for Long Opening MA calculation, can be chosen from dropdown list, default is SMA
Data Long - Source of Price for Long Opening MA calculation, can be chosen from dropdown list, default is OHLC4
MA Length Long - Period used for Long Opening MA calculation, should be >=1, default is 3
MA offset Long - Offset for MA value used for Long Envelopes calculation, should be >= 0, default is 0
Mode close MA Short - Enable different MA for Short position Closure, default is "false". If false, Closure MA = Opening MA
Timeframe Short Close - Timeframe to use for Short Position Closure MA calculation, can be chosen from dropdown list, default is Current Graph Timeframe
MA Type Close Short - Type of MA to use for Short Position Closure MA calculation, can be chosen from dropdown list, default is SMA
Data Short Close - Source of Price for Short Closure MA calculation, can be chosen from dropdown list, default is OHLC4
MA Length Short Close - Period used for Short Opening MA calculation, should be >=1, default is 3
Short Deviation - % to move from MA value, used to close position above or beyond MA, can be negative, default is 0
MA offset Short Close - Offset for MA value used for Short Position Closure calculation, should be >= 0, default is 0
Mode close MA Long - Enable different MA for Long position Closure, default is "false". If false, Closure MA = Opening MA
Timeframe Long Close - Timeframe to use for Long Position Closure MA calculation, can be chosen from dropdown list, default is Current Graph Timeframe
MA Type Close Long - Type of MA to use for Long Position Closure MA calculation, can be chosen from dropdown list, default is SMA
Data Long Close - Source of Price for Long Closure MA calculation, can be chosen from dropdown list, default is OHLC4
MA Length Long Close - Period used for Long Opening MA calculation, should be >=1, default is 3
Long Deviation - % to move from MA value, used to close position above or beyond MA, can be negative, default is 0
MA offset Long Close - Offset for MA value used for Long Position Closure calculation, should be >= 0, default is 0
Short 1..9 - % from MA value to put Envelopes at, for Shorts numbers should be positive, the higher is number, the higher should be Short n position, example: "Short 1 = 1, Short 2 = 2, etc."
Long 1..9 - % from MA value to put Envelopes at, for Longs numbers should be negative, the lower is number, the lower should be Long n position, example: "Long 1 = -1, Long 2 = -2, etc."
Graph notes:
Green lines - Long Envelopes .
Red lines - Short Envelopes .
Orange line - MA for closing of Short positions.
Lime line - MA for closing of Long positions.
Histogram - Profit for the last day. Black = 0, Green> 0, Red <0.
Old flaws have been resolved.
At the moment, there is one bug - if the closing and opening occurs on the same candle, then there is no close on the same candle. The situation is possible with small values of Envelope.
**************************************************************************************************************************************************************************************************************
Опубликованный исходный код регулируется Условиями Стандартной Общественной Лицензии GNU Affero v3.0
Старые недоработки были решены.
Этот скрипт описывает и предоставляет функции бектеста для внутренней стратегии алгоритмического программного обеспечения "HatiKO bot".
Подходит для тестирования любой криптовалютной пары на любой бирже/платформе, на любом таймфрейме.
Кор-механика этой стратегии основана на теории всегда возвращающейся к значению МА цены с использованием индикатора Envelopes (Moving_average_envelope from Wiki)
Разработка этого скрипта и программного обеспечения для торговли вдохновлена следующими источниками:
Книга "Essential Technical Analysis: Tools and Techniques to Spot Market Trends" Ли Стивенса (опубликовано 12 апреля 2002 года)
«Moving Average Envelopes» от ChartSchool, платформа StockCharts (опубликовано 13 апреля 2015 года или раньше)
«Коля Колеснік» с канала Crypto Times («Метод сетка», опубликовано 19 августа 2018 года)
«Moving Average Envelopes: A Popular Trading Tool», статья Investopedia (опубликовано 25 июня 2019 года)
Блог KROOL1980 из Argolabs («Гридерство или Сетка как источник прибыли на форекс», опубликовано 27 февраля 2015 года)
Основные особенности:
1) До 9-х Ордеров в каждом из направлении (Лонг / Шорт)
2) Выбор из 6-ти разных базовых МА, опционально используйте разные МА для открытия и закрытия.
3) Используйте разные таймфреймы для расчета MA, без перерисовки и "эффекта стеклянного шара".
4) Фиксированный размер ордера, а не стратегия Мартингейла
5) Возможность закрытия открытой позиции заблаговременно, используя параметр Deviation
6) Код реализован на PineScript v4
7) Антишпиль ( защита от ситуаций типа LTCUSD ( Bitmex ) 26.12.2020 )
9) Лотность для каждого уровня
10) Суммарный профит за день. При активации рисуется гистограмма.
Описание параметров:
Lot - % от вашего первоначального баланса, используется при расчете размера Ордера
Timeframe Short - таймфрейм, используемый для расчета МА Открытия Шорт позиций, может быть выбран из списка, по умолчанию - таймфрейм текущего графика
MA Type Short - тип MA, используемый для расчета МА Открытия Шорт позиций, может быть выбран из списка, по умолчанию SMA
Data Short - источник цены для расчета МА Открытия Шорт позиций, может быть выбран из списка, по умолчанию OHLC4
MA Length Short - период, используемый для расчета МА Открытия Шорт позиций, должен быть >= 1, по умолчанию 3
MA Offset Short - смещение значения MA, используемого для расчета Шорт Ордеров, должно быть >= 0, по умолчанию 0
Timeframe Long - таймфрейм, используемый для расчета МА Открытия Лонг позиций, может быть выбран из списка, по умолчанию - таймфрейм текущего графика
MA Type Long - тип MA, используемый для расчета МА Открытия Лонг позиций, может быть выбран из списка, по умолчанию SMA
Data Long - источник цены для расчета МА Открытия Лонг позиций, может быть выбран из списка, по умолчанию OHLC4
MA Length Long - период, используемый для расчета МА Открытия Лонг позиций, должен быть >= 1, по умолчанию 3
MA Offset Long - смещение значения MA, используемого для расчета Лонг Ордеров, должно быть >= 0, по умолчанию 0
Mode close MA Short - Включает отдельное MA для закрытия Шорт позиции, по умолчанию «false». Если false, MA Закрытия = MA Открытия
Timeframe Short Close - таймфрейм, используемый для расчета МА Закрытия Шорт позиций, может быть выбран из списка, по умолчанию - таймфрейм текущего графика
MA Type Close Short - тип MA, используемый при расчете МА Закрытия Шорт позиции. Mожно выбрать из списка, по умолчанию SMA
Data Short Close - источник цены для расчета МА Закрытия Шорт позиций, может быть выбран из списка, по умолчанию OHLC4
MA Length Short Close - период, используемый для расчета МА Закрытия Шорт позиции, должен быть >= 1, по умолчанию 3
Short Deviation - % отклонения от значения MA, используется для закрытия позиции выше или ниже рассчитанного значения MA, может быть отрицательным, по умолчанию 0
MA Offset Short Close - смещение значения MA, используемого для расчета закрытия Шорт позиции, должно быть >= 0, по умолчанию 0
Mode close MA Long - Включает разные MA для закрытия Лонг позиции, по умолчанию «false». Если false, MA Закрытия = MA Открытия
Timeframe Long Close - таймфрейм, используемый для расчета МА Закрытия Лонг позиций, может быть выбран из списка, по умолчанию - таймфрейм текущего графика
MA Type Close Long - тип MA, используемый при расчете МА Закрытия Лонг позиции. Mожно выбрать из списка, по умолчанию SMA
Data Long Close - источник цены для расчета МА Закрытия Лонг позиций, может быть выбран из списка, по умолчанию OHLC4
MA Length Long Close - период, используемый для расчета МА Закрытия Лонг позиции, должен быть >= 1, по умолчанию 3
Long Deviation -% для перехода от значения MA, используется для закрытия позиции выше или ниже рассчитанного значения MA, может быть отрицательным, по умолчанию 0
MA Offset Long Close - смещение значения MA, используемого для расчета закрытия Лонг позиции, должно быть >= 0, по умолчанию 0
Short 1..9 - % от значения MA для размещения Ордеров, для Шорт Ордеров должен быть положительным, чем выше номер, тем выше должна располагаться позиция Short n, например: « Short 1 = 1, Short 2 = 2 и т.д. "
Long 1..9 - % от значения MA для размещения Ордеров, для Лонг Ордеров должно быть отрицательным, чем ниже число, тем ниже должна располагаться позиция Long n, например: « Long 1 = -1, Long 2 = -2, и т.д."
Пояснения к графику:
Зеленые линии - Лонг Ордера.
Красные линии - Шорт Ордера.
Оранжевая линия - MA Закрытия Шорт позиций.
Лаймовая линия - MA Закрытия Лонг позиций.
Гистограмма - Профит за последние сутки.Черная = 0, Зеленая > 0, красная < 0.
Старые недоработки были решены.
На данный момент есть один баг - если закрытие и открытие происходит на одной свече, то на этой же свече нет закрытия. Ситуация возможна при небольших значениях Envelope.

Three moving average strategies
If the short term (Default 7) moving average cuts the medium term (default 25) moving average, BUY. Conversely, it generates the SELL signal. If the long term (Default 99) moving average cuts its short term moving average, Quick SELL. Conversely, it can be interpreted as Fast SELL. You can change the moving average and the number of days as you wish, and you can trade in the short or long term. I hope it was useful.
GG ES Scalp IBTT Momentum Strategy v1.0Script for Scalping the ES. Apply it to a 15 second chart. The Momentum Multiplier is a float input and the lower the number the less conservative the strategy is. It doesn't fire signals everyday but its pretty accurate. Send me a message to get access.
CME_MINI:ES1!

Risk Reduction Ultimate TemplateThis is a template not actually meant for trading. I picked two random oscillators. This is a template meant to turn into a live trading strategy, however.
It's literally just a specialized take profit/stop loss system. It is to ensure your bot doesn't make any bad moves that you wouldn't have manually. The code should be pretty well annotated. Putting this into my scripts has made them much better. I will work on a Multiple Trigger template next.

Strange RSI (sRSI) Backtesting strategyThis is the backtesting strategy module for my Strange RSI (sRSI) oscillator. The main scheme is grounded on setting up a long strategy for RSI crossing above a certain number, and shorting when RSI crosses below a certain number. This module allows you to:
*change these crossing thresholds
*change the Take Profit limits for long and short strategies
*change the RSI length
In this way, you may optimize to the parameters which fit best to your goals.

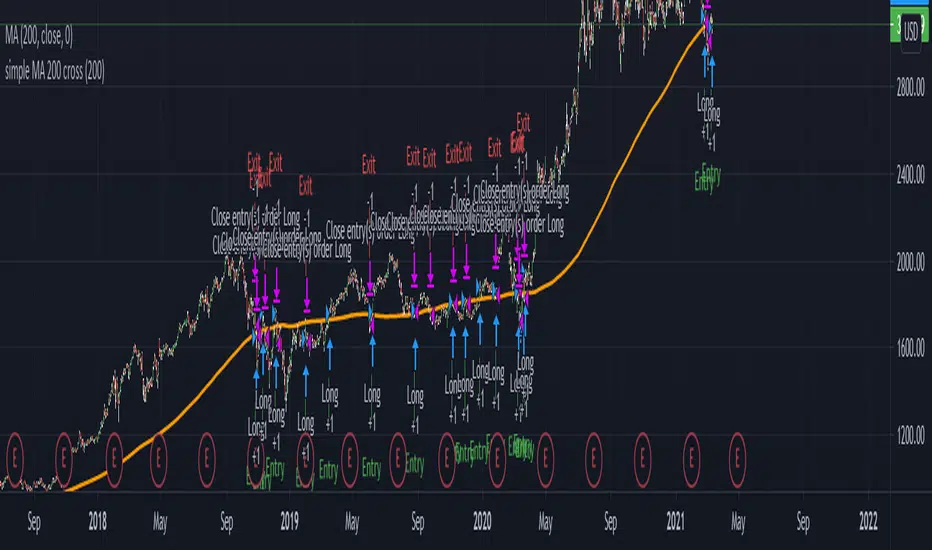
Basic SMA 200 StrategyThe SMA 200 basic strategy will be more than familiar to most traders.
This strategy is to stay with the programming language so to say the "Hello World" of trading.
The SMA 200 basic strategy is also one of the simplest strategies in trading. All that is required is the price and a 200 period moving average. Usually the strategy is used in the daily chart.
The rules are as follows:
Entry: A position is opened when the price crosses the moving average 200 from the bottom to the top.
Exit: The position is closed when the price crosses the moving average from top to bottom.
This is a trend following system and was originally used for trading stocks.
In my opinion, trading with the strategy is recommended to every beginner. There are strategies with better performance, but they are much more complicated to implement. And that's where the big advantage of the strategy can be seen.
Beginners are more than overwhelmed at the beginning of their trading career. Often beginners trade in the 5 min chart with 6 different indicators some signals that they have seen in a Youtube video.
Comparable to a beginner driver who immediately gets into a Porsche as his first car.
Beginners should follow simple rules and avoid intraday charts. Above all, you should do the actual work of a trader.A trader does not just press the mouse twenty times a day and then has easily earned 2000 $. A trader tests systems down to the smallest detail, optimizes and tests again, until he has found an almost " waterproof " trading system. The 200 SMA basic strategy is excellent for gaining experience, learning to follow the rules of a system and not to burn your money right away.
With this script you can test how successful the "simplest strategy in the world" would have been in the past.
Small tip: Do not trade Forex with it it will never work. The strategy is made for long trends and you can find them for example in the stock market.
Have fun with it! About a positive feedback I would be very happy of course.
Flawless Victory Strategy - 15min BTC Machine Learning StrategyHello everyone, I am a heavy Python programmer bringing machine learning to TradingView. This 15 minute Bitcoin Long strategy was created using a machine learning library and 1 year of historical data in Python. Every parameter is hyper optimized to bring you the most profitable buy and sell signals for Bitcoin on the 15min chart. The historical Bitcoin data was gathered from Binance API, in case you want to know the best exchange to use this long strategy. It is a simple Bollinger Band and RSI strategy with two versions included in the tradingview settings. The first version has a Sharpe Ratio of 7.5 which is amazing, and the second version includes the best stop loss and take profit positions with a Sharpe Ratio of 2.5 . Let me talk a little bit more about how the strategy works. The buy signal is triggered when close price is less than lower Bollinger Band at Std Dev 1, and the RSI is greater than a certain value. The sell signal is triggered when close price is greater than upper Bollinger Band at Std Dev 1, and the RSI is greater than a certain value. What makes this strategy interesting is the parameters the Machine Learning library found when backtesting for the best Sharpe Ratio. I left my computer on for about 28 hours to fully backtest 5000 EPOCHS and get the results. I was able to create a great strategy that might be one of TradingView's best strategies out on the website today. I will continue to apply machine learning to all my strategies from here on forward. Please Let me know if you have any questions or certain strategies you would like me to hyper optimize for you. I'm always willing to create profitable strategies!
P.S. You can always pyramid this strategy for more gains! I just don't add pyramiding when creating my strategies because I want to show you the true win/loss ratio based buying one time and one selling one time. I feel like when creating a strategy that includes pyramiding right off the bat falsifies the win rate. This is my way of being transparent with you all. Have fun trading!

RSI Mean Reversion Bot StrategyI started developing this strategy as a way to plug in and test values before defining them in the bots on 3Commas, Coinrule, and Quadency. None of those bots performed the same way my script did and I kept working on it until the strategy finally yielded the same simulated results when paired with the Tradingview bot on Quadency. I looked at all the different RSI strategies already published and saw what each was missing and changed it in mine to make it better:
1. Backtest an actual timeframe by date and time
2. Define the RSI price source
3. Fully manipulate the RSI length
4. Define a stop loss that works
5. Pick Long or Short, or both, based on market conditions. Or compare side by side to decide which you want.

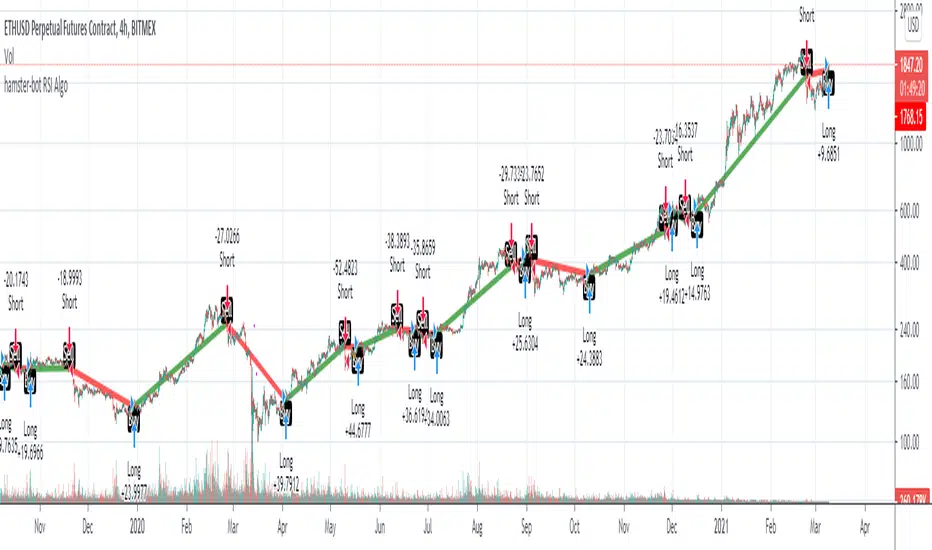
hamster-bot RSI AlgoThis is a simple RSI based signal indicator. It is designed for algorithmic bot trading.
For best results, leave a time-frame of at least 1 hour.
When the RSI reaches 70, it gives a buy signal, and when the RSI reaches 30, it gives a sell signal. The position is then maintained until the opposite signal is given. If backtesting shows poor results, but looks like the opposite would be good, there is a simple switch in the settings to turn it over.
original indicator on the basis of which the strategy is made:
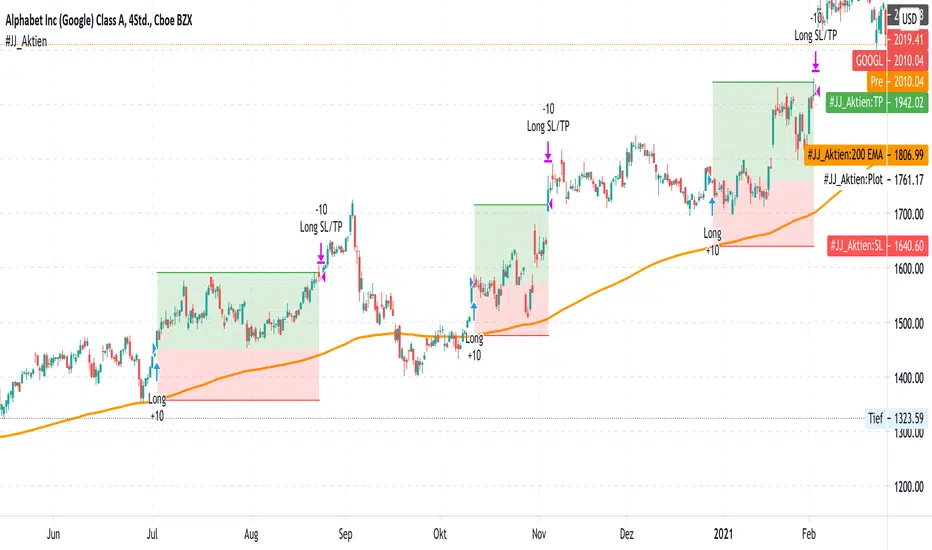
#JJ_Shares Trend Follower
-----------------
Hey there!
There are many reasons why this strategy has worked quite well over the past few years.
A very simple strategy in itself. The basis of this indicator is the trend following approach. "The trend is your friend." This strategy is based on individual separate indicators. A total of three EMA's (10.50 & 200) & the ATR are combined. The largest EMA shows the basic trend direction and thus also the preferred trade direction. The two smaller EMAs are used for the timing of the entrances at the intersection. The stop levels are placed with the help of the ATR and the large EMA. Profit areas are determined using a risk calculation.
Exact entry points can be identified using the indicator. In addition, a take profit is visualized based on a 3:1 CRV . The stop loss results from a long-term EMA .
Example for NASDAQ:GOOGL ! But can be used for all other trend following stocks!
The indicator can be used on all timeframes. However, the performance is significantly better in higher timeframes. In addition, the display can be adjusted using the options.
That's all. Due to the technical chart background, the strategy can be used without further chart analysis.
Attention: Before opening a position, always first check whether there is any strong news. In these cases it is better to be on the safe side.
Attention: With this strategy a SL is provided as standard. However, the risk must always be carefully calculated.
Past results do not guarantee future profits!
Use the link below to get access to this indicator or PM us to get access.
--------------------------------------------------------------------------------------------------------------
--------------------------------------------------------------------------------------------------------------
-----------------
Willkommen!
Es gibt viele Gründe, warum sich diese Strategie in den letzten Jahren ganz gut bewährt hat.
Eine sehr einfache Strategie für sich. Grundlage dieses Indikators ist der Trendfolgeansatz. "The trend is your friend." Diese Strategie basiert auf einzelnen seperaten Indikatoren. Insgesamt werden drei EMA's (10,50 & 200) & die ATR kombiniert. Der größte EMA zeigt die grundsätzliche Trendrichtung und somit auch die bevorzugte Traderichtung. Die beiden kleineren EMA werden bei Kreuzung für das Timing der Einstiege verwendet. Mit Hilfe der ATR und des großen EMA werden die Stop Level platziert. Gewinnzonen werden über eine Risikoberechnung ermittelt.
Anhand des Indikators können genaue Einstiege erkannt werden. Zusätzlich wird aufgrund eines 3:1 CRV ein Take Profit visualisiert. Der Stop Loss ergibt sich über einen langfristigen EMA .
Beispiel für NASDAQ:GOOGL ! Kann aber für alle weiteren Trendfolge Aktien verwendet werden!
Der Indikator kann auf allen Timeframes angewendet werden. Allerdings ist der Performance in höheren Timeframes deutlich besser. Zusätzlich kann die Anzeige über die Optionen angepasst werden.
Das ist alles. Aufgrund des charttechnischen Hintergrunds kann die Strategie ohne weitere Chartanalyse verwendet werden.
Achtung: Vor dem Öffnen einer Position immer zuerst prüfen ob starke News anstehen. In diesen Fällen lieber auf Nummer sicher gehen.
Achtung: Bei dieser Strategie ist standardmäßig ein SL vorgesehen. Das Risiko muss aber immer gut kalkuliert werden.
Vergangene Ergebnisse garantieren keine zukünftigen Gewinne!
Verwenden Sie den folgenden Link, um Zugriff auf diesen Indikator zu erhalten oder schreibe uns eine PM um Zugriff zu erhalten.
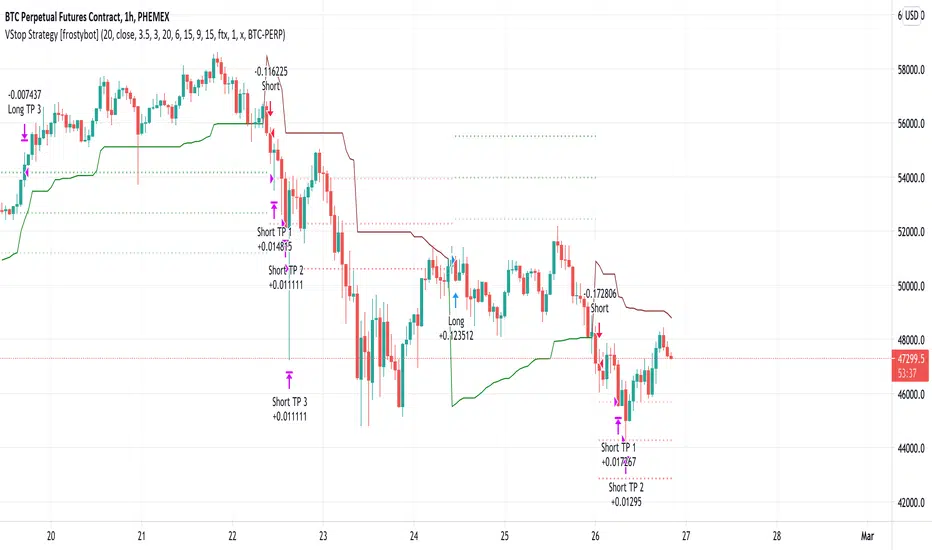
Volatility Stop Strategy [frostybot]This is a modified version of the Standard Volatility Script on TradingView, tweaked for the BTCUSD chart on the 1H timeframe.
I've designed this strategy to be used with Frostybot with ease.
However, this can be disabled in the settings. Then you will receive alerts without Frostybot commands.
First, open the settings section of the indicator. Then fill in the following fields:
You can play around with the TP values and see what works best for your personal risk assessment
Account Stub: enter the name of your stub on Frostybot (only needed if you enable the "Use Frostybot Alert Triggers" checkbox)
Position Size and Size Type: Here you can choose the amount on which you want to enter the trade, for example: 100$, 2x,... (only needed if you enable the "Use Frostybot Alert Triggers" checkbox)
Symbol: Enter the BTC symbol that is valid for the Frostybot Stub's Exchange. For FTX: BTC-PERP, for Binance Futures: BTC /USDT,... (only needed if you enable the "Use Frostybot Alert Triggers" checkbox)
Press OK
Then, setup an alert on the strategy:
Configure the correct Frostybot Webhook URL (don't forget to add /frostybot after the IP address) (only needed if you enable the "Use Frostybot Alert Triggers" checkbox)
Give the alert a name of choice
Put this as the message: {{strategy.order.alert_message}}
Press OK
Enjoy and happy trading!
Williams Alligator + RSI + T3CCIWilliams Alligator strategy is based on indicator developed by a legendary trader Bill Williams, an early pioneer of market psychology.
The strategy is based on a trend-following Alligator indicator, which follows the premise that financial markets and individual securities trend just 15% to 30% of the time while grinding through sideways ranges the other 70% to 85% of the time. Williams believed that individuals and institutions tend to collect most of their profits during strongly trending periods.
Although Alligator is a very strong tool it has a lot of weak signals and has lag span on entries and exits. We added RSI oscillator and T3CCI to clear market noises and weak signals. Moreover the approach we intoduced to the indicator allows to enter positions and close them earlier than orginal indicator which ensures stronger signals
The strategy supports traditional and cryptocurrency spot, futures, options and marginal trading exchanges. It works accurately with BTC, USD, USDT, ETH and BNB quote currencies. Best to use with 1D timeframe charts
The strategy can be and should be configured for each particular asset. You can change filters and risk management settings to receive the most advanced accurate alerts
Advantages of this script:
Good for long and Short positions
Produces strong long-term entries and closures of positions
Stable to short-term market fluctutions
Easy configuration with a user friendly interface
Backtests show high accuracy around 85.71%
High Net Profit percentage around 21.26%
High profit factor around 82.403
How to use?
1. Apply strategy to the trading pair your are interested in at 1D timeframe chart
2. Configure the strategy: change filters values and risk management settings until Strategy tester shows good results according to mathematical expectation
3. Set up a TradingView alert to trigger when strategy conditions are met
4. Strategy will send alerts when to enter and when to exit positions
Feel free to copy and use this script for your ideas and trading!

ATR + %R Scalping StrategyThe Average True Range is a single line indicator that measures volatility. The indicator was originally developed by J. Welles Wilder to measure the volatility of commodities within the futures market.
ATR does not measure price trends or price direction hence %R and Parabolic SAR indicators were added.
The strategy enhances standard Average True Range and %R composition with trend confirmation and filters which clear out market noises and manipulations from triggers.
The strategy supports traditional and cryptocurrency spot, futures, options and marginal trading exchanges. It works accurately with BTC, USD, USDT, ETH and BNB quote currencies. Best to use with 5 and 15 minutes timeframe charts and Limit orders.
The strategy can be and should be configured for each particular asset. You can change filters and risk management settings to receive the most advanced accurate alerts
Advantages of this script:
Strategy has high profit factor around 30.32
Backtests show high accuracy around 91.18%
High Net Profit percentage
Low Drawdowns
Weak signals are filtered
Dynamic Take profit and Stop loss
Fast deals around 50 minutes per trade
Can be applied to any market and quote currency
Easy to configure user interface
How to use?
1. Apply strategy to the trading pair your are interested in at 5m or 15m timeframe chart
2. Configure the strategy: change filters values and risk management settings until Strategy tester shows good results according to mathematical expectation
3. Set up a TradingView alert to trigger when strategy conditions are met
4. Strategy will send alerts when to enter and when to exit positions

Triple EMA StrategyThis is my first ever script so any suggestions, recommendations or improvement ideas welcome!
This strategy is an implementation of a standard three exponential moving averages strategy (defaults: EMA1=5, EMA2=20 and EMA3=50 candles). Trades are executed if EMA1 crosses above/below EMA2 and they are both above/below EMA3. In addition, the close of the current candle must be above/below the previous one by at least the number of ticks you specify in the "buffer" parameter (default 150 ticks). This additional check eliminates many bad trades.
There is also a trailing stoploss which comes into play once the price has gone above/below its initial value which it then follows the price with to ensure the trade closes at the highest possible price.
I find this strategy works best on a 15 minute chart but feel free to play around and fine tune the various parameters. If you find a good setup that returns decent profits, I'd be keen to hear it!
