Absolute Strength MTF IndicatorIntroduction
The non-signal version of the absolute strength indicator from fxcodebase.com requested by ernie76 . This indicator originally from mt4 aim to estimate the bullish/bearish force of the market by using various methods.
The Indicator
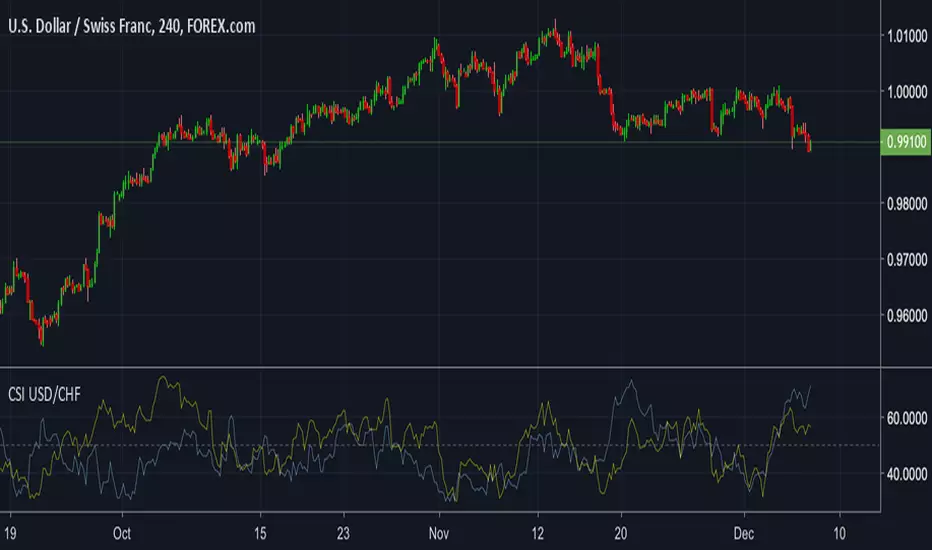
Two lines are plotted, a bull line (blue) representing the bullish/buying force and a bear one (red) representing the bearish/selling force, when the bull line is greater than the bear line the market is considered to be strongly bullish, else strongly bearish.
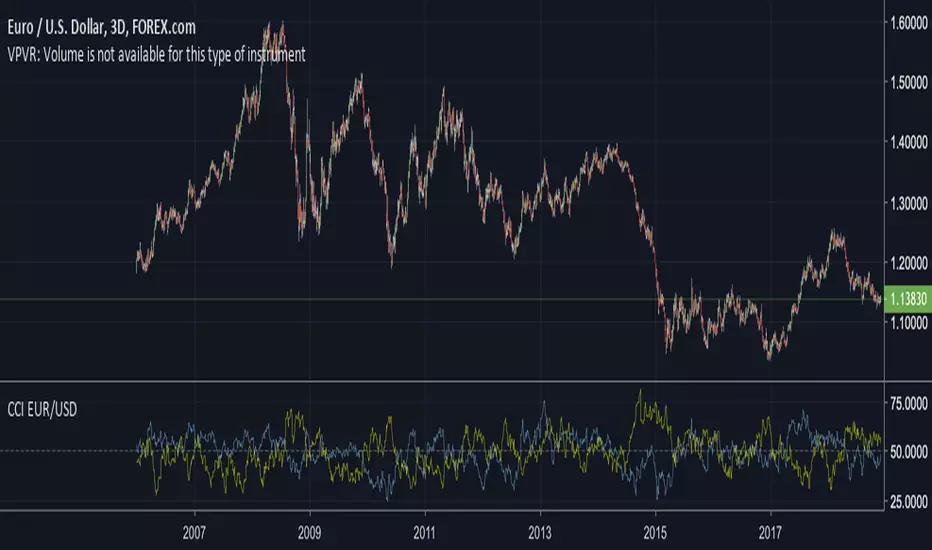
The indicator use various method, Rsi, stochastic, adx. The Rsi method is the one by default.
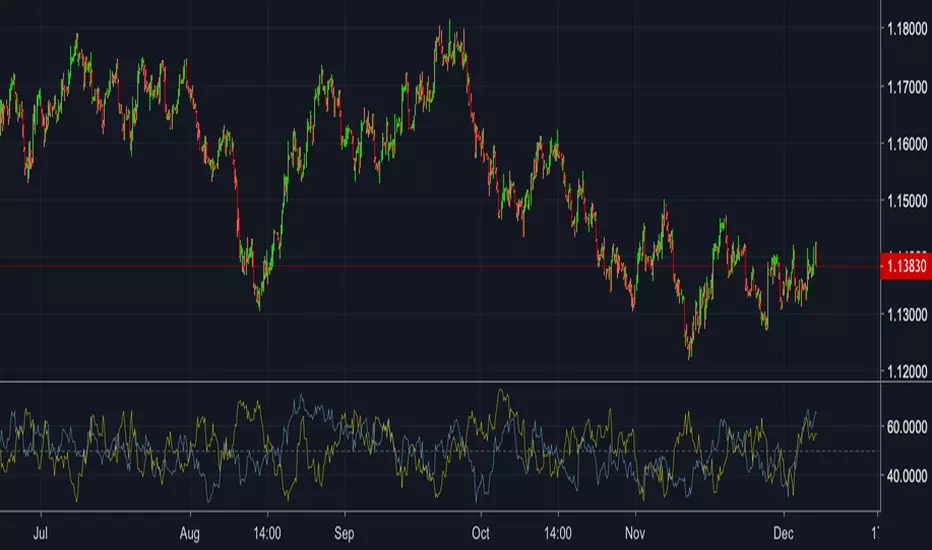
The stochastic method is less reactive but smoother
The Adx method is way different, while the other two methods make the bull and bear lines somewhat uncorrelated, the adx method focus more on the overall market strength than individual buyer/seller strength.
The smoothing method use 3 different filters, SMA, EMA and LSMA, LSMA is more reactive than the two previous one while EMA is just more computer efficient.
It is possible to use price data of different time frames for the calculation of the indicator.
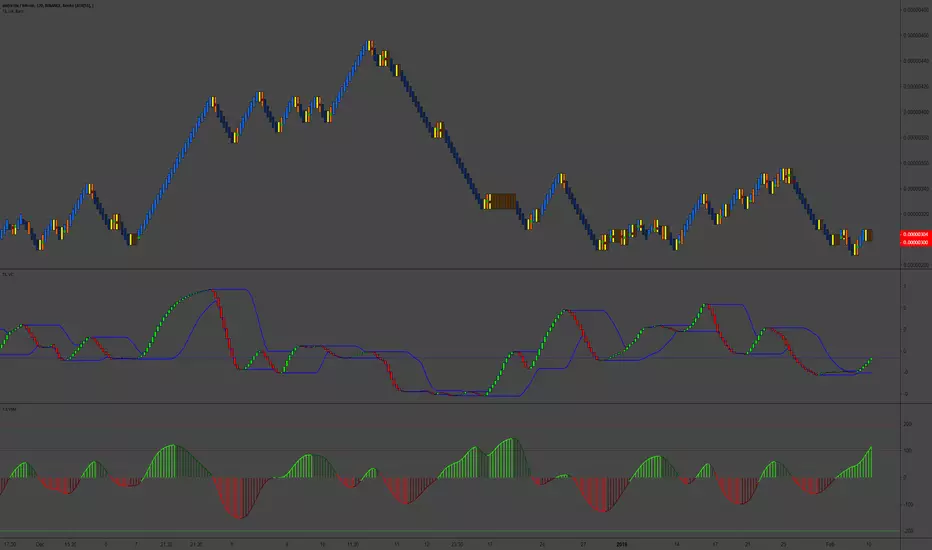
Stochastic method with 4 hour price close as source.
Conclusion
A classic indicator who can be derived into a lot of ways using a more adaptive architecture or recursion. Hope you find it a use :)
A big thanks to ernie76 for the request and the support/testing of the indicator
Feel free to pm me for any request.
Pine Script®指標