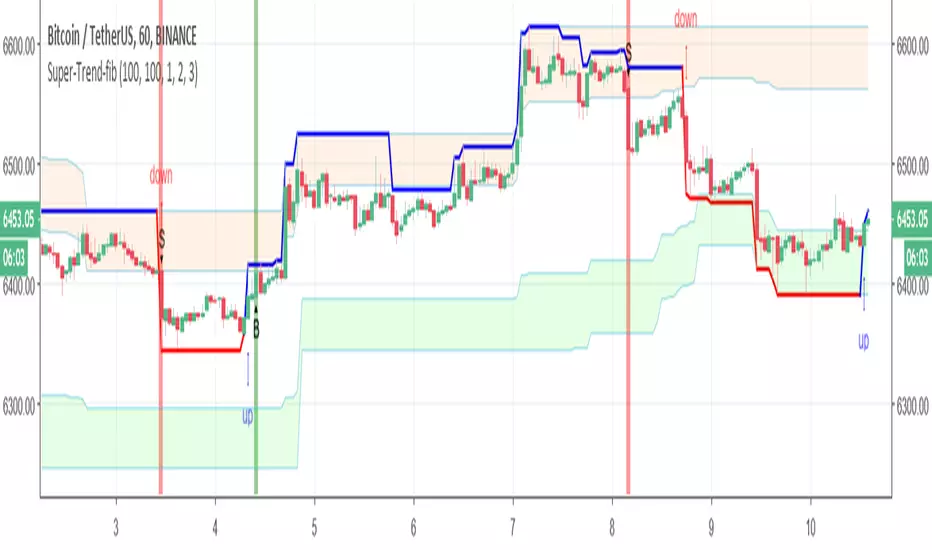
Super-Trend-fibIn this model we have fib Donchian channel with super trend alerts (B=buy) S =sell and trailing volume system up trend alert and down trend alert so have fun Pine Script®指標由RafaelZioni提供44705
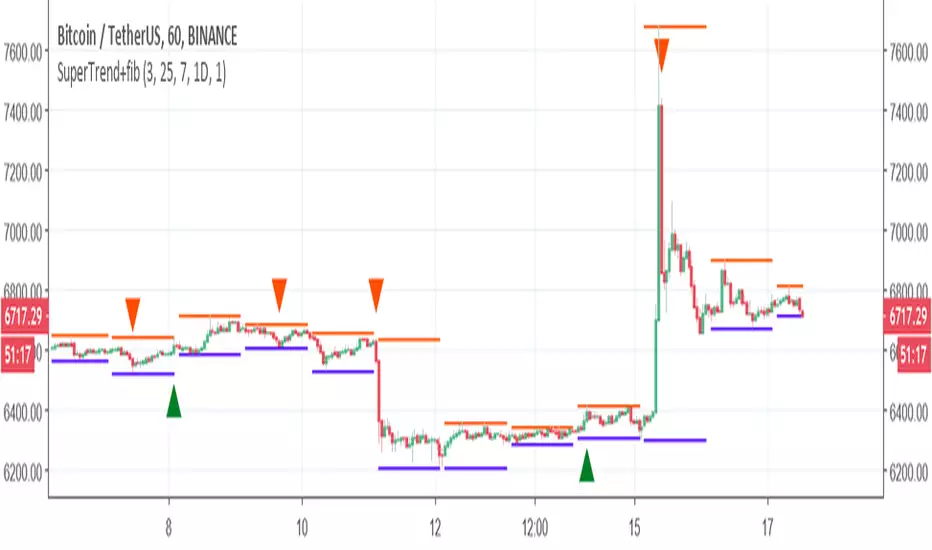
SuperTrend+fibI took the script from here so credit to the author made some slight modification and add fib to make the buy point more stable have fun p.s it can be improve further with addition of some extra, I did not check if it repaint as it not my code Pine Script®指標由RafaelZioni提供66382
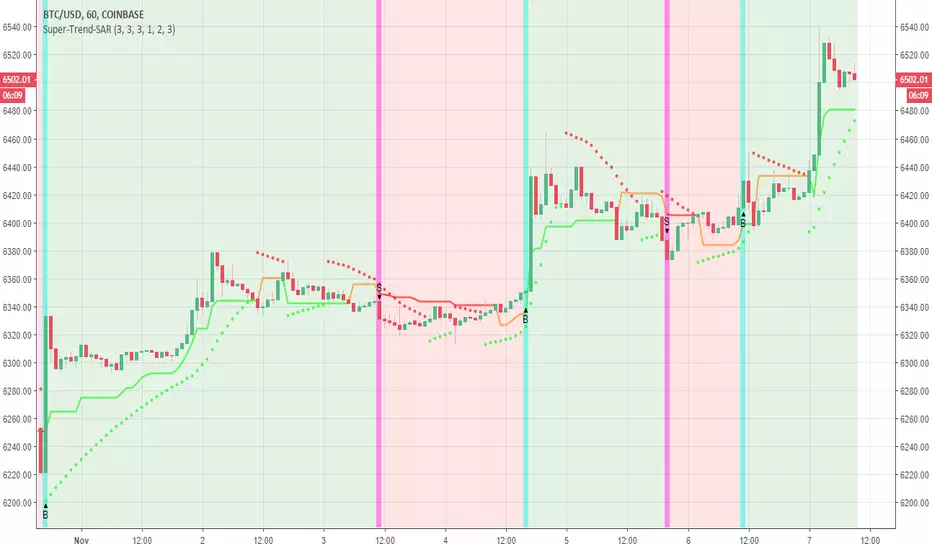
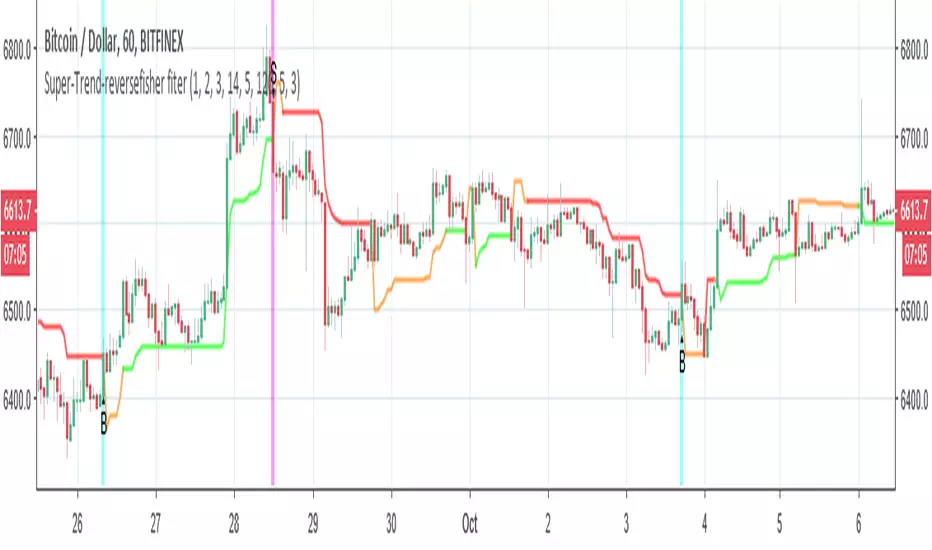
Super-Trend-reversefisher fiterall the code is made here I just change liitle the buy and sell point and add reverse fisher for reducing bad signals. the script can be made better if I add more stuff but for the time being seems ok have funPine Script®指標由RafaelZioni提供1111467
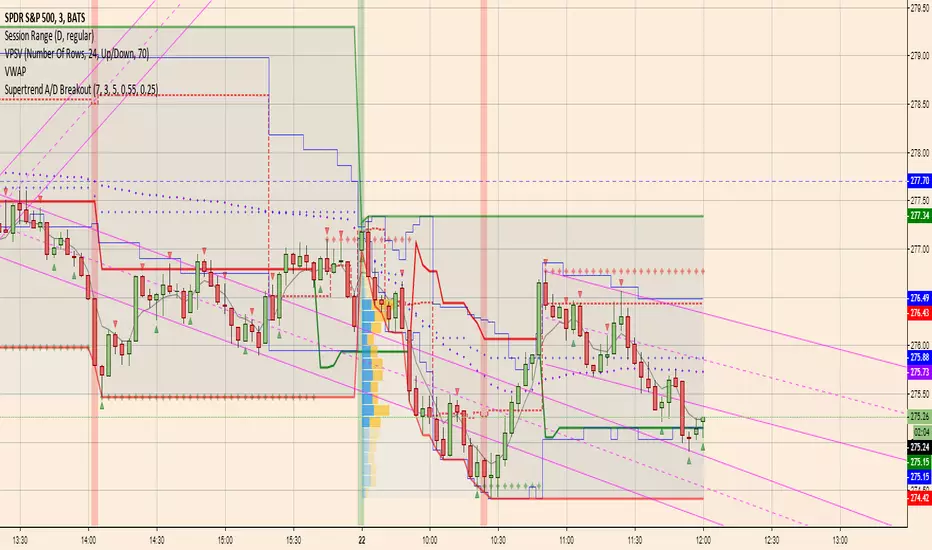
Supertrend A/D BreakoutModified Hoffman A/D: 1. uses standard supertrend to determine up/down direction (previous version used ema crossover) 2. uses improved A/D candlestick patterns I'm optimistic about this onePine Script®指標由ParCorn提供已更新 240
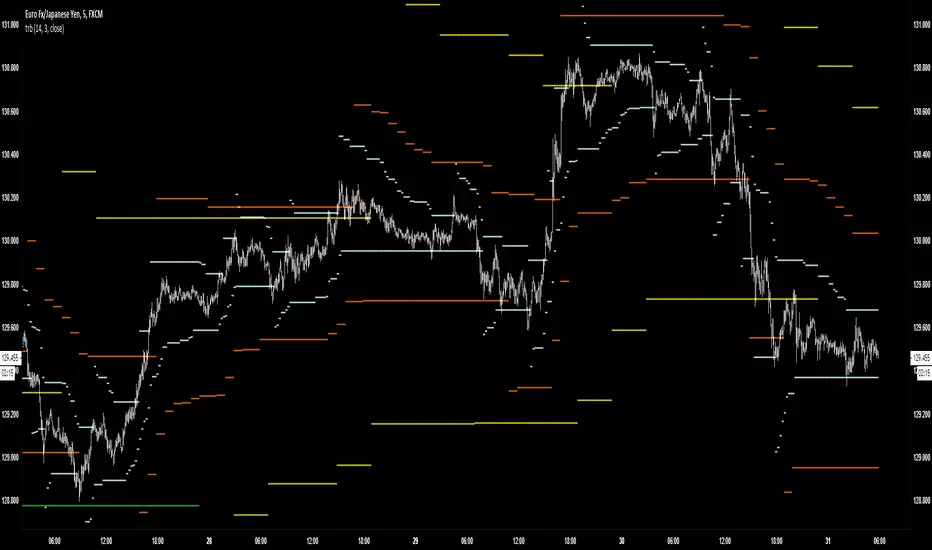
TRBTrue Range Bands; the 'Supertrend', also known as a volatility stop, using a 14 period length and 3x multiplier.Pine Script®指標由j1O9SB提供已更新 22134
VMA's (T=1h, 2h, 4h, 8h)Plots four VMA's (Variable/Volatility Moving Average) in multiple static resolutions (1h, 2h, 4h, 8h), ideal for support/resistance/stops on predictably trending symbols like BTCUSD. Example: Pine Script®指標由the_Vth提供218
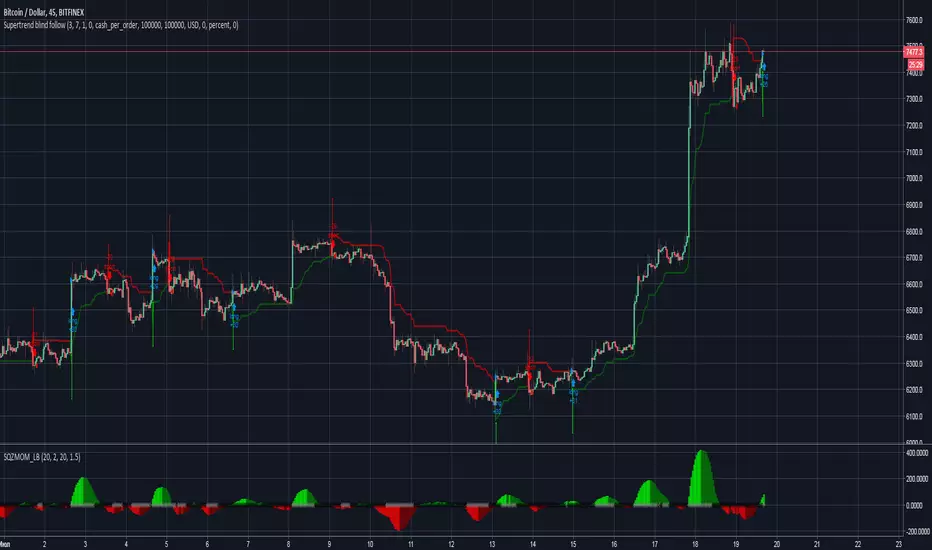
Supertrend blind followingThis strategy is showing what would be if you just follow supertrand indicator. As we know, supertrand doesn't appear immediately and we need to wait the next bar for decision about entering. So you can see what will happen if you take position after supertrend finally formed. This indicator is extremely dangerous without another tools and can give very serious drawdown. Take care of yourself...Pine Script®策略由Andy_Kruch提供33193
SuperTrend_ChannelThis set up created to understand support and resistance as per ATR (Average True Range) Existing setup of supertrend modified to Channel set up It is created for study purpose , Buying or selling not suggested as per this Thank you Pine Script®指標由smir14提供547
SuperTrend Multi Time Frame with Alerts V.1SuperTrend Multi Time Frame with Alerts. You can add long and short alerts for all supertrend viewed on the graph. The script plot 5min, 1H and D Supertrend. Enjoy! Pine Script®指標由DieciTrader提供55431
SuperTrend MultiTimeFrame with Alerts V.1SuperTrend Multi Time Frame with Multi Alerts ... you can insert alerts for all supertrend viewed on graph. Different alerts for long and short. This script plot 5min, 1H and 1D! Enjoy! Pine Script®指標由DieciTrader提供11247
Supertrend Grid 1.0See the current pair's Supertrend direction on 4 different timeframes at once, so you won't get caught with your pants down trading against the trend. Handy for quickly space-barring through a watchlist. Default settings are (from top to bottom) Daily, 4H, 1H and 15M but these can be changed. Any suggestions, let me know.Pine Script®指標由scarf提供已更新 1010615
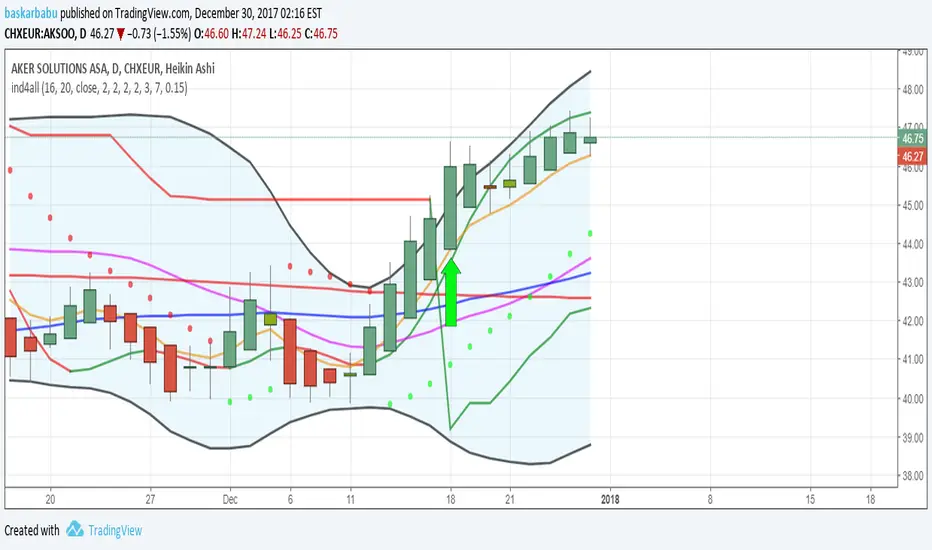
All indicators in one!All indicators in one! Hull MA (2 colors) + Bollinger Bands + 6 EMA + 50 SMA + 200 SMA + Parabolic SAR + SUPER TREND (2 colors) + Doji signals (yellow) Pine Script®指標由baskarbabu提供已更新 1010 1.5 K
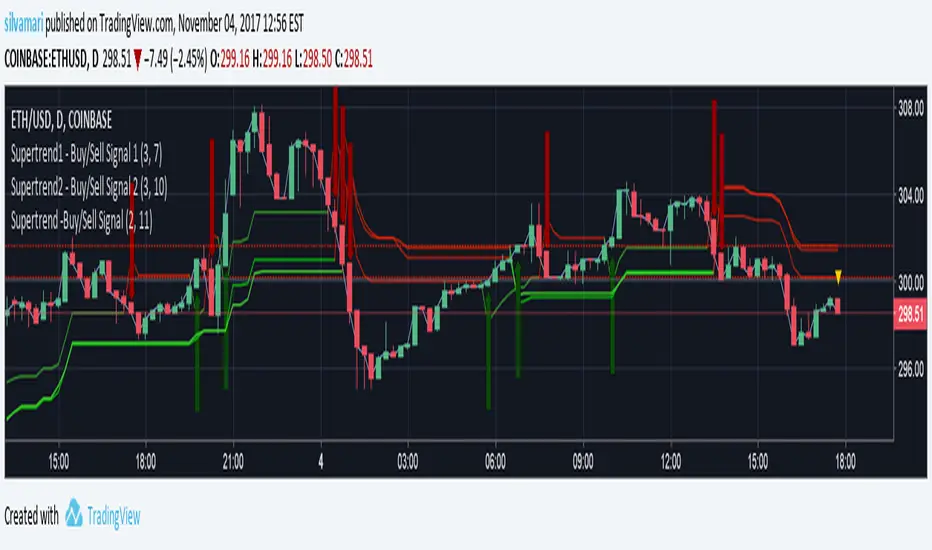
Supertrend - 3 signal settings - (Long/Short entry tool)Using SuperTrend lines to indicate a good time for entering on long or short; 3 supertrend settings together. All 3 lines must agree in order to confirm entry. Works like magic! Feel free to combine with any other of your trusted tools in making decisions. -------------- Disclaimer: Above stated is only my personal method, and should not be seen or used as trading advise. Be sure to do further analysis in order to make your decisions in trading. Your trading decisions and methods of are at your own risk. Pine Script®指標由silvamari提供33785
Supertrend CloudSupertrend is a simple yet great indicator which is based hard data, especially when combined with an additional ST line which has its multiplication doubled. Enjoy :)Pine Script®指標由bitshine_提供66 1.2 K
SuperTrend V.1 AlertThis script is to use with "SuperTrend V1.0 - Buy or Sell Signal" by Rajandran.r Use it with original Strategy for add TradingView Alert. Enjoy!Pine Script®指標由DieciTrader提供1414 1.4 K
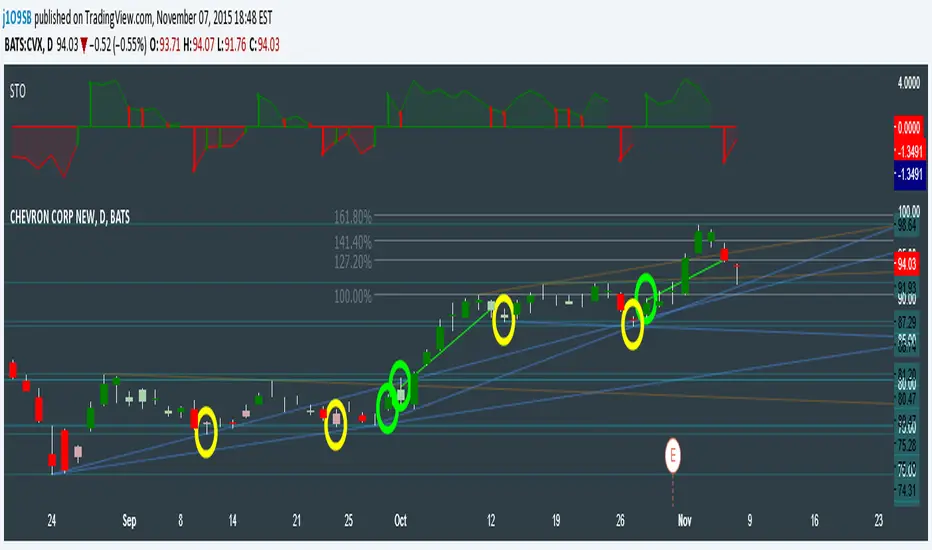
SuperTrend Oscillator v3Version 3: Improved aesthetically, complete turnaround for the strategy with which to use this indicator. Once again, thanks to BlindFreddy and ChrisMoody for the bits of code that were assembled into this indicator. Make the chart yours using the share button for the indicator with barcolors functionality. Changes from v2 and looking forward: Indicator now uses a 14 length SuperTrend with no ATR multiplier. This my preferred use and I'd be grateful to hear your case for a different length/multiplier. Removed the Bollinger Bands and retracement dots due to these being gimmicky and marginally useful. There may be a version 4 should a similar concept using a rate of change analysis turn out to be useful. I have also tried -in vain- to plot internal trend peaks as horizontal S/R levels. Please pm if you are willing to help in that respect. Strategy: The indicator will display the trend as a red/green area. It measures the spread between the closing price and the SuperTrend line, much like a CCI (close and ma). When the area contracts warning bars of the opposite trend color will warn of a reversal. When this happens, these areas will either be defended, reviving the trend, or will break, causing a trend flip. SuperTrend is unique in that breaks are typically large candles, and that its levels, especially on Weekly, Daily, Hourly, Minute timeframes, these levels will be defended (think similar to a 200sma or a 21ema). The STO making new highs within (internal) a trend is an overextension sign. CVX Example: This is not a full analysis of CVX's stock , just an example potential trades. On the posted chart I used a weekly and a daily STO. Long 1:The weekly showed warnings and then flipped. The daily made a double bottom, showed warnings and then flipped the daily STO at trendline support. Long 2:The weekly still shows an uptrend, the daily made a weak break to downtrend and reversed back upwards at trendline support, forming a double bottom. Note the conservative exit when the STO made an internal new high. Long 3: looking forward on CVX stock , the current downtrend made a weak break and is showing sings of reversal (pin bar) at horizontal support. Go long on flip of the daily (conservative) or flip of the hourly (aggressive).Pine Script®指標由j1O9SB提供1313 3 K
SuperTrend OscillatorVersion 3: Improved aesthetically, complete turnaround for the strategy with which to use this indicator. Once again, thanks to BlindFreddy and ChrisMoody for the bits of code that were assembled into this indicator. Make the chart yours using the share button for the indicator with barcolors functionality. Changes from v2 and looking forward: Indicator now uses a 14 length SuperTrend with no ATR multiplier. This my preferred use and I'd be grateful to hear your case for a different length/multiplier. Removed the Bollinger Bands and retracement dots due to these being gimmicky and marginally useful. There may be a version 4 should a similar concept using a rate of change analysis turn out to be useful. I have also tried -in vain- to plot internal trend peaks as horizontal S/R levels. Please pm if you are willing to help in that respect. Strategy: The indicator will display the trend as a red/green area. It measures the spread between the closing price and the SuperTrend line, much like a CCI (close and ma). When the area contracts warning bars of the opposite trend color will warn of a reversal. When this happens, these areas will either be defended, reviving the trend, or will break, causing a trend flip. SuperTrend is unique in that breaks are typically large candles, and that its levels, especially on Weekly, Daily, Hourly, Minute timeframes, these levels will be defended (think similar to a 200sma or a 21ema). The STO making new highs within (internal) a trend is an overextension sign. CVX Example: This is not a full analysis of CVX's stock, just an example potential trades. On the posted chart I used a weekly and a daily STO. Long 1:The weekly showed warnings and then flipped. The daily made a double bottom, showed warnings and then flipped the daily STO at trendline support. Long 2:The weekly still shows an uptrend, the daily made a weak break to downtrend and reversed back upwards at trendline support, forming a double bottom. Note the conservative exit when the STO made an internal new high. Long 3: looking forward on CVX stock, the current downtrend made a weak break and is showing sings of reversal (pin bar) at horizontal support. Go long on flip of the daily (conservative) or flip of the hourly (aggressive).Pine Script®指標由j1O9SB提供22579